

Quantitative network mapping of the human kinome interactome reveals new clues for rational kinase inhibitor discovery and individualized cancer therapy
- PMID: 25003367
- PMCID: PMC4116514
- DOI: 10.18632/oncotarget.1984
Quantitative network mapping of the human kinome interactome reveals new clues for rational kinase inhibitor discovery and individualized cancer therapy
Abstract
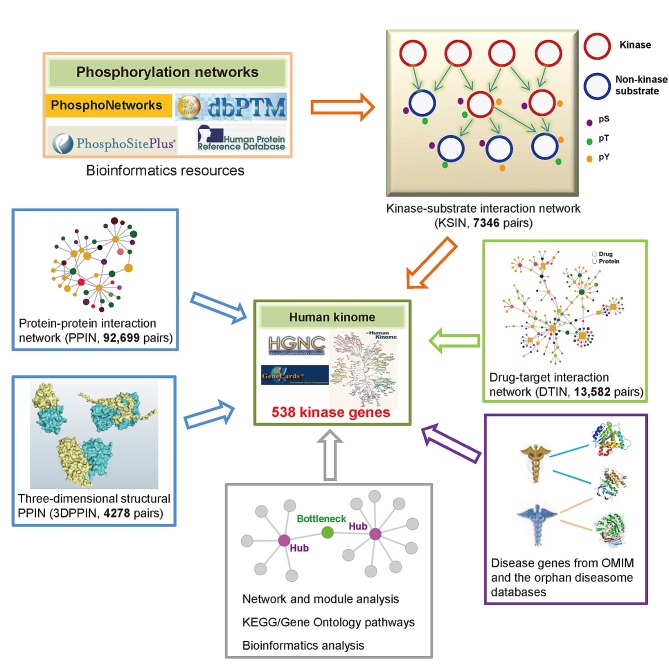
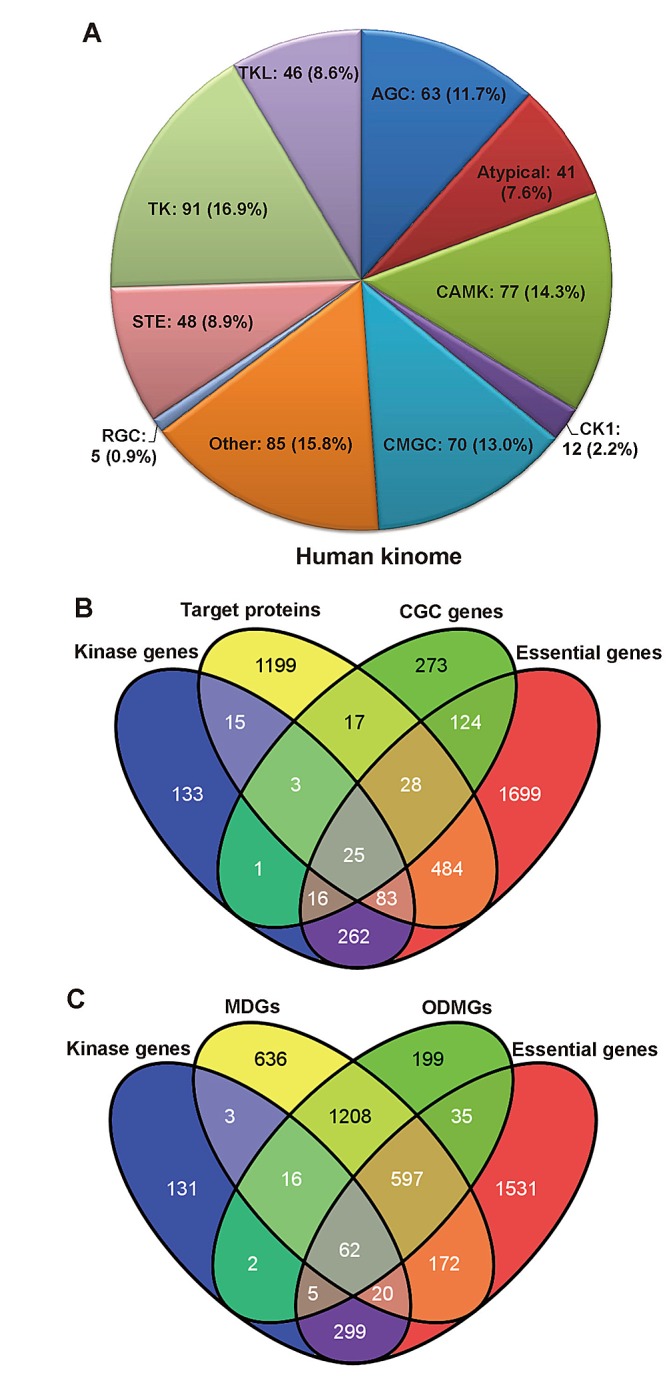
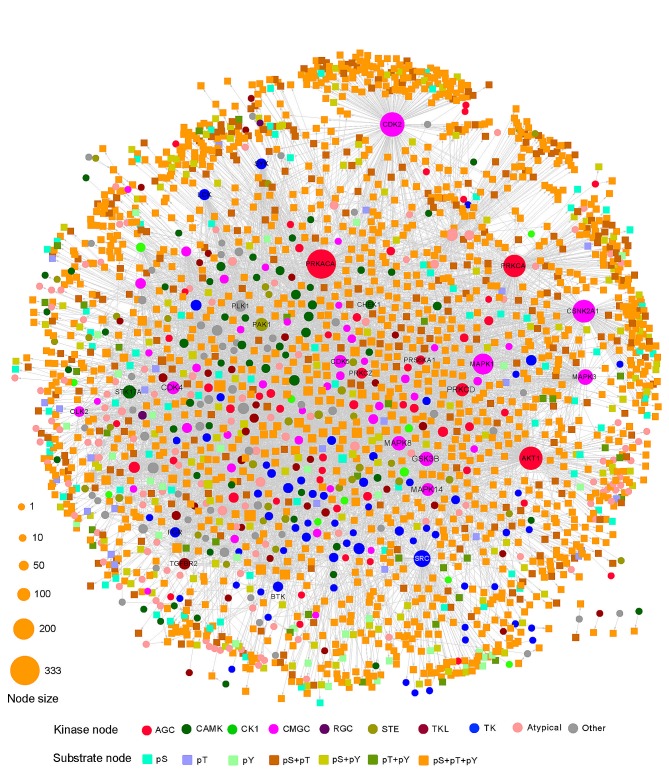
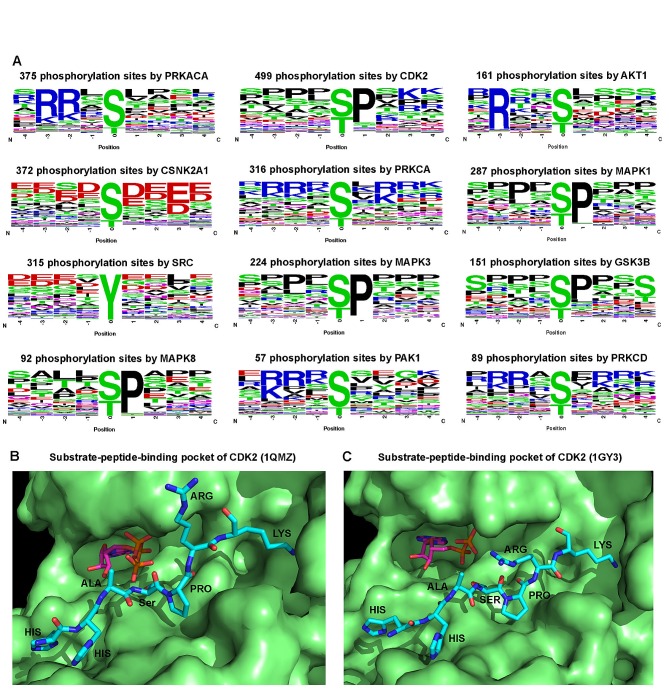
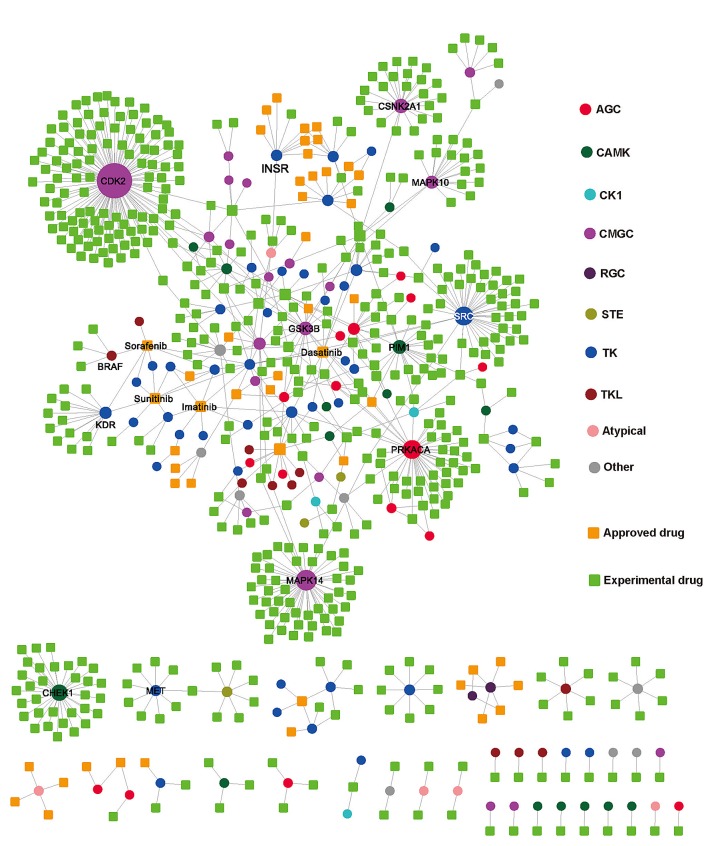
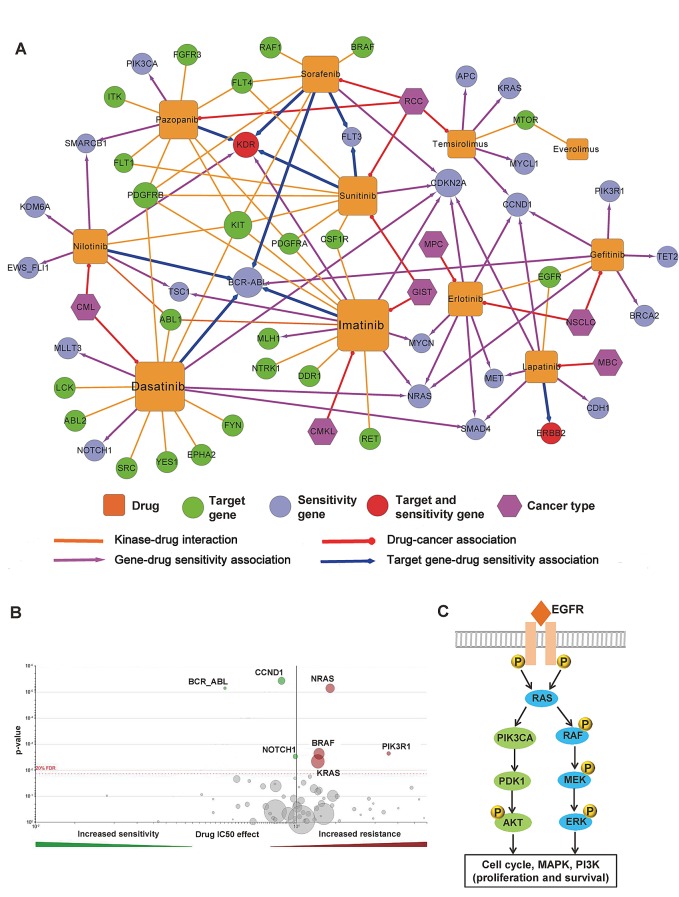
The human kinome is gaining importance through its promising cancer therapeutic targets, yet no general model to address the kinase inhibitor resistance has emerged. Here, we constructed a systems biology-based framework to catalogue the human kinome, including 538 kinase genes, in the broader context of the human interactome. Specifically, we constructed three networks: a kinase-substrate interaction network containing 7,346 pairs connecting 379 kinases to 36,576 phosphorylation sites in 1,961 substrates, a protein-protein interaction network (PPIN) containing 92,699 pairs, and an atomic resolution PPIN containing 4,278 pairs. We identified the conserved regulatory phosphorylation motifs (e.g., Ser/Thr-Pro) using a sequence logo analysis. We found the typical anticancer target selection strategy that uses network hubs as drug targets, might lead to a high adverse drug reaction risk. Furthermore, we found the distinct network centrality of kinases creates a high anticancer drug resistance risk by feedback or crosstalk mechanisms within cellular networks. This notion is supported by the systematic network and pathway analyses that anticancer drug resistance genes are significantly enriched as hubs and heavily participate in multiple signaling pathways. Collectively, this comprehensive human kinome interactome map sheds light on anticancer drug resistance mechanisms and provides an innovative resource for rational kinase inhibitor design.
Conflict of interest statement
Z.Z. and F.C. conceived and designed the study. F.C. carried out experiments. F.C., P.J. and Q.W. analyzed the data. F.C. and Z.Z. interpreted the results and wrote the manuscript.
The authors declare that they have no conflict of interest.
Figures
Similar articles
-
INTEGRATING GENETIC AND STRUCTURAL DATA ON HUMAN PROTEIN KINOME IN NETWORK-BASED MODELING OF KINASE SENSITIVITIES AND RESISTANCE TO TARGETED AND PERSONALIZED ANTICANCER DRUGS.Pac Symp Biocomput. 2016;21:45-56. Pac Symp Biocomput. 2016. PMID: 26776172
-
A broad activity screen in support of a chemogenomic map for kinase signalling research and drug discovery.Biochem J. 2013 Apr 15;451(2):313-28. doi: 10.1042/BJ20121418. Biochem J. 2013. PMID: 23398362
-
Systematic Profiling and Evaluation of Structure-based Kinase-Inhibitor Interactome in Cervical Cancer by Integrating In Silico Analyses and In Vitro Assays at Molecular and Cellular Levels.Comput Biol Chem. 2019 Jun;80:324-332. doi: 10.1016/j.compbiolchem.2019.04.016. Epub 2019 May 1. Comput Biol Chem. 2019. PMID: 31078911
-
New Perspectives, Opportunities, and Challenges in Exploring the Human Protein Kinome.Cancer Res. 2018 Jan 1;78(1):15-29. doi: 10.1158/0008-5472.CAN-17-2291. Epub 2017 Dec 18. Cancer Res. 2018. PMID: 29254998 Review.
-
Targeting Kinase Interaction Networks: A New Paradigm in PPI Based Design of Kinase Inhibitors.Curr Top Med Chem. 2019;19(6):467-485. doi: 10.2174/1568026619666190304155711. Curr Top Med Chem. 2019. PMID: 31184298 Review.
Cited by
-
KEA3: improved kinase enrichment analysis via data integration.Nucleic Acids Res. 2021 Jul 2;49(W1):W304-W316. doi: 10.1093/nar/gkab359. Nucleic Acids Res. 2021. PMID: 34019655 Free PMC article.
-
FD5180, a Novel Protein Kinase Affinity Probe, and the Effect of Bead Loading on Protein Kinase Identification.ACS Omega. 2017 Jul 31;2(7):3828-3838. doi: 10.1021/acsomega.7b00020. Epub 2017 Jul 25. ACS Omega. 2017. PMID: 30023706 Free PMC article.
-
A genome-wide positioning systems network algorithm for in silico drug repurposing.Nat Commun. 2019 Aug 2;10(1):3476. doi: 10.1038/s41467-019-10744-6. Nat Commun. 2019. PMID: 31375661 Free PMC article.
-
Community-driven roadmap for integrated disease maps.Brief Bioinform. 2019 Mar 25;20(2):659-670. doi: 10.1093/bib/bby024. Brief Bioinform. 2019. PMID: 29688273 Free PMC article. Review.
-
Network-based approach to prediction and population-based validation of in silico drug repurposing.Nat Commun. 2018 Jul 12;9(1):2691. doi: 10.1038/s41467-018-05116-5. Nat Commun. 2018. PMID: 30002366 Free PMC article.
References
-
- Cohen P, Tcherpakov M. Will the ubiquitin system furnish as many drug targets as protein kinases? Cell. 2010;143:686–693. - PubMed
-
- Cohen P. Protein kinases--the major drug targets of the twenty-first century? Nat Rev Drug Discov. 2002;1:309–315. - PubMed
-
- Pao W, Hutchinson KE. Chipping away at the lung cancer genome. Nat Med. 2012;18:349–351. - PubMed
Publication types
MeSH terms
Substances
Grants and funding
LinkOut - more resources
Full Text Sources
Other Literature Sources
