. 2014 Jul 8;9(7):e101294.
doi: 10.1371/journal.pone.0101294. eCollection 2014.

Budding yeast kinetochore proteins, Chl4 and Ctf19, are required to maintain SPB-centromere proximity during G1 and late anaphase

Affiliations

Budding yeast kinetochore proteins, Chl4 and Ctf19, are required to maintain SPB-centromere proximity during G1 and late anaphase

Soumitra Sau et al. PLoS One. .

Abstract

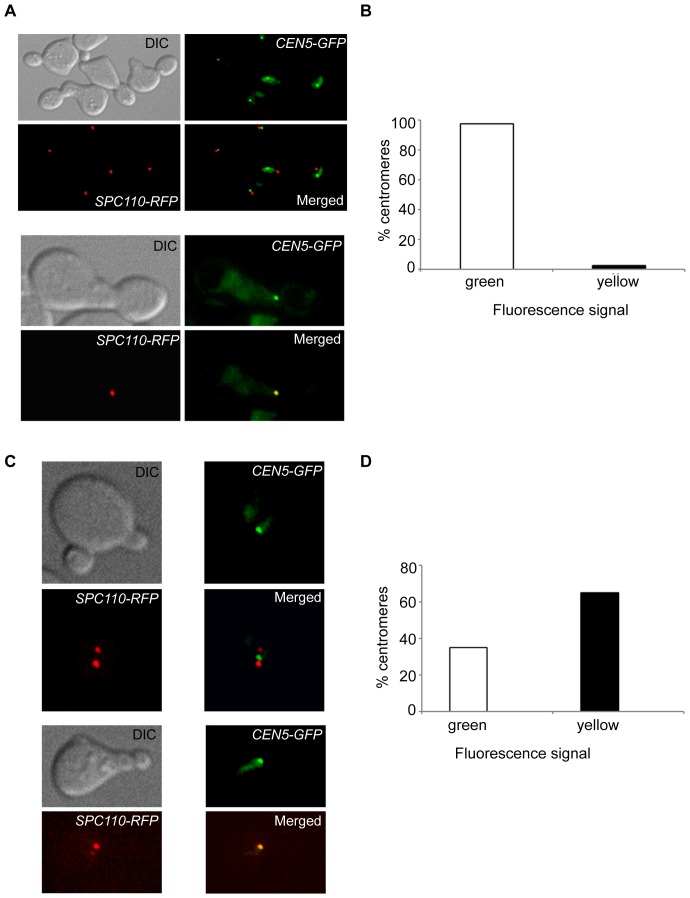
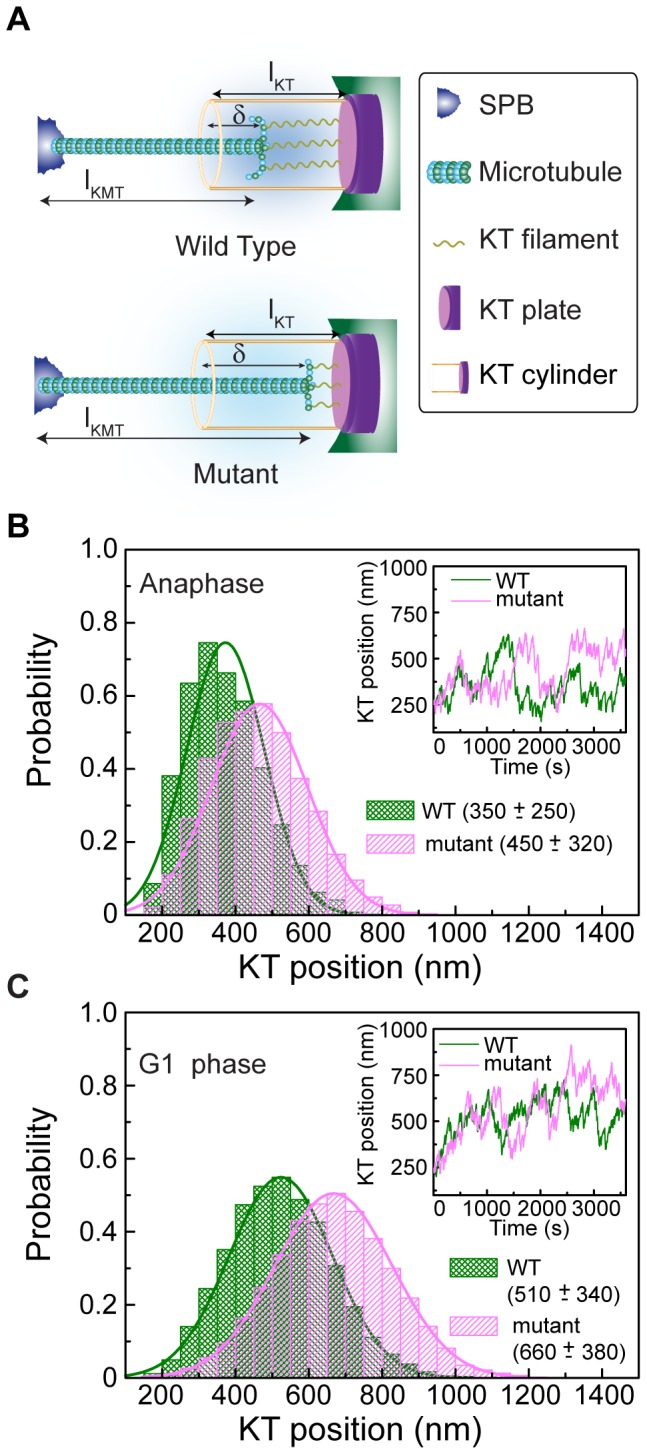
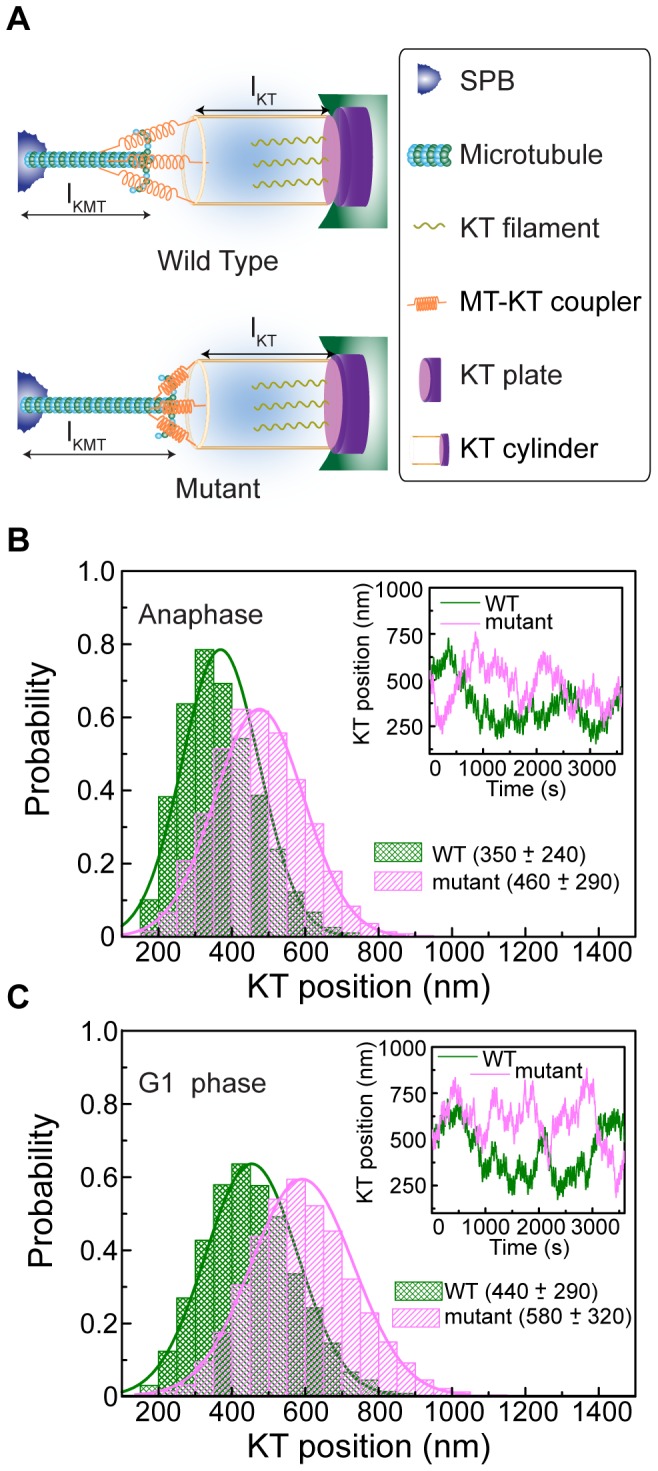
In the budding yeast, centromeres stay clustered near the spindle pole bodies (SPBs) through most of the cell cycle. This SPB-centromere proximity requires microtubules and functional kinetochores, which are protein complexes formed on the centromeres and capable of binding microtubules. The clustering is suggested by earlier studies to depend also on protein-protein interactions between SPB and kinetochore components. Previously it has been shown that the absence of non-essential kinetochore proteins of the Ctf19 complex weakens kinetochore-microtubule interaction, but whether this compromised interaction affects centromere/kinetochore positioning inside the nucleus is unknown. We found that in G1 and in late anaphase, SPB-centromere proximity was disturbed in mutant cells lacking Ctf19 complex members,Chl4p and/or Ctf19p, whose centromeres lay further away from their SPBs than those of the wild-type cells. We unequivocally show that the SPB-centromere proximity and distances are not dependent on physical interactions between SPB and kinetochore components, but involve microtubule-dependent forces only. Further insight on the positional difference between wild-type and mutant kinetochores was gained by generating computational models governed by (1) independently regulated, but constant kinetochore microtubule (kMT) dynamics, (2) poleward tension on kinetochore and the antagonistic polar ejection force and (3) length and force dependent kMT dynamics. Numerical data obtained from the third model concurs with experimental results and suggests that the absence of Chl4p and/or Ctf19p increases the penetration depth of a growing kMT inside the kinetochore and increases the rescue frequency of a depolymerizing kMT. Both the processes result in increased distance between SPB and centromere.


Conflict of interest statement

Competing Interests: The authors have declared that no competing interests exist.

Figures

Figure 1
Figure 1. Average SPB-centromere distances are greater in mutant than in wild-type cells in late anaphase.
US3329 (CHL4 CTF19; wild-type), US3329Δchl4 (chl4), US3329Δctf19 (ctf19) and US3329Δctf19Dchl4 (chl4 ctf19) cells, each carrying CEN5-GFP tag, were grown to log phase in YEPD medium at 30°C and then arrested at G2/M using nocodazole (15 µg/ml) for 90 minutes. Cells were fixed with formaldehyde after 30 minutes of release from G2/M, to maximize the population of anaphase cells. MTs and spindle pole bodies (SPB) were stained with anti-α-tubulin antibody, YOL1/34. Images were captured and analyzed by confocal microscopy. (A) Large budded cells having anaphase B spindles showing colocalization (upper panel) and non-colocalization (lower panel) of CEN5 (green dot) with SPB (bright red spot at the end of the spindle, from where astral and nuclear MTs emanated). Arrows in merged panels indicate CEN5-SPB colocalization (upper panel) and non colocalization (lower panel). Scale bar, 0.5 µm. (B and C) 3D distances from the center of CEN5-GFP dot to the center of spindle pole were measured in cells having long anaphase spindles. Images were taken at 0.5 µm z-sections for (B) and at 0.2 µm z-sections for (C). For (C), two independent experiments were performed with wild-type and chl4 ctf19 strains and the data represents averages obtained from these experiments, error bars indicating deviations from the average. For both B and C, ‘n’ refers to the number of centromeres analyzed and insets show % centromeres within 0–300 nm from their SPBs. (D) Histogram depicts percentages of colocalized CEN5 and spindle pole obtained from (C). The bars are the deviations from mean values. (E) The average distances between centromere and SPB in wild-type and mutant cells, obtained from B (Experiment 1) and C (Experiment 2; pooled from two experiments) are summarized. Next column displays the average of Experiments 1 and 2. Standard deviations from average values are in parenthesis. ‘-‘ indicates not done.
Figure 2
Figure 2. Protein-protein interactions between SPB and KT components do not contribute to SPB-centromere proximity.
Exponentially growing cells of the wild-type strain PS1 (CHL4 CTF19), carrying its CEN5 tagged with GFP and its Spc110p (an SPB protein) tagged with the RFP, were arrested in G1 by α-factor for 120 minutes. Thereafter, the cells were released from G1 arrest at 30°C in YEPD carrying nocodazole (15 µg/ml) or no nocodazole (control cells). Cells subjected to nocodazole were fixed with formaldehyde and processed for fluorescence microscopy 2 hours after release from G1 arrest. Control cells were fixed and processed similarly after 40 minutes of release from G1 arrest. (A) Upper two panels show a field of nocodazole-treated cells, each having its CEN5 (green dot) non-colocalized with its SPB (red spot due to Spc110p-RFP). Lower two panels show the lone cell (one out of a total of forty analyzed) having its CEN5 colocalized with SPB. (B) The bar diagram depicts percentages of centromeres which overlapped (yellow dots) and did not overlap (green dots) with SPB in the presence of nocodazole. (C) Fluorescence microscopy images of control (untreated with nocodazole) cells having non-overlapping (upper two panels) and overlapping (lower two panels) signals of CEN5-GFP and Spc110p-RFP (SPB). Note that the two SPBs (each tagged with Spc110-RFP) get separated from each other by MTs (not stained in this experiment) due to the absence of nocodazole. (D) The bar diagram represents percentages of centromeres showing overlapping (yellow) and non-overlapping (green and red) CEN5 and SPB signals in S-phase in the presence of MTs. A total of 68 cells with two SPBs (indicated by two Spc110-RFP spots) were analyzed.
Figure 3
Figure 3. ctf19 cells show increased average SPB-centromere distance at G1.
PS1 (wild-type) and PS1Δctf19 (ctf19) cells were arrested at G1 using α-factor (10 µg/ml) for 120 minutes and fixed with 4% paraformaldehyde (PFA) for 10 minutes at RT. At least 20 z-sections of 0.25 µm were imaged. (A) G1 cells from PS1 (upper panel) and PS1Δctf19 (lower panel) are shown. Yellow or partial yellow indicates overlapping of SPB (Spc110p-RFP) and centromere (CEN5-GFP). Scale bars, 2 µm. (B) The 3D distance between SPB and CEN5 was measured in G1 arrested cells and plotted. 29 cells of the wild-type and 30 cells of the mutant were analyzed.
Figure 4
Figure 4. Altered catastrophe rate of kMT predicts KT positioning.
(A) Schematic representation of kMT-KT interaction, showing various ingredients used in the model. In this model, the catastrophe events of the kMT depend on the applied resistance, instantaneous length (l kMT) and depth of penetration (δ). Mutation weakens the effective stiffness of the KT fibrils (represented by springs), thereby enhances the kMT polymerization. This effectively pushes the mutated KT away from the SPB. (B) Probability distribution of the KT position measured from the SPB during anaphase. Green and magenta (color online) represent wild-type (WT) and mutant distributions, respectively. The average distances of the KT from the SPB are ∼350 nm for the wild-type and ∼450 nm for the mutant. Shifting of the mutant distribution to the right signifies a larger KT distance from the SPB. Inset shows the temporal change in the KT position for WT (green) and mutant (magenta). (C) Probability distribution of the KT position during G1 phase, plotted in the same manner as in (B). The average distances of the KT from the SPB are ∼510 nm and ∼660 nm for the wild-type and the mutant, respectively. Inset showing the time dependent position of the KT for both wild-type and mutant.
Figure 5
Figure 5. Altered rescue frequency of kMT predicts KT positioning.
(A) Schematic is similar to Figure 4A. In this approach, the rescue frequency of the kMT is regulated by the tension applied on the kMT mediated by couplers. Mutation makes the couplers stiffer and thereby generates higher tension at the kMT tip. Thus in the mutant cell, frequent rescue of the kMT increases the equilibrium distance between SPB and KT. (B) Probability distribution of the KT position during anaphase, similar to Figure 4B. The average distances of the KT from the SPB are ∼350 nm for the wild-type and ∼460 nm for the mutant. Temporal change in the KT position for the WT (green) and the mutant (magenta) is shown in the inset. (C) Probability distribution of the KT position during G1 phase, plotted in the same manner as in (B). The average distances of the KT from the SPB are ∼440 nm and ∼580 nm for the wild-type and the mutant, respectively. Inset displays the time dependent position of the KT for both wild-type and mutant.

Similar articles

Cited by

References

    1. McAinsh AD, Tytell JD, Sorger PK (2003) STRUCTURE, FUNCTION, AND REGULATION OF BUDDING YEAST KINETOCHORES. Annu Rev Cell Dev Biol 19: 519–539. - PubMed
    1. Westermann S, Drubin DG, Barnes G (2007) Structures and Functions of Yeast Kinetochore Complexes. Annu Rev Biochem 76: 563–591. - PubMed
    1. Santaguida S, Musacchio A (2009) The life and miracles of kinetochores. EMBO J 28: 2511–2531. - PMC - PubMed
    1. Cho U-S, Corbett KD, Al-Bassam J, Bellizzi JJ, De Wulf P, et al. (2010) Molecular Structures and Interactions in the Yeast Kinetochore. Cold Spring Harbor Symp Quant Biol 75: 395–401. - PMC - PubMed
    1. De Wulf P, McAinsh AD, Sorger PK (2003) Hierarchical assembly of the budding yeast kinetochore from multiple subcomplexes. Genes Dev 17: 2902–2921. - PMC - PubMed

Publication types

MeSH terms

Substances

LinkOut - more resources