. 2014 Jul 8;9(7):e102137.
doi: 10.1371/journal.pone.0102137. eCollection 2014.

Uremic conditions drive human monocytes to pro-atherogenic differentiation via an angiotensin-dependent mechanism

Affiliations

Uremic conditions drive human monocytes to pro-atherogenic differentiation via an angiotensin-dependent mechanism

Bogusz Trojanowicz et al. PLoS One. .

Abstract

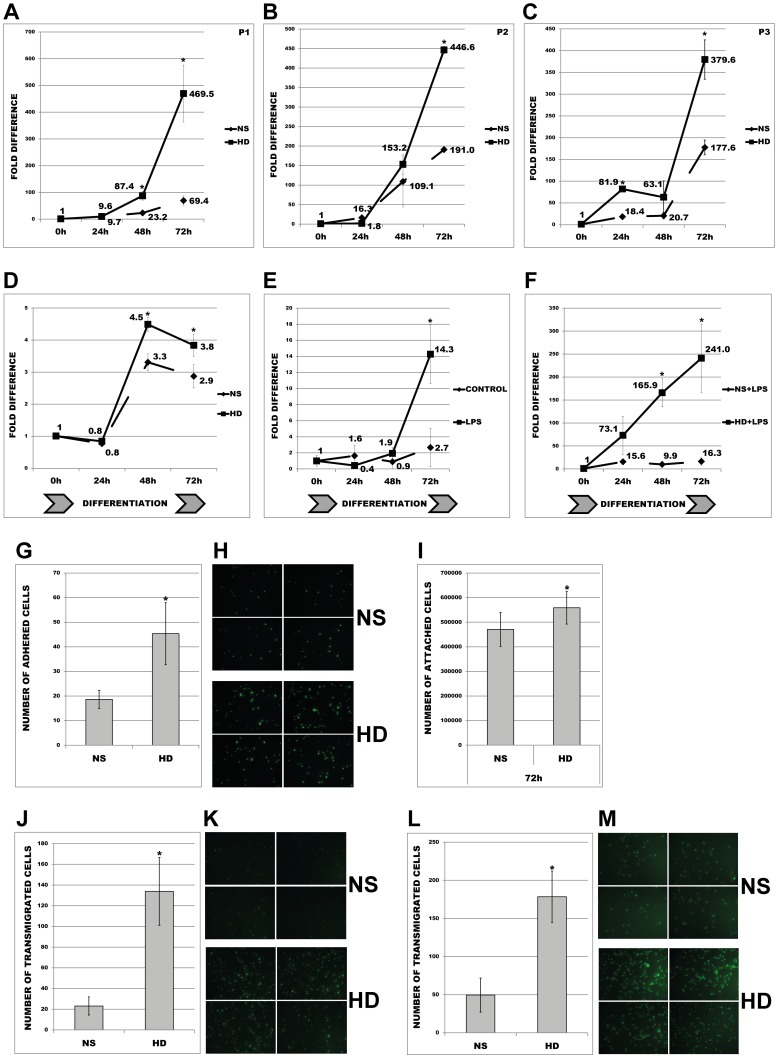
Aims: Elevated expression levels of monocytic-ACE have been found in haemodialysis patients. They are not only epidemiologically linked with increased mortality and cardiovascular disease, but may also directly participate in the initial steps of atherosclerosis. To further address this question we tested the role of monocytic-ACE in promotion of atherosclerotic events in vitro under conditions mimicking those of chronic renal failure.

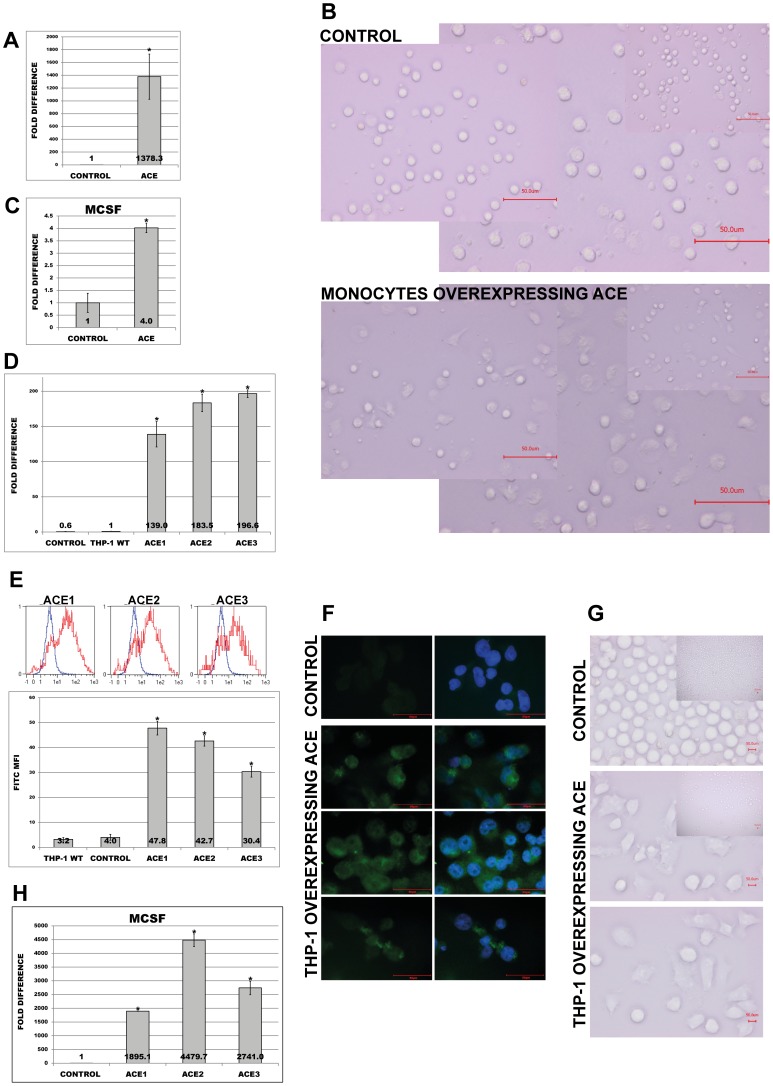
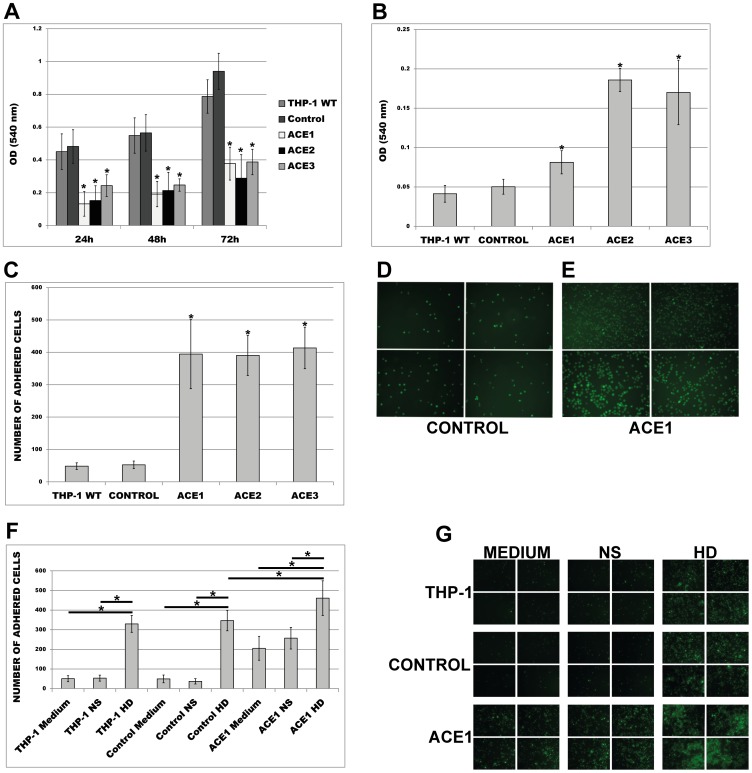
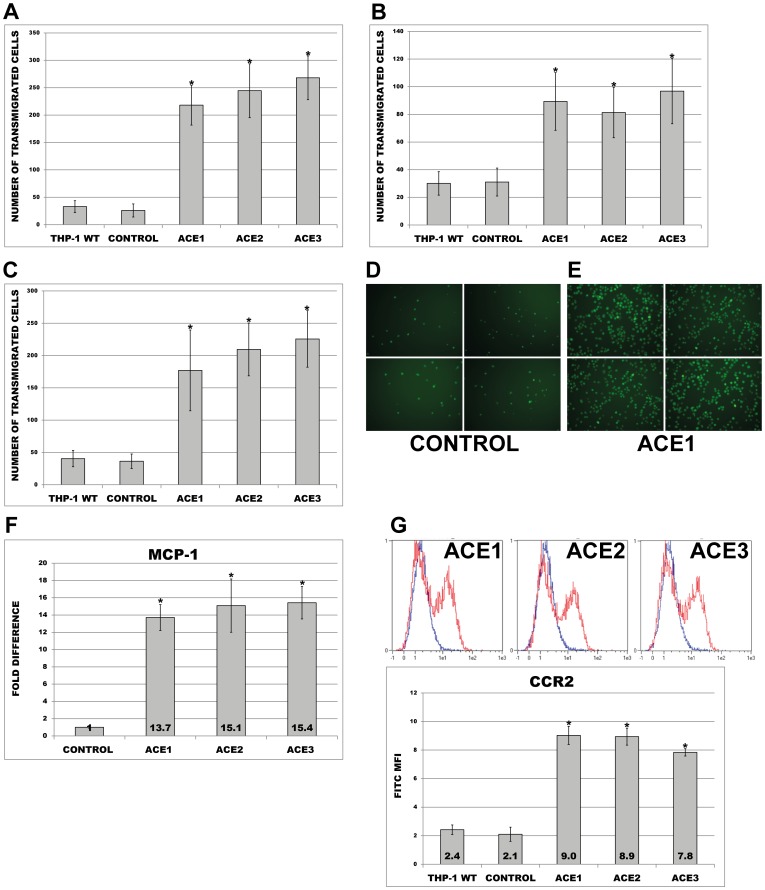
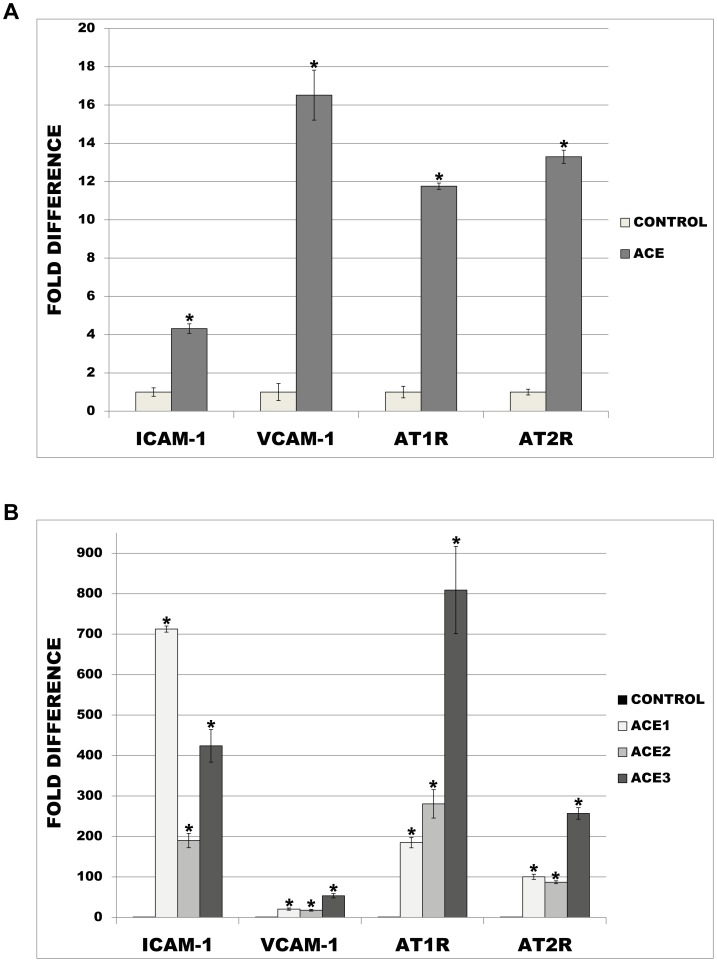
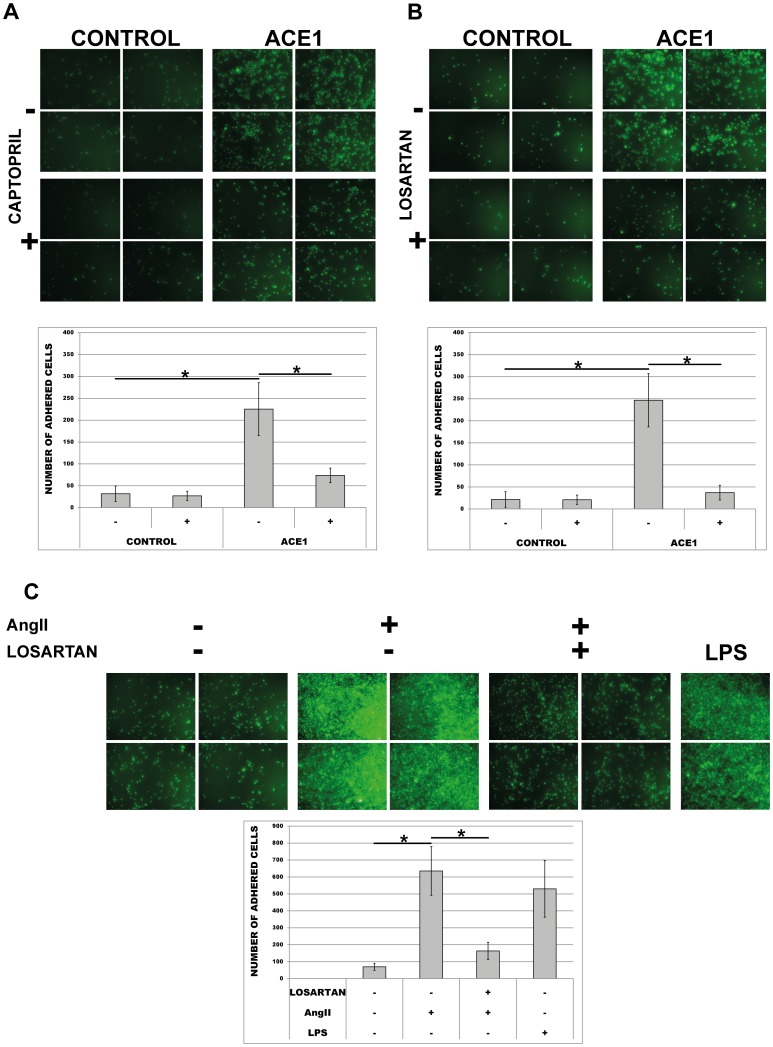
Methods and results: Treatment of human primary monocytes or THP-1 cells with uremic serum as well as PMA-induced differentiation led to significantly up-regulated expression of ACE, further increased by additional treatment with LPS. Functionally, these monocytes revealed significantly increased adhesion and transmigration through endothelial monolayers. Overexpression of ACE in transfected monocytes or THP-1 cells led to development of more differentiated, macrophage-like phenotype with up-regulated expression of Arg1, MCSF, MCP-1 and CCR2. Expression of pro-inflammatory cytokines TNFa and IL-6 were also noticeably up-regulated. ACE overexpression resulted in significantly increased adhesion and transmigration properties. Transcriptional screening of ACE-overexpressing monocytes revealed noticeably increased expression of Angiotensin II receptors and adhesion- as well as atherosclerosis-related ICAM-1 and VCAM1. Inhibition of monocyte ACE or AngII-receptor signalling led to decreased adhesion potential of ACE-overexpressing cells.

Conclusions: Taken together, these data demonstrate that uremia induced expression of monocytic-ACE mediates the development of highly pro-atherogenic cells via an AngII-dependent mechanism.


Conflict of interest statement

Competing Interests: The authors have declared that no competing interests exist.

Figures

Figure 1
Figure 1. Expression of ACE and behaviour of human monocytes under uremic status I.
(A, B, C) Primary human monocytes obtained from healthy volunteers P1, P2, and P3 were treated with 10% NS or HD sera for 72 h and investigated for ACE-mRNA expression. Means ± SD of three independent experiments. (D, E, F) THP-1 monocytes were PMA-differentiated (10 ng/ml) into macrophages in the presence of (D) 10% NS or HD sera or (E) 10 ng/ml LPS or (F) 10 ng/ml LPS and both of them for 72 h. Means ± SD of three independent experiments. (G, H, I) Attachment and adhesion of THP-1 monocytes and primary monocytes treated with NS or HD. Primary human monocytes were incubated in the presence of 10% NS or HD sera for 30 min and investigated for their endothelial-adhesion. The number (G) and corresponding images of endothelial-adhered monocytes (H) are shown. Means ± SD of cell number in 10 microscopic fields in three independent experiments. (I) THP-1 were incubated in the presence of 10% NS or HD sera for 72 h and investigated for their attachment abilities. The number of attached cells (detached prior to counting) was counted by FACS. Means ± SD of four independent experiments. (J, K, L, M) Transmigration of calcein-labelled primary monocytes (J, K) or THP-1 cells (L, M) through endothelial monolayer towards lower chamber filled with RPMI medium supplemented with 10% NS or HD sera. Transmigrated cells were visualized with fluorescent microscopy (K, M) and counted in 10 random fields (J, L). Representative images are shown. Means ± SD of cell number in 10 microscopic fields in three independent experiments. * p< 0.05 indicates statistical significance.
Figure 2
Figure 2. Expression of ACE and behaviour of human monocytes under uremic status II.
(A, B) Primary human monocytes obtained from healthy volunteer P1 were treated with (A) 10% NS or PD or CKD5 or (B) 10% NS or pre- or post-HD sera for 72 h and investigated for ACE-mRNA expression. Means ± SD of three independent experiments. * p< 0.05 (PD vs. NS; pre-HD vs. NS; pre-HD vs. post-HD) and °p<0.05 (CKD5 vs. NS; post-HD vs. NS) indicate statistical significance. (C, D, E, F) Adhesion of primary monocytes treated with NS or PD or CKD5 sera. Primary human monocytes were incubated in the presence of 10% NS or PD or CKD5 sera for 30 min and investigated for their endothelial-adhesion. The number (F) and corresponding images of endothelial-adhered monocytes (C, D, E) are shown. Means ± SD of cell number in 10 microscopic fields in three independent experiments. (G, H, I, J) Transmigration of calcein-labelled primary monocytes through endothelial monolayer towards lower chamber filled with RPMI medium supplemented with 10% NS or PD or CKD5 sera. Transmigrated cells were visualized with fluorescent microscopy (G, H, I) and counted in 10 random fields (J). Representative images are shown. Means ± SD of cell number in 10 microscopic fields in three independent experiments. * p< 0.05 indicates statistical significance.
Figure 3
Figure 3. Expression of ACE and morphology of human monocytes overexpressing ACE.
(A, B, C) Human primary monocytes were transiently transfected with empty or pcDNA3.1(-) plasmid carrying full coding sequence of ACE. Investigations of (A) ACE-expression, (B) cell morphology and (C) MCSF-expression were performed 24 h after transfection. Note differentiated, macrophage-like phenotype of primary monocytes overexpressing ACE. (D, E, F, G, H) Wild type (THP-1 WT), empty plasmid (Control) and ACE-overexpressing cells (ACE1, ACE2, ACE3) were investigated for (D) ACE transcript or (E) protein levels by employment of specific TaqMan probes or FACS analysis. (F) Representative immunofluorescence of control and ACE1 cells stained with FITC-ACE antibody (green) and DAPI staining (blue, nuclear). Note that left panel represents ACE staining only; right panel- ACE expression merged with DAPI; note mostly membrane-cytoplasmic localization of ACE. (G) Representative microscopic analysis of control and ACE1 cells under different magnifications. Note differentiated, macrophage-like phenotype of ACE1 cells. (H) RT-PCR analysis of MCSF expression in control and ACE-overexpressing cells (ACE1, ACE2, ACE3). Means ± SD of three independent experiments. * p< 0.05 indicates statistical significance.
Figure 4
Figure 4. RT-PCR analysis of macrophage markers in control and THP-1 cells overexpressing ACE (ACE1, ACE2 and ACE3).
Analyses were performed with primers specific for Arg1 (A), Arg2 (B), and iNOS (C), and TaqMan probes for TNFa (D) and IL6 (E). * p< 0.05 indicates statistical significance. Means ± SD of three independent experiments.
Figure 5
Figure 5. Proliferation, attachment and adhesion of ACE-overexpressing THP-1 monocytes investigated on wild type (THP-1 WT), empty plasmid (Control) and ACE-overexpressing cells (ACE1, ACE2, ACE3).
(A) MTT-proliferation and (B) attachment of the cells. The cells for (B) were treated with 10 ng/ml PMA for 72 h prior to assay. (C, D, E, F, G) Adhesion of THP-1 to HUVEC endothelial monolayers. Calcein–labelled cells were incubated for 30 min in the presence of endothelial monolayers at the chamber bottom. Means ± SD of three independent experiments. (C) Adhesion under normal conditions (medium only, no FCS). See representative images (D, E). * p< 0.05 vs. control indicates statistical significance. (F) Adhesion under normal conditions or medium supplemented with 10% NS or HD sera. See representative images (G). * p< 0.05 indicates statistical significance. Note that for F and G one representative ACE-overexpressing clone (ACE1) was used. Analyses of (C, D, E, F, G) were performed in 10 random microscopic fields each. Means ± SD of cell number in 10 microscopic fields in three independent experiments.
Figure 6
Figure 6. Transmigration of wild type (THP-1 WT), empty plasmid (Control) and ACE-overexpressing THP-1 monocytes (ACE1, ACE2, ACE3).
(A) Transmigration of calcein-labelled cells through membrane towards (A) medium supplemented with MCP-1 or (B) HUVEC monolayers in the presence of medium only. (C, D, E) Transmigration of the cells through endothelial monolayers under MCP-1. See representative images (D, E). Analyses were performed in 10 random microscopic fields each. Means ± SD of cell number in 10 microscopic fields in three independent experiments. (F, G) Expression of MCP1 and CCR2 by RT-PCR and FACS analysis respectively. * p< 0.05 vs. control indicates statistical significance. Means ± SD of three independent experiments.
Figure 7
Figure 7. RT-PCR analysis of human primary monocytes and THP-1 cells overexpressing ACE.
(A) Primary monocytes were transiently transfected with empty (Control) or ACE-plasmid and subjected to qPCR with primers specific for ICAM-1, VCAM-1, AT1R and AT2R. (B) Analysis of empty plasmid (Control) and ACE-overexpressing THP-1 monocytes (ACE1, ACE2, ACE3) were performed for the same transcripts. * p< 0.05 indicates statistical significance. Means ± SD of three independent experiments.
Figure 8
Figure 8. Effect of the ACE-inhibitor Captopril, the AngII-receptor blocker Losartan and AngII on adhesion of wild type (THP-1 WT), empty plasmid (Control) and ACE-overexpressing cells (ACE1).
Calcein-labelled cells were incubated in the presence or absence of (A) 500 nM captopril or (B) 1 µM losartan for 30 min and tested for their adhesion abilities to endothelial HUVEC monolayers. (C) Endothelial-adhesion of ACE-negative wild type THP-1 cells in the presence of 1 µM AngII only or co-incubation with 1 µM losartan investigated for 30 min. Representative images for (A, B, C) are shown. Analyses for (A, B, C) were performed in 10 random microscopic fields each. * p< 0.05 indicates statistical significance. Means ± SD of cell number in 10 microscopic fields in three independent experiments.

Similar articles

Cited by

References

    1. Foley RN, Parfrey PS, Sarnak MJ (1998) Clinical epidemiology of cardiovascular disease in chronic renal disease. Am J Kidney 32: 112–119. - PubMed
    1. Cheung AK, Sarnak MJ, Yan G, Dwyer JT, Heyka RJ, et al. (2000) Atherosclerotic cardiovascular disease risks in chronic hemodialysis patients. Kidney Int 58: 353–362. - PubMed
    1. Vanholder R, Massy Z, Argiles A, Spasovski G, Verbeke F, et al. (2005) Chronic kidney disease as cause of cardiovascular morbidity and mortality. Nephrol Dial Transplant 20: 1048–1056. - PubMed
    1. Chronic Kidney Disease Prognosis Consortium, Matsushita K, van der Velde M, Astor BC, Woodward M, et al. (2010) Association of estimated glomerular filtration rate and albuminuria with all-cause and cardiovascular mortality in general population cohorts: a collaborative meta-analysis. Lancet 12: 2073–2081. - PMC - PubMed
    1. Tyralla K, Amann K (2003) Morphology of the heart and arteries in renal failure. Kidney Int Suppl 84: 80–83. - PubMed

Publication types