. 2014 Jul 8:5:4344.
doi: 10.1038/ncomms5344.

Tipping elements in the human intestinal ecosystem

Affiliations

Tipping elements in the human intestinal ecosystem

Leo Lahti et al. Nat Commun. .

Abstract

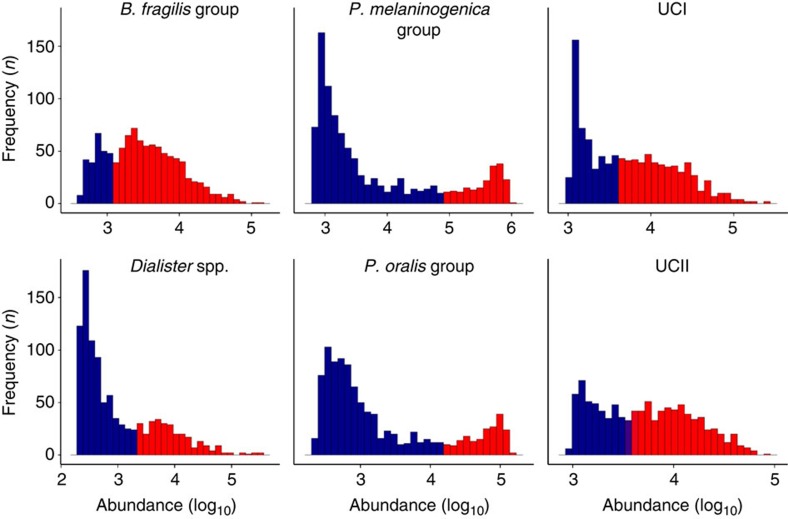
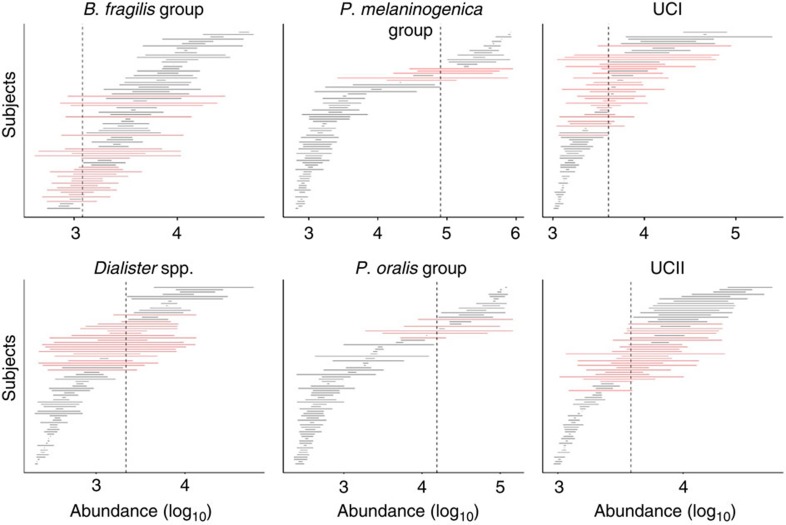
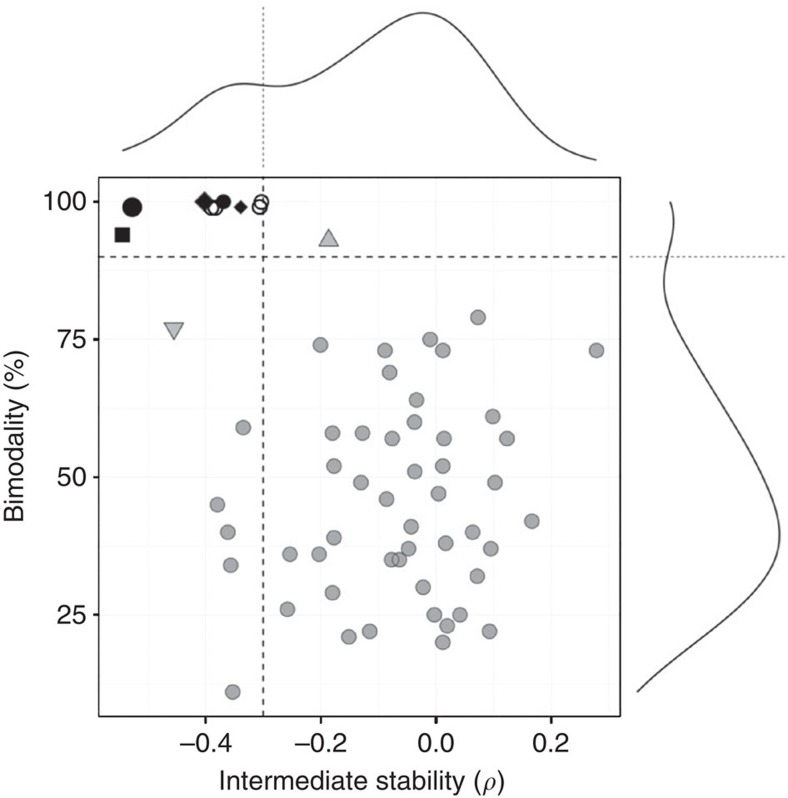
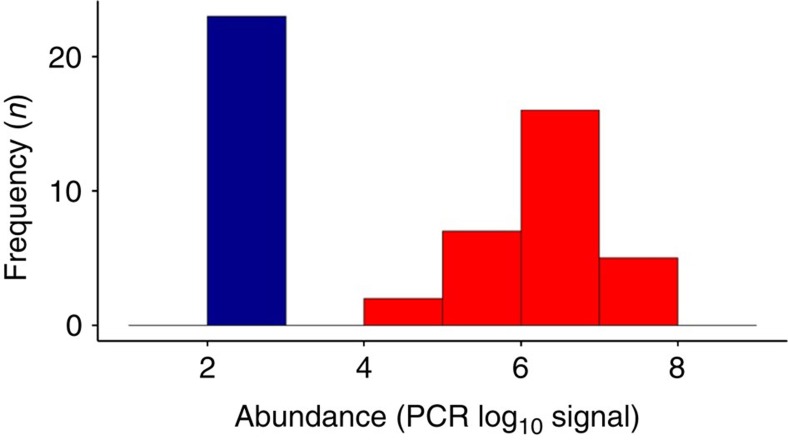
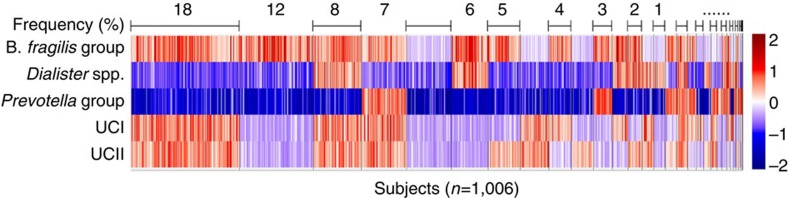
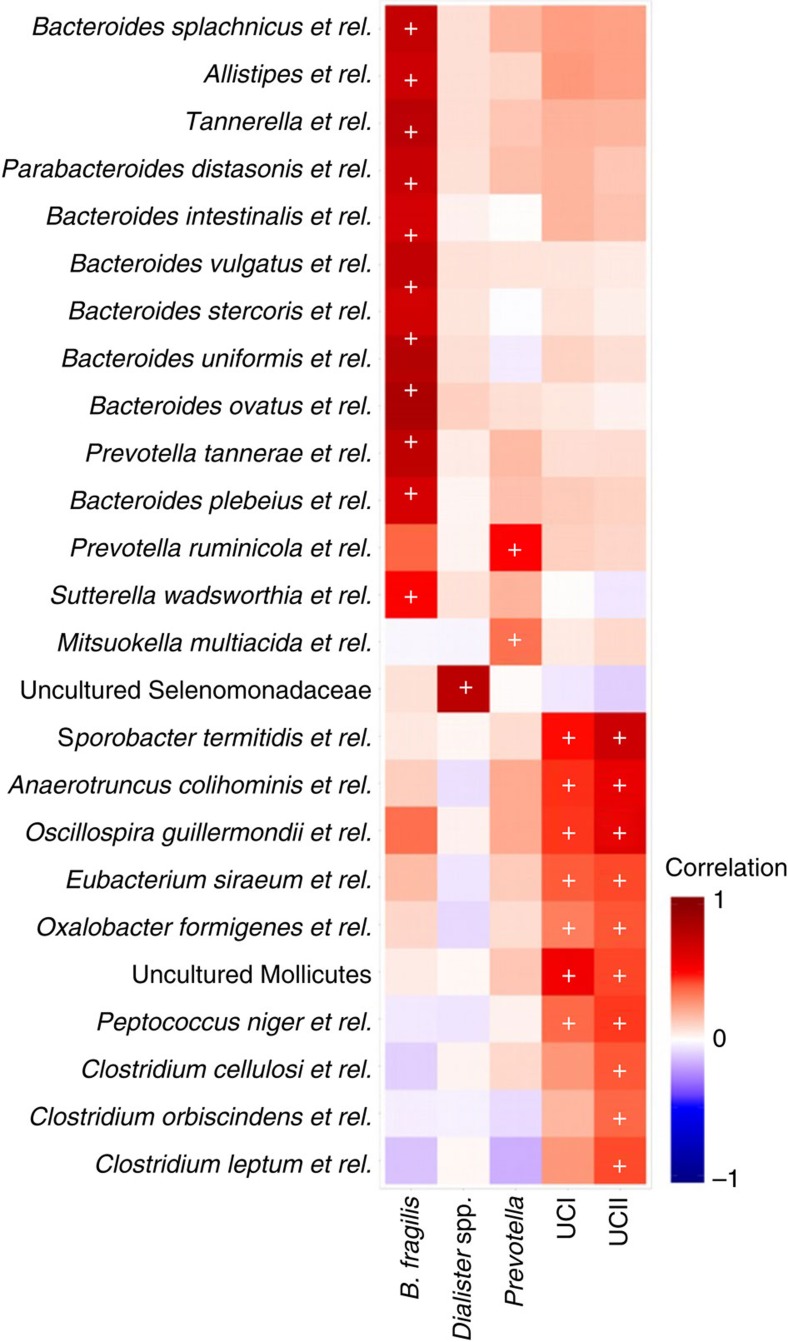
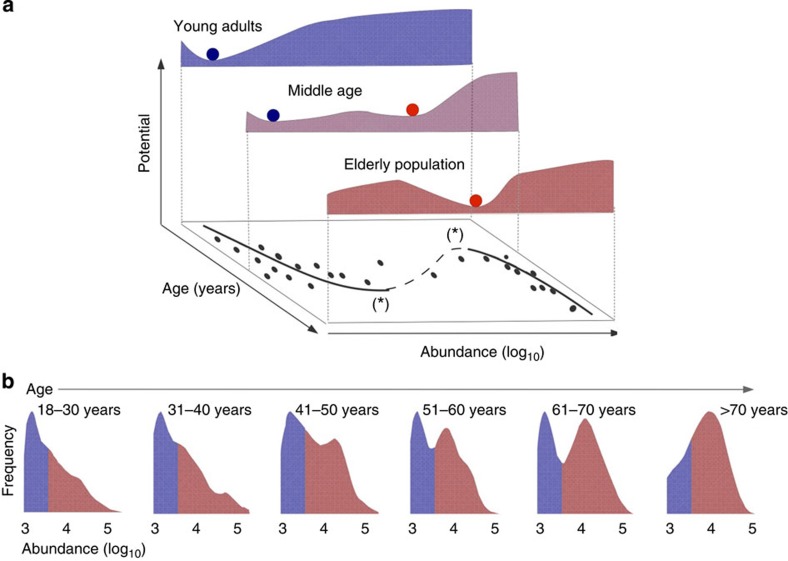
The microbial communities living in the human intestine can have profound impact on our well-being and health. However, we have limited understanding of the mechanisms that control this complex ecosystem. Here, based on a deep phylogenetic analysis of the intestinal microbiota in a thousand western adults, we identify groups of bacteria that exhibit robust bistable abundance distributions. These bacteria are either abundant or nearly absent in most individuals, and exhibit decreased temporal stability at the intermediate abundance range. The abundances of these bimodally distributed bacteria vary independently, and their abundance distributions are not affected by short-term dietary interventions. However, their contrasting alternative states are associated with host factors such as ageing and overweight. We propose that the bistable groups reflect tipping elements of the intestinal microbiota, whose critical transitions may have profound health implications and diagnostic potential.


Figures

Figure 1
Figure 1. The bimodal bacteria.
Logarithmic abundance distributions of the six bimodal phylogenetic groups that exhibit robust alternative states of low (blue) and high (red) abundance across intestinal microbiota of 1,006 western adults. The UCI and UCII refer to the uncultured Clostridiales I and II, respectively. The frequency of the observations is shown as a function of the phylogenetic microarray log10 signal.
Figure 2
Figure 2. Bacterial abundance types.
Bacterial abundance types include symmetric, skewed and bimodal logarithmic abundance distributions (Supplementary Table 1). The skewed types include prevalent left- and right-skewed types as well as rare bacteria. The bimodal types (Fig. 1) include cases with two distinct peaks, and cases with a peak at low abundance combined with a more widely varying fat tail of high-abundance subjects. The population frequencies of the log abundance across the 1,006 western adults are shown for representative examples from each category: Anaerostipes caccae et rel. (symmetric); Serratia spp. (rare); Streptococcus bovis et rel. (right skewed); Faecalibacterium prausnitzii et rel. (left skewed); P. oralis et rel. (bimodal distribution with two distinct peaks); and uncultured Clostridiales I (fat tailed, bimodal distribution with a variable high-abundance state).
Figure 3
Figure 3. Temporal variation.
Temporal variation in each bimodal group during the follow-up interval (1–9 months from the baseline for 95% of the subjects, see Methods). Each horizontal line indicates the abundance range of the indicated bacteria for a single subject. The 78 subjects (horizontal lines) are ordered based on their mean abundance. The red lines highlight subjects exhibiting a state shift (Supplementary Fig. 3) across the estimated tipping point (dashed vertical lines). The differences in the follow-up times did not significantly affect the observed fluctuations (P>0.05; Pearson correlation; Benjamini–Hochberg adjustment).
Figure 4
Figure 4. Bimodality is associated with reduced intermediate stability.
Analysis of the 60 prevalent taxa indicates a group of bistable bacteria with robust bimodal abundance distributions (>90% bootstrap support; vertical axis) and reduced intermediate stability (ρ<−0.3; horizontal axis), as also indicated by the corresponding frequency histograms (side panels). The bimodality scores are shown for the 401 samples extracted by mechanical lysis; the stability estimates are based on the 78 follow-up subjects. The black symbols indicate the bistable groups whose bimodality was supported in multiple data sets, including the Dialister spp. (square), P. melaninogenica (large diamond), P. oralis (small diamond), UCI (small circle) and UCII (large circle) groups. These show also significantly reduced intermediate stability compared with the other prevalent groups (ρ<−0.3; P<0.002; hyper-geometric test). The other bistable taxa (white circles) whose bimodality we could not verify in the other data sets include Firmicutes (Clostridium spp. (sensu stricto), relatives of C. colinum, Lactobacillus plantarum and uncultured Mollicutes). The bimodal B. fragilis group (grey upward triangle) has only moderately reduced intermediate stability (ρ=−0.19). The C. difficile group (grey downward triangle) has the third lowest intermediate stability.
Figure 5
Figure 5. Abundance distribution of Methanobrevibacter, the dominant methanogenic archaeon in the human intestine.
Quantitative PCR-based (qPCR) logarithmic abundance distribution, expressed as 16S rRNA gene copies per gram of faeces, indicates bimodality of this genus. Methanobrevibacterium spp. were detected in 47% of the 53 unique subjects from our main cohort for which the qPCR data were available. For subjects where Methanobrevibacterium spp. were not detected, the abundance is set at the detection limit of the assay. The colours indicate the two groups of subjects where the Methanobrevibacter spp. are absent or below the detection limit (blue), or detected (red).
Figure 6
Figure 6. The tipping elements co-occur in various combinations.
The bimodal groups (rows) co-occur in various combinations within the study population. Shading indicates the relative abundance (log10) for each group with respect to the identified tipping point between the alternative states of low (blue) and high (red) abundance. The 1,006 subjects are ordered based on the combination frequencies (top row). The most frequent combination (18%) corresponds to the high-abundance state of the UCI, UCII and B. fragilis groups combined with the low-abundance state of the Dialister spp. and Prevotella groups.
Figure 7
Figure 7. Covariation between the bimodal groups and other taxa.
Summary of correlations between the bimodal groups (columns) and the 124 other genus-like groups targeted by the HITChip microarray; significant correlations with 25 groups (rows; P<0.05; |r|>0.25; Pearson correlation) were consistently observed in independent sample sets analysed using two different DNA extraction methods (mechanical lysis; n=401 and enzymatic lysis-based method; n=287), and in 100 bootstrap data sets sampled from the overall data collection (n=1,006). The remaining 99 groups that did not show significant correlations have been removed for clarity. The 32 correlations that were found to be consistently significant in all tests are indicated by ‘+’. Shading indicates Pearson correlation between the taxa across the 1,006 western adults.
Figure 8
Figure 8. Changing state probabilities associated with ageing.
(a) A schematic illustration of shifting state probabilities in the UCI group associated with ageing. The UCI abundance data (bottom plane) suggest a catastrophe-fold, where the solid and dashed parts of the curve correspond to stable states and unstable equilibria, respectively. The depth and width of the potential minima indicate decreasing resilience of the system towards the bifurcation points (*) during ageing. (b) Observation density in various age groups highlights the associations between the UCI state probabilities and age (sample sizes: 220 (18–30 years); 147 (31–40 years); 192 (41–50 years); 258 (51–60 years); 114 (61–70 years); and 19 (71–77 years)). The alternative states of low (blue) and high (red) abundances are here more clearly pronounced than in the population-level histogram pooled over all age groups (Fig. 1).

References

    1. Qin J. et al.. A human gut microbial gene catalogue established by metagenomic sequencing. Nature 464, 59–65 (2010). - PMC - PubMed
    1. Zoetendal E. G., Rajilić-Stojanović M. & de Vos W. M. High-throughput diversity and functionality analysis of the gastrointestinal tract microbiota. Gut 57, 1605–1615 (2008). - PubMed
    1. de Vos W. M. & de Vos E. A. J. Role of the intestinal microbiome in health and disease: from correlation to causation. Nutr. Rev. 70, S45–S56 (2012). - PubMed
    1. Cho I. & Blaser M. J. The human microbiome: at the interface of health and disease. Nat. Rev. Genet. 13, 260–270 (2012). - PMC - PubMed
    1. Costello E. K., Stagaman K., Dethlefsen L., Bohannan B. J. M. & Relman D. A. The application of ecological theory toward an understanding of the human microbiome. Science 336, 1255–1262 (2012). - PMC - PubMed

Publication types