. 2014 Jun 15;5(11):3711-27.
doi: 10.18632/oncotarget.1987.

Melanoma cell therapy: Endothelial progenitor cells as shuttle of the MMP12 uPAR-degrading enzyme

Affiliations

Melanoma cell therapy: Endothelial progenitor cells as shuttle of the MMP12 uPAR-degrading enzyme

Anna Laurenzana et al. Oncotarget. .

Abstract

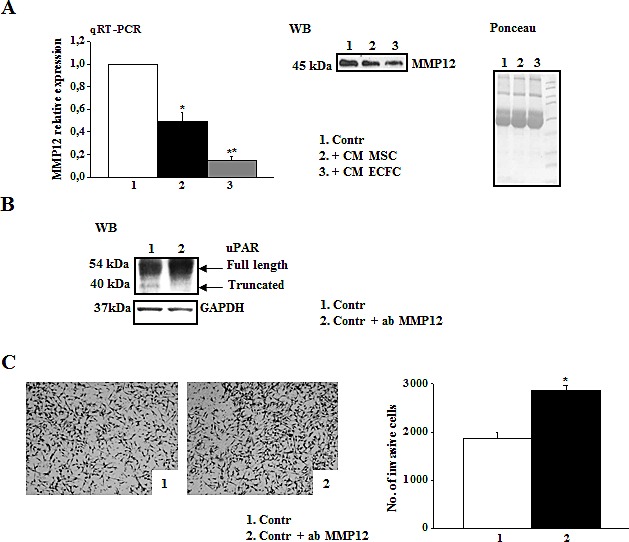
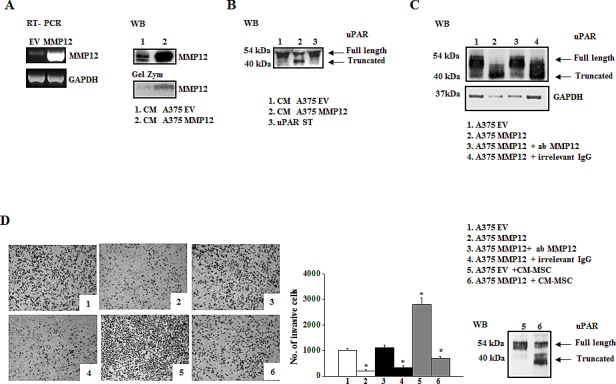
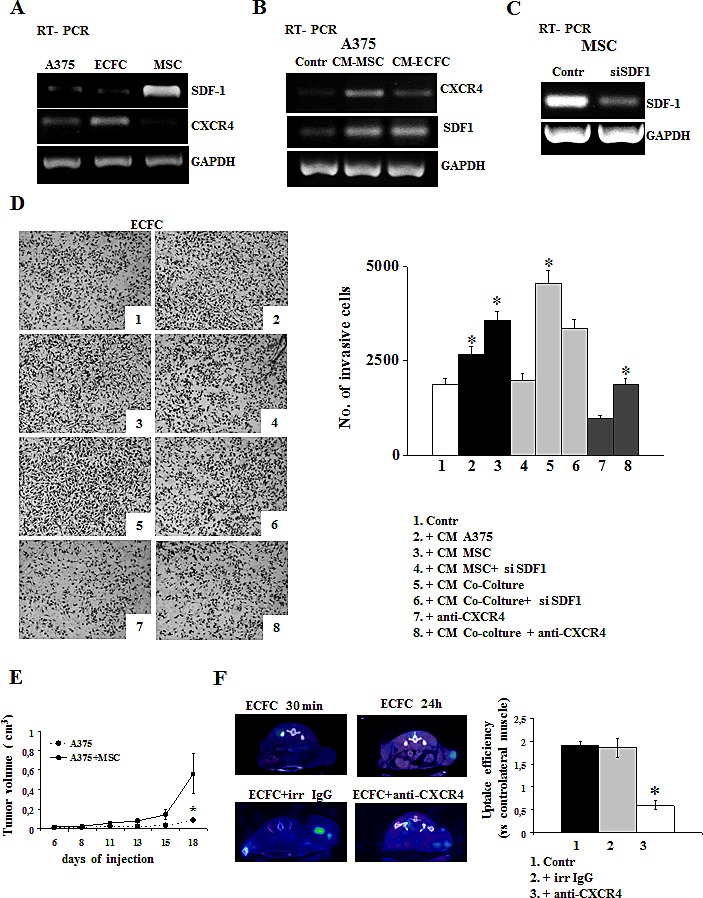
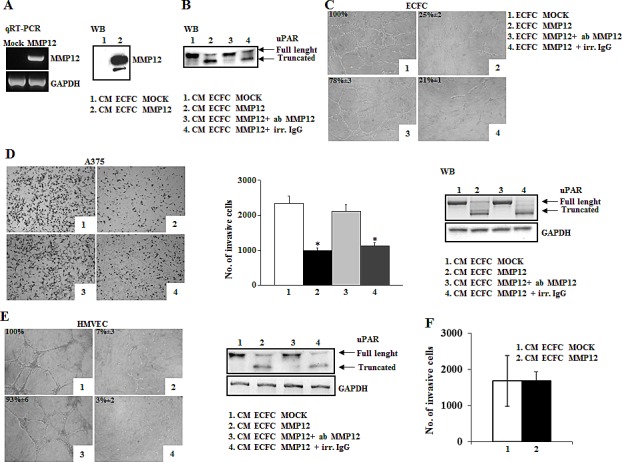
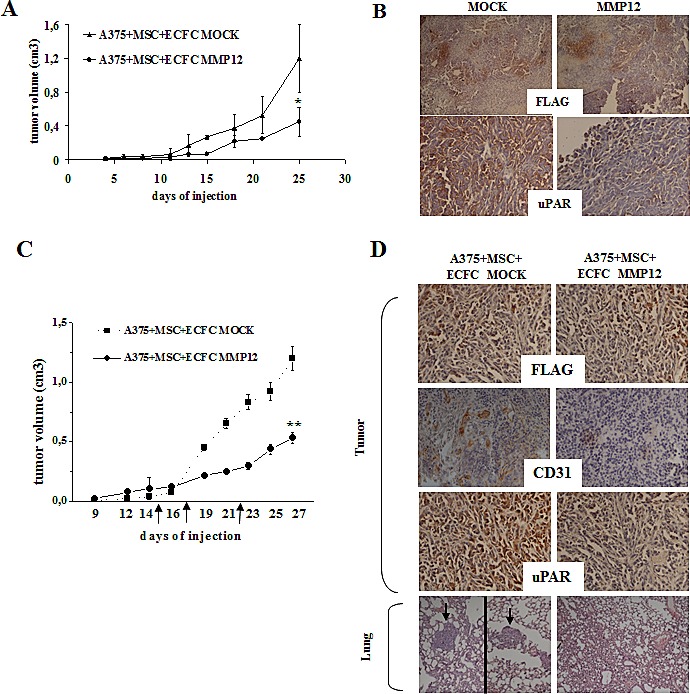
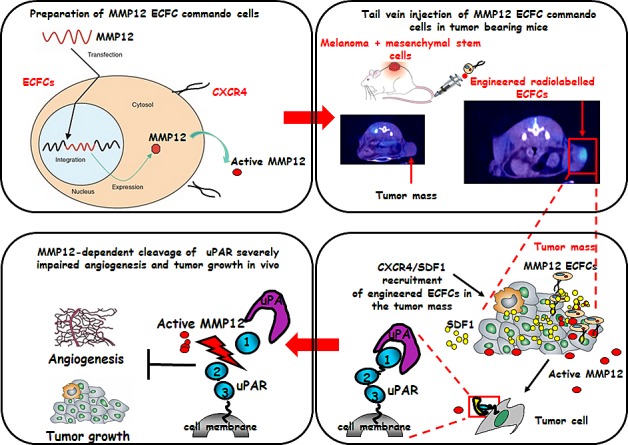
The receptor for the urokinase-type plasminogen activator (uPAR) accounts for many features of cancer progression, and is therefore considered a target for anti-tumoral therapy. Only full length uPAR mediates tumor progression. Matrix-metallo-proteinase-12 (MMP12)-dependent uPAR cleavage results into the loss of invasion properties and angiogenesis. MMP12 can be employed in the field of "targeted therapies" as a biological drug to be delivered directly in patient's tumor mass. Endothelial Progenitor Cells (EPCs) are selectively recruited within the tumor and could be used as cellular vehicles for delivering anti-cancer molecules. The aim of our study is to inhibit cancer progression by engeneering ECFCs, a subset of EPC, with a lentivirus encoding the anti-tumor uPAR-degrading enzyme MMP12. Ex vivo manipulated ECFCs lost the capacity to perform capillary morphogenesis and acquired the anti-tumor and anti-angiogenetic activity. In vivo MMP12-engineered ECFCs cleaved uPAR within the tumor mass and strongly inhibited tumor growth, tumor angiogenesis and development of lung metastasis. The possibility to exploit tumor homing and activity of autologous MMP12-engineered ECFCs represents a novel way to combat melanoma by a "personalized therapy", without rejection risk. The i.v. injection of radiolabelled MMP12-ECFCs can thus provide a new theranostic approach to control melanoma progression and metastasis.


Figures

Figure 1
Figure 1. uPAR regulates invasion of melanoma cells
Panel A: uPAR expression in A375, Mewo and M14 melanoma cells determined by qRT-PCR. Results are normalized to the expression of ribosomal 18s. Panel B: Western blotting detection of full-length and truncated form of uPAR in melanoma cells. Three experiments were performed for each cell line. GAPDH expression functions as a control for protein loading. Panel C: Matrigel invasion of A375, Mewo and M14 under control conditions. In all invasion assays cells migrating through the Matrigel on the filters of Boyden chambers were counted after 6h and expressed as the total cell number of invading cells/filter. Data presented in panel A and C result from 3 independent experiments expressed as means ± SD. * P<0.05 or ** P<0.001, with respect to A375 melanoma cells. Panel D: uPAR expression, evaluated by qRT-PCR and by Western blotting in A375 melanoma cells in control condition and after overnight incubation with conditioned medium of MSC (CM-MSC) and ECFC (CM-ECFC). Data result from three independent experiments ± SD. Asterisks indicate significant difference (** P<0.001) with respect to control. Panel E: Pictures shown here represent Matrigel-coated filters of a typical invasion experiment of A375 melanoma cells in control condition and after stimulation with CM-MSC or CM-ECFC, in the absence and in the presence of anti-uPAR antibody R3. Four experiments were performed for each experimental condition. Histogram on the right shows the quantification performed as in C. Asterisks (* P<0.05) indicate significant difference between the indicated experimental condition.
Figure 2
Figure 2. MMP-12 down-regulation correlates with high levels of full length uPAR and A375 invasiveness
Panel A: MMP12 levels of A375 were examined by qRT-PCR in control condition or after overnight treatment with CM-MSC or CM-ECFC. Results are normalized to control (assumed as value 1). Asterisks indicate significant difference (* P<0.05; ** P<0.001) from control. MMP12 released in the medium by the same cells was evaluated by Western blotting (on the right). The result is representative of three separate experiments. Ponceau on the right shows equal loading. Panel B: Western blotting analysis of uPAR expressed by A375 cells in control condition and in the presence of anti-MMP12 antibody. Result is representative of three independent experiments. Panel C: Pictures represent the Matrigel-coated filters of an invasion experiment of A375 cells in the same experimental condition described above (panel B). Histogram shows the quantitative analysis of Matrigel invasion. Asterisks indicate significant difference (* P<0.05) from control.
Figure 3
Figure 3. MMP12 inhibits uPAR-dependent invasion of A375 melanoma cells
Panel A: transient transfection of A375 cells with the recombinant vector pCDNA3.1 + MMP12 (MMP12) or empty vector pCDNA3.1 (EV) as control. RT-PCR analysis of MMP12 in transfected cells (on the left) and Western blotting analysis of MMP12 released in the medium by the same cells (on the right). The enzymatic activity of MMP12 was revealed by the zymographic assay of CM from transiently transfected cells on α-elastin gel (low on the right). Panel B: Western blotting analysis of standard uPAR (st) incubated with aliquots of the culture medium EV (CM-A375-EV) and MMP12 A375 cells (CM-A375-MMP12). Panel C: Western blotting analysis of uPAR expression in A375-EV (mainly full length uPAR) and A375-MMP12 cells (truncated uPAR) in the absence and in the presence of anti-MMP12 antibody or irrelevant IgG. All the images in panels A-C are representative of 3 different experiments that gave similar results; Panel D: Representative fields of invasive transiently transfected A375 cells (empty vector and MMP12), in the presence or absence of anti-MMP12 antibody or of an irrelevant IgG (picture 1-4). Pictures 5 and 6 show the Matrigel invasion of control A375 cells and of MMP12 transfected cells incubated with CM-MSC. The bar chart represents the relative quantification of Matrigel invasion performed by counting migrated cells as described in Figures 1A. Results show data from three independent experiments performed in triplicate. Asterisks indicate significant difference from control (A375-EV) (* P<0.05;). Full length and truncated form of uPAR in lysates of A375 cells in the conditions shown in pictures 5 and 6 of panel D, was evaluated by Western blotting using R4 anti-uPAR antibody.
Figure 4
Figure 4. The Stromal cell-derived factor-1/CXCR4 system promotes ECFC recruitment in in vitro and in vivo
Expression of CXCR4/SDF1 system in A375, MSC and ECFC cells evaluated by RT-PCR analysis in basal conditions (panel A), in A375 cells incubated with CM-MSC and with CM-ECFC (panel B). Panel C: SDF-1 expression after the knockdown of SDF-1 gene in MSC. Panel D: ECFC Matrigel invasion by adding in the lower compartment of Boyden chamber of: control media (picture 1); conditioned media from A375 (picture 2); CM-MSC (picture 3), and CM from cocolture A375/MSC (picture 5). Picture 4 and 6 show ECFC invasion upon addition in the lower compartment of CM from SDF1-silenced MSC or from A375/MSC SDF1-silenced cocolture, respectively; picture 7 and 8 show the invasion of ECFC in the presence of anti-CXCR4 antibody, in control condition (picure 7) and after CM-co-colture incubation (picture 8). Histogram on the right represent the quantification of Matrigel invasion performed by counting migrated cells as described in Figures 1A. Asterisks (* P<0.05) indicate significant difference between the indicated experimental condition. Panel E: in vivo experiments. A375 melanoma cells were injected alone (control) or together with MSC in CD1-nude mice and the development of tumor was followed by measuring the tumor volume. Five mice were used for each experimental condition and the results are the mean of 3 different experiments performed in triplicate. Asterisks indicate significant difference (* P < 0.05) from control. Panel F: In vivo recruitment of ECFCs into tumor mass. CD1-nude mice were grafted subcutaneously with viable melanoma cells together with MSC and then ECFCs, radiolabelled with 111In 8-oxyquinoline (oxine), were injected intravenously when the tumor reached about 150 mm3 volume, in the absence or in the presence of anti-CXCR4 or irrelevant antibody. 24 hours after radiolabelled ECFCs administration, SPECT tomography was performed as described in material and method. SPECT images show a selective visualization of radioactive ECFCs in the tumor mass. Figure shows a representative experiment (n=3). On the left: SPECT images of ECFC engraftment in the tumor mass at 30 min and 24 h (upper panel) and ECFC engraftment in the presence of irrelevant IgG or anti-CXCR4 antibody (lower panel). On the right: relative histogram of uptake efficiency.
Figure 5
Figure 5. The anti-tumoral efficacy of MMP12-engineered ECFC in vitro and in vivo
Panel A: Characterization of MMP12-engineered ECFC. RT-PCR shows MMP12 expression of engineered ECFC and Western blotting analysis detects MMP12 released in conditioned medium of ECFC containing empty vector (CM-ECFC MOCK, lane 1) or containing lentiviral vector encoding MMP12 molecule (CM-ECFC MMP12, lane 2). Panel B: Western blotting analysis of standard uPAR (st) incubated with aliquots of CM-ECFC MOCK (lane 1) and of CM-ECFC MMP12 (lane 2) in the presence of anti-MMP12 antibody (lane 3) or an irrelevant IgG (lane 4). Panel C: Capillary morphogenesis at 6h of ECFC-MOCK (picture1) and ECFC-MMP12 (Figure 2), in the presence of anti-MMP12 antibody (picture 3) or irrelevant IgG (picture 4). Numbers: percent field occupancy, taking control as 100%. Data are from 3 experiments performed in triplicate. Panel D: Anti-tumor property of ECFC-MMP12. Matrigel invasion of A375 cells in control conditions (picture 1) and upon addition, in the lower well of the migration chamber, of CM ECFC-MMP12 (picture 2), in the presence of anti-MMP12 antibody (picture 3) or irrelevant IgG (picture 4). The histogram represents the quantification of Matrigel invasion experiments, evaluated as in Fig.1A. Asterisks (*: P<0.05) indicate significant difference between the indicated experimental condition. Full length and truncated form of uPAR in lysates of A375 melanoma cells, shown on the right, was evaluated by Western blotting in the same conditions described above. Data result from three independent experiments. Panel E: Anti-angiogenic property of ECFC-MMP12. Capillary morphogenesis of endothelial cells treated with CM-ECFC MOCK (picture 1) or CM-ECFC MMP12 (picture 2) in the presence of anti-MMP12 antibody (picture 3) or irrelevant IgG (picture 4). Numbers: percent field occupancy, taking control as 100%. The pictures are representative of 3 different experiments performed in triplicate that gave similar results. Full length and truncated form of uPAR in lysates of endothelial cells, shown on the right, was evaluated by Western blotting in the same conditions described above. Panel F: Histogram represents number of A375 cells allowed to invade across the Matrigel pre-incubated overnight with CM ECFC MOCK and CM ECFC MMP12.
Figure 6
Figure 6. The in vivo effect of MMP12-engineered ECFC on tumor growth and metastasis
Panel A. Melanoma tumors were obtained by subcutaneous injection of 1×10⁶ viable A375 cells together with 0.5× 10⁶ MSCs in the flanks of 6-week-old nude nu/nu (CD-1) and, when tumor mass was evident, mice were treated by i.v. injection with ECFC-MOCK or ECFC-MMP12, as described in materials and methods. The days of injection are depicted on the chart using big arrows. Effect of ECFC-MMP12 on in vivo tumor growth. Mixture of A375 melanoma cells and MSC were co-injected together with ECFC-MOCK or ECFC-MMP12 in nude mice. Tumor development was monitored for 25 days, by measuring tumor diameter, and then mice were sacrificed. Asterisks indicate significant difference (*: P < 0.05) from control. Panel B: uPAR and Flag levels assessed by immunohistochemistry in tumor tissue from mice treated as indicated in A and collected at the end of the experiment, as described in results section. These results are representative of 3 different experiments performed in triplicate that gave similar results (magnification: × 100 in the upper panels and × 400 in the lower panels). Panel C: Tumor growth curve was obtained by measuring tumor diameters at regular intervals. Eight mice were used for each experimental condition Statistical analysis was carried out by Student's t-test and significant differences between the two groups were indicated by the asterisks (**: P < 0.001 from control ECFC-MOCK). Panel D: Histological analysis of the tumors and lungs recovered at autopsy as described in the text. Tumor slides were performed according to standard procedures and incubated with a primary antibody against CD31, uPAR and FLAG (see Materials and Methods) followed by a peroxidase-conjugated IgG preparation; 3,39-diaminobenzidine was used as the chromogen for development. Slides werecounterstained with aqueous Meyer hematoxylin, mounted with glycerol for visual inspection and esamined under bright field microscope. Lungs were stained with hematoxylin–eosin. Metastases (depicted using big arrows) in the image of mouse injected with ECFC MOCK come from two different slides of the same lung. Pictures are representative of four randomly chosen microscopic fields (magnification: × 400).
Figure 7
Figure 7. Schematic representation of the concept of ECFCs as cellular vehicles delivering anti-tumor uPAR degrading enzyme
ECFCs derived from cord blood, were transduced with lentiviral vectors encoding the matrix metalloproteinase 12 (MMP12). Subcutaneous tumors were developed by direct co-injection of A375 and MSCs. Six days after tumor cells implantation, genetically modified ECFCs labelled with 60 μCi of 111In 8-oxyquinoline (oxine) were injected intravenously into CD-1 nude (nu/nu). 24 hours later the scintigraphic imagine showed that radiolabeled ECFCs were localized only in the tumor mass. High expression of SDF1 by tumour cells and MSCs form a local gradient of the chemokine in the tumour region. CXCR4-expressing ECFCs are thus recruited to the tumour, where they release active MMP12 enzyme which cleaves uPAR impairing angiogenesis and tumor growth.

Similar articles

Cited by

References

    1. Andreasen PA, Egelund R, Petersen HH. The plasminogen activation system in tumor growth, invasion, and metastasis. Cell Mol Life Sci. 2000;57:25–40. - PMC - PubMed
    1. Danø K, Behrendt N, Høyer-Hansen G, Johnsen M, Lund LR, Ploug M, Rømer J. Plasminogen activation and cancer. Thromb Haemost. 2005;93:676–681. - PubMed
    1. Dass K, Ahmad A, Azmi AS, Sarkar SH, Sarkar FH. Evolving role of uPA/uPAR system in human cancers. Cancer Treat Rev. 2008;34:122–136. - PubMed
    1. Asuthkar S, Gondi CS, Nalla AK, Velpula KK, Gorantla B, Rao JS. Urokinase-type plasminogen activator receptor (uPAR)-mediated regulation of WNT/β-catenin signaling is enhanced in irradiated medulloblastoma cells. J Biol Chem. 2012;287:20576–20589. - PMC - PubMed
    1. Mazar AP, Ahn RW, O'Halloran TV. Development of novel therapeutics targeting the urokinase plasminogen activator receptor (uPAR) and their translation toward the clinic. Current pharmaceutical design. 2011;17:1970–1978. - PMC - PubMed

Publication types

MeSH terms

Substances