. 2014 Jul 8;9(7):e101683.
doi: 10.1371/journal.pone.0101683. eCollection 2014.

High-throughput targeted repeat element bisulfite sequencing (HT-TREBS): genome-wide DNA methylation analysis of IAP LTR retrotransposon

Affiliations

High-throughput targeted repeat element bisulfite sequencing (HT-TREBS): genome-wide DNA methylation analysis of IAP LTR retrotransposon

Muhammad B Ekram et al. PLoS One. .

Abstract

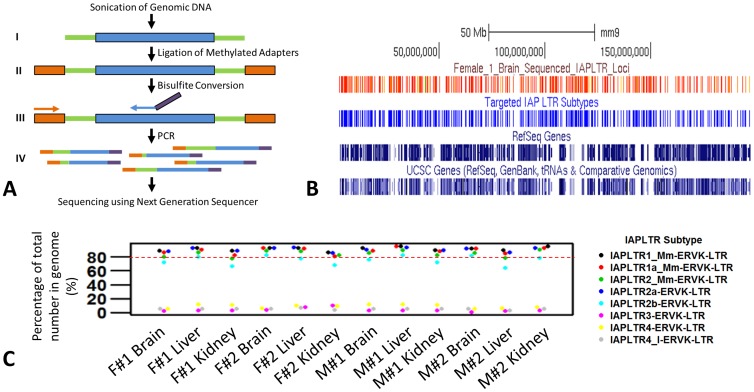
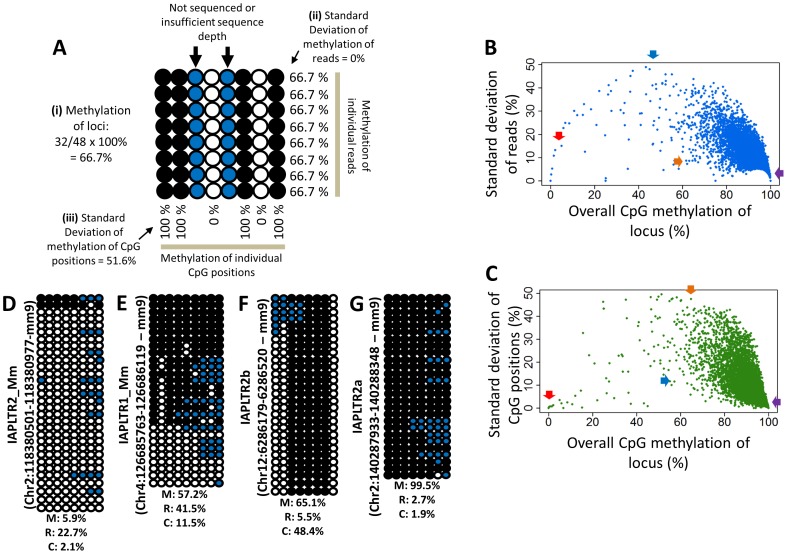
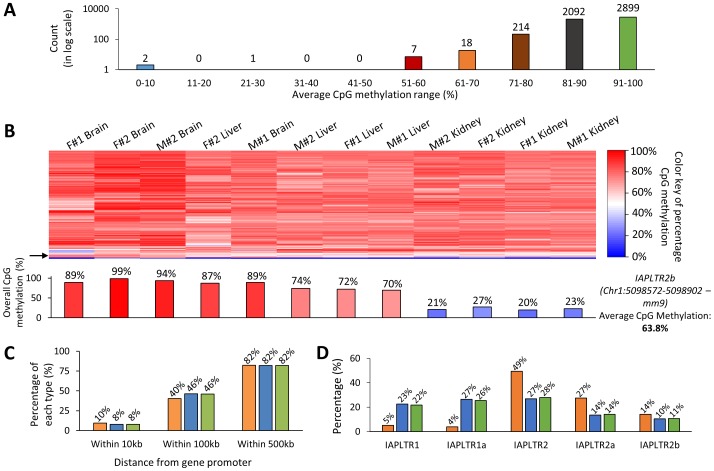
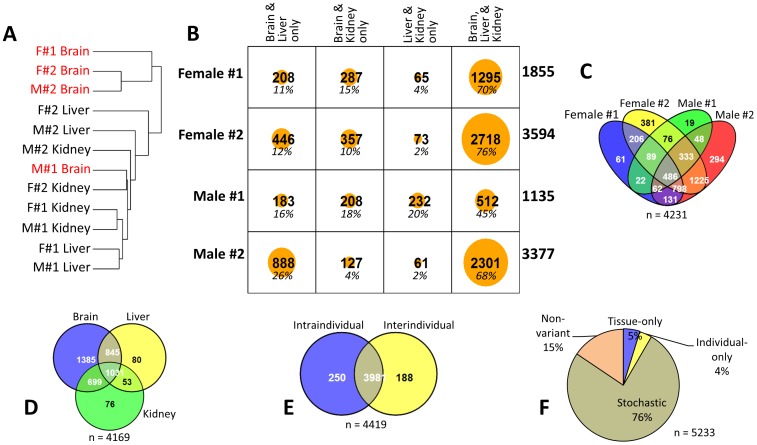
In vertebrates, DNA methylation-mediated repression of retrotransposons is essential for the maintenance of genomic integrity. In the current study, we developed a technique termed HT-TREBS (High-Throughput Targeted Repeat Element Bisulfite Sequencing). This technique is designed to measure the DNA methylation levels of individual loci of any repeat families with next-generation sequencing approaches. To test the feasibility of HT-TREBS, we analyzed the DNA methylation levels of the IAP LTR family using a set of 12 different genomic DNA isolated from the brain, liver and kidney of 4 one-week-old littermates of the mouse strain C57BL/6N. This technique has successfully generated the CpG methylation data of 5,233 loci common in all the samples, representing more than 80% of the individual loci of the five targeted subtypes of the IAP LTR family. According to the results, approximately 5% of the IAP LTR loci have less than 80% CpG methylation levels with no genomic position preference. Further analyses of the IAP LTR loci also revealed the presence of extensive DNA methylation variations between different tissues and individuals. Overall, these data demonstrate the efficiency and robustness of the new technique, HT-TREBS, and also provide new insights regarding the genome-wide DNA methylation patterns of the IAP LTR repeat elements.


Conflict of interest statement

Competing Interests: The authors have declared that no competing interests exist.

Figures

Figure 1
Figure 1. Scheme and efficiency of the High-Throughput Repeat Element Bisulfite Sequencing (HT-TREBS) technique using mouse IAP LTR elements.
(A) Schematic of the HT-TREBS depicting the steps involved up to the run in a next-generation sequencer. The blue bars and the green bars in steps I-IV represent the IAP LTR sequences and the adjoining unique sequences respectively. The orange bars in steps II–IV represent the methylated Ion Torrent ‘A’ adaptor. The orange arrow in step III depicts the forward primer corresponding to the ‘A’ adaptor region while the blue arrow depicts the reverse primer corresponding to the chosen IAP LTR site. The reverse primer also has the Ion Torrent ‘P1’ adaptor sequence attached to it as depicted by the purple bar. Step IV shows that the PCR products generated from a single specific IAP LTR locus might have varying lengths because of the random lengths of the unique sequences (green bars) caused by sonication. (B) Efficiency of the HT-TREBS. The distribution of the sequenced IAP LTR loci (depicted in red) in chromosome 1 (mm9) of the Female #1 brain sample. The IAP LTR elements have been sequenced without any chromosome region bias. A comparison with the positions of the five targeted subtypes (depicted in blue) shows that the majority of the targeted loci have been sequenced. (C) Specificity of the HT-TREBS. Graph showing the percentage of the total number of different IAP LTR subtypes that have been sequenced in the all twelve samples. The dashed red line shows the level of 80%. The percentages of the total number of the five targeted IAP LTR subtypes (IAPLTR1, IAPLTR1a, IAPLTR2, IAPLTR2a, and IAPLTR2b) that have been sequenced are more than 80% in majority of the cases. The three non-targeted IAP LTR subtypes (IAPLTR3, IAPLTR4, and IAPLTR4_I), even though sequenced, were actually represented by a much smaller fraction of their total number in the genome (less than 12% in all the cases).
Figure 2
Figure 2. Depiction of the canonical methylation pattern of the IAP LTRs by ‘sprinkler plot’.
(A) A hypothetical IAP LTR locus showing the calculation of the i) the overall CpG methylation of the locus, ii) the standard deviation of methylation of individual reads, and iii) the standard deviation of methylation of individual CpG positions. The methylation values of any CpG sites in the flanking sequences (not shown here) have not been considered. The bubble chart depicts the methylation states of each CpG position. Each row represents a different read and each column represents a different CpG position. Filled and open circles indicate methylated and unmethylated cytosines, respectively, whereas the blue circles indicate CpG positions which did not have any or sufficient sequence information. The CpG positions are arranged in the 5′ to 3′ direction of the sequenced region while going from left to right in each read. (B) The ‘sprinkler plot’ for the Female #1 brain sample showing the relation of the overall CpG methylation percentage of each sequenced IAP LTR locus to the standard deviation of CpG methylation percentage of individual reads of that locus. Likewise, in (C) the relations of the overall CpG methylation percentages of the loci to their respective standard deviations of CpG methylation percentage of individual CpG positions (only the ones sequenced) is shown. In both the sprinkler plots, each dot represents a single IAP LTR locus. Four representative patterns of CpG methylations of the loci have been shown in bubble charts by taking sequencing data from the mentioned sample: (D) near-unmethylation, (E) read-driven hypomethylation, (F) CpG position-driven hypomethylation, and (G) near-methylation. The percentages at the bottom of each bubble chart shows their respective overall CpG methylation percentage (M), standard deviation of CpG methylation percentage of individual reads (R), and standard deviation of CpG methylation percentage of individual CpG positions (C). The approximate positions of these representative loci have been indicated in (A) and (B) by the red, blue, orange, and purple arrows for (D), (E), (F), and (G), respectively.
Figure 3
Figure 3. Analyses of the hypomethylated IAP LTRs.
(A) A breakdown of the IAP LTRs in the 5,233 representative set based on their average CpG methylation percentage in the twelve samples. The numbers on top of each bar indicates the count of loci in that category. Approximately 5% of the IAP LTR loci (242 loci) have less than 80% CpG methylation levels (hypomethylated). (B) Heatmap showing the difference in CpG methylation of the hypomethylated IAP LTR loci (less than 80% CpG methylation levels) among the 12 sequenced samples. The color key on the right depicts the colors representing each value of CpG methylation (blue: 0%, white: 50%, and red: 100%). The tissues in the heatmap have been ordered/clustered based on the differences in CpG methylation of the IAP LTR loci among the tissues (dendrogram not shown). The variation in the CpG methylation among the samples for one particular locus (IAPLTR2b at the position chr1: 5098572–5098902, mm9) is represented by the bar graph below the heatmap. The approximate position of this locus on the heatmap is shown by the black arrow on the left. The bar graph shows the CpG methylation for that locus varies from 20% to 99% among the samples even though the average CpG methylation of that locus is 63.8%. (C) The percentage of the hypomethylated (<80%) and mostly methylated (>80%) loci that are within 10, 100, and 500 kb of the promoters of known genes. The orange, blue, and green bars indicate hypomethylated, mostly methylated, and the combined loci (5,233 representative set), respectively. (D) Percentage representation of the different subtypes of IAP LTR among the hypomethylated, mostly methylated, and combined categories. Once again the colored bars represent the three categories as mentioned earlier.
Figure 4
Figure 4. DNA methylation variations of the IAP LTR retrotransposons.
(A) Dendrogram showing the clustering of the 12 sequenced samples based on the differences in CpG methylation of the IAP LTR loci. The brain samples tend to show much different CpG methylation than the other samples. (B) Intra-individual variation (between tissues of the same individual) of CpG methylation. Matrix showing the numbers of IAP LTR loci that have been found to be statistically significantly different (Kruskal-Wallis test; p<0.001) in their CpG methylation percentages between brain, liver, and kidney in different combinations in the four individuals (Female#1-2, Male#1-2) that have been sequenced. The numbers on the far right of each row indicate the total number of IAP LTR loci that have been found to be varying in that particular individual while the percentages in italics in each cell indicate the number of loci in the respective cells as percentage to the total number of loci for that individual. (C) Four-way Venn diagram showing the number of overlapping and non-overlapping IAP LTR loci of the four individuals that have been found to be varying intra-individually. (D) Inter-individual variation (between individuals in the same tissue) of CpG methylation. Three-way Venn diagram showing the number of overlapping and non-overlapping IAP LTR loci of the three tissues that have been found to be varying inter-individually (Kruskal-Wallis test; p<0.001). Once again brain samples show more difference in their CpG methylation than the other tissues, since the brain has much higher number of IAP LTR whose CpG methylation varies exclusively in that tissue among the individuals. (E) Intersection between IAP LTR loci varying intra-individually and those varying inter-individually. (F) Number of loci of the four categories of CpG methylation variation as a percentage of the total number of loci in the representative IAP LTR set.

Similar articles

Cited by

References

    1. Schmid CW, Deininger PL (1975) Sequence organization of the human genome. Cell 6: 345–358. - PubMed
    1. Batzer MA, Deininger PL (2002) Alu repeats and human genomic diversity. Nature Rev Genet 3: 370–379. - PubMed
    1. Lander ES, Linton LM, Birren B, Nusbaum C, Zody MC, et al. (2001) Initial sequencing and analysis of the human genome. Nature 409: 860–921. - PubMed
    1. Martens JH, O'Sullivan RJ, Braunschweig U, Opravil S, Radolf M, et al. (2005) The profile of repeat-associated histone lysine methylation states in the mouse epigenome. EMBO J 24: 800–812. - PMC - PubMed
    1. Mikkelsen TS, Ku M, Jaffe DB, Issac B, Lieberman E, et al. (2007) Genome-wide maps of chromatin state in pluripotent and lineage-committed cells. Nature 448: 553–560. - PMC - PubMed

Publication types