

Ictal propagation of high frequency activity is recapitulated in interictal recordings: effective connectivity of epileptogenic networks recorded with intracranial EEG
- PMID: 25003814
- PMCID: PMC4165796
- DOI: 10.1016/j.neuroimage.2014.06.078
Ictal propagation of high frequency activity is recapitulated in interictal recordings: effective connectivity of epileptogenic networks recorded with intracranial EEG
Abstract
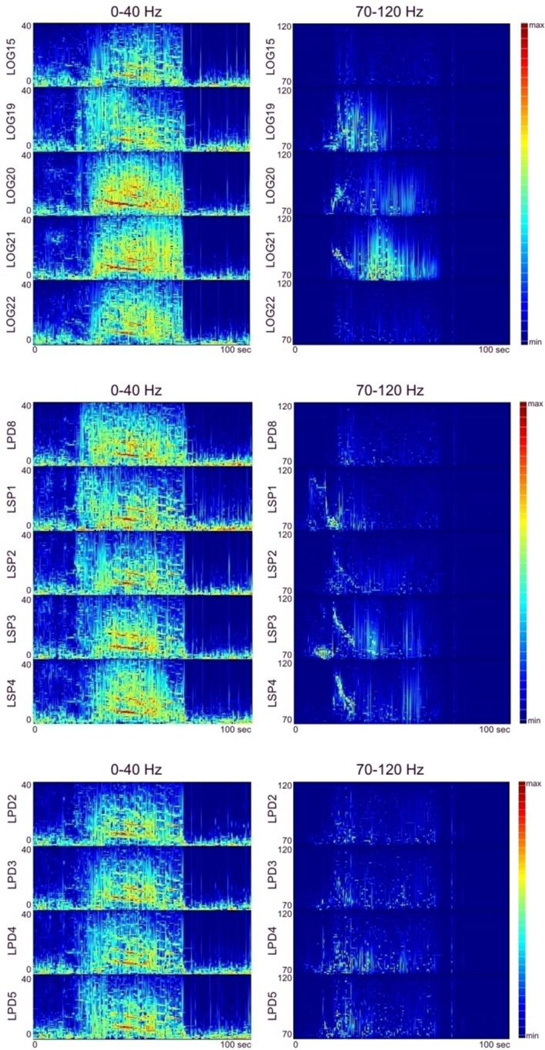
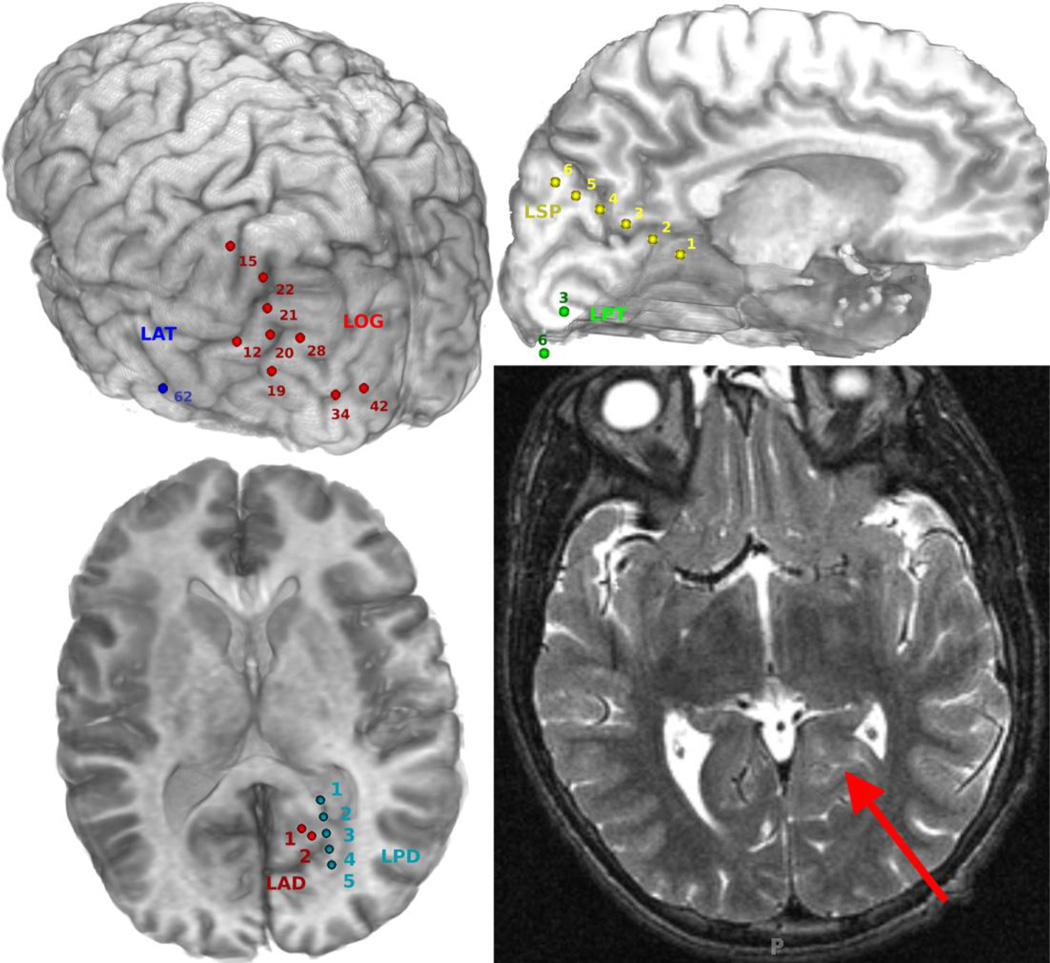
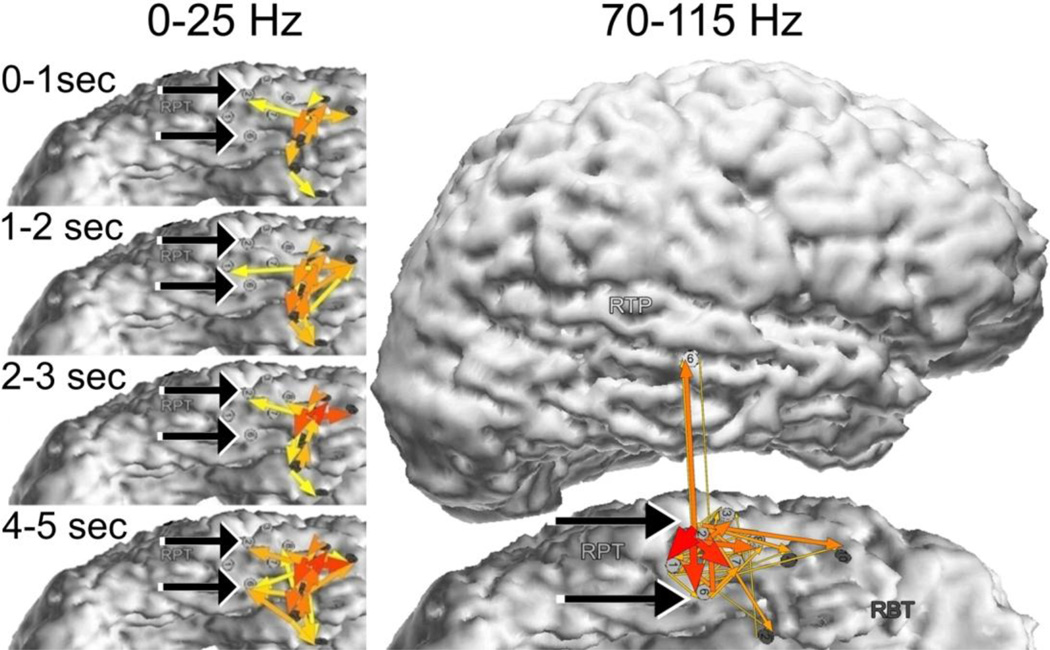
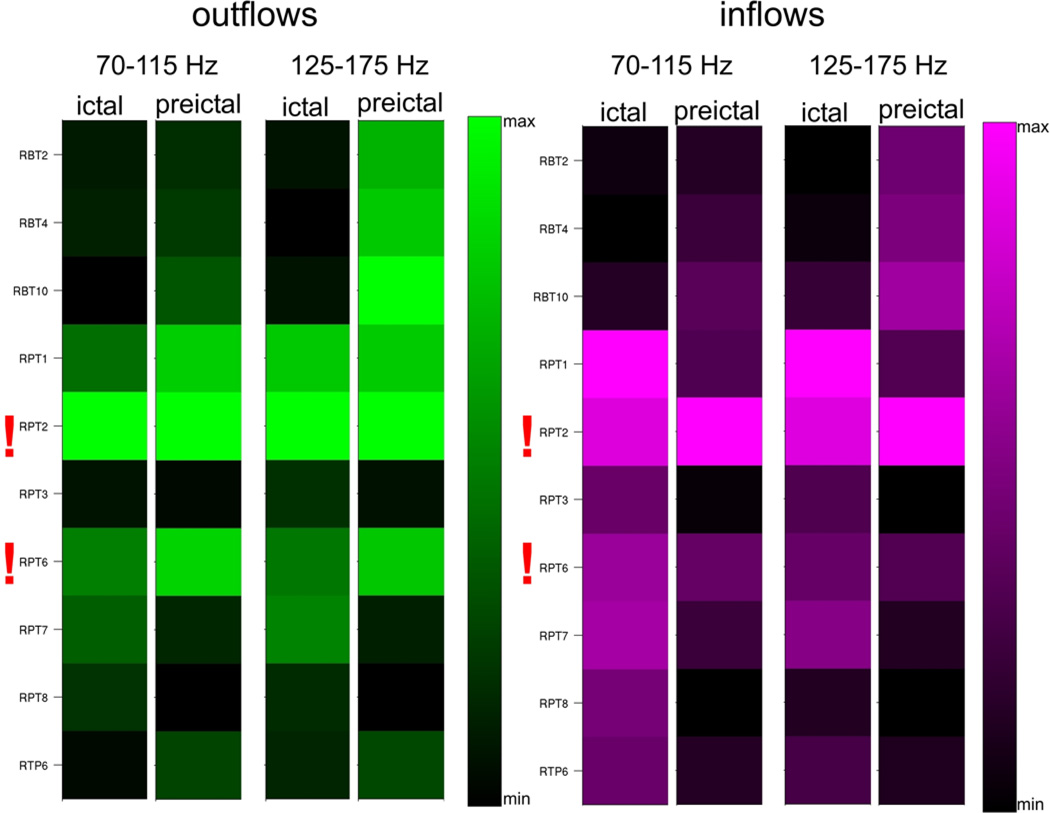
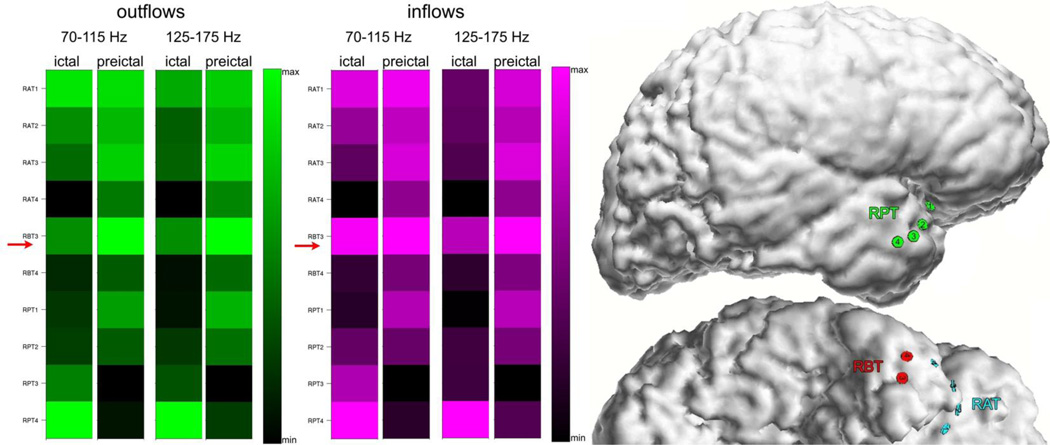
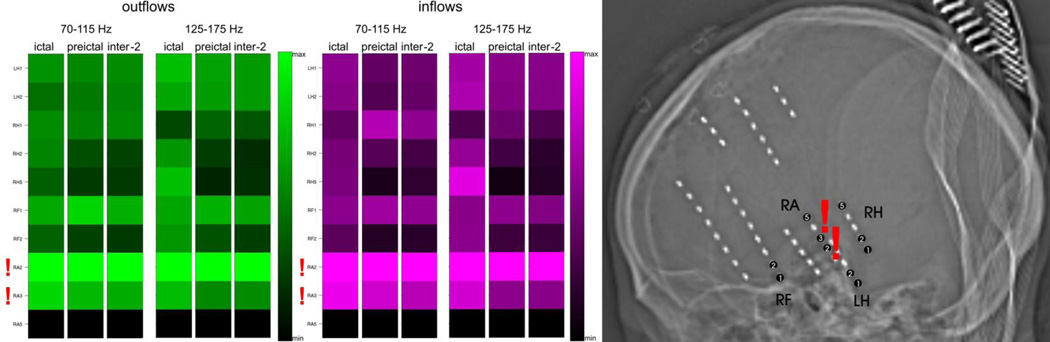
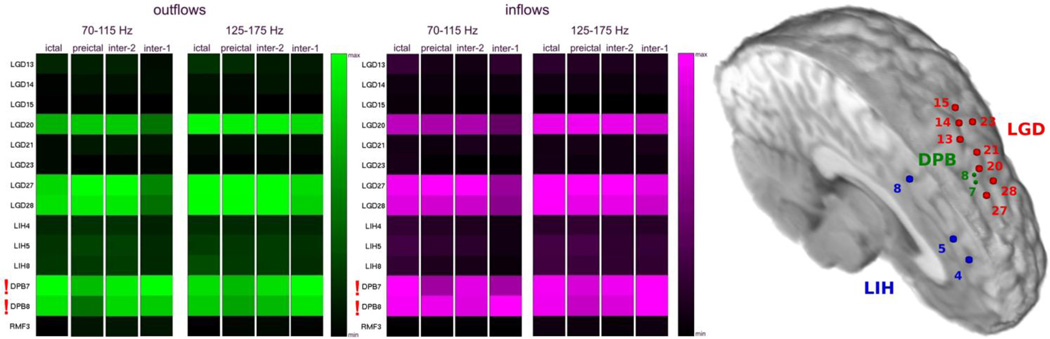
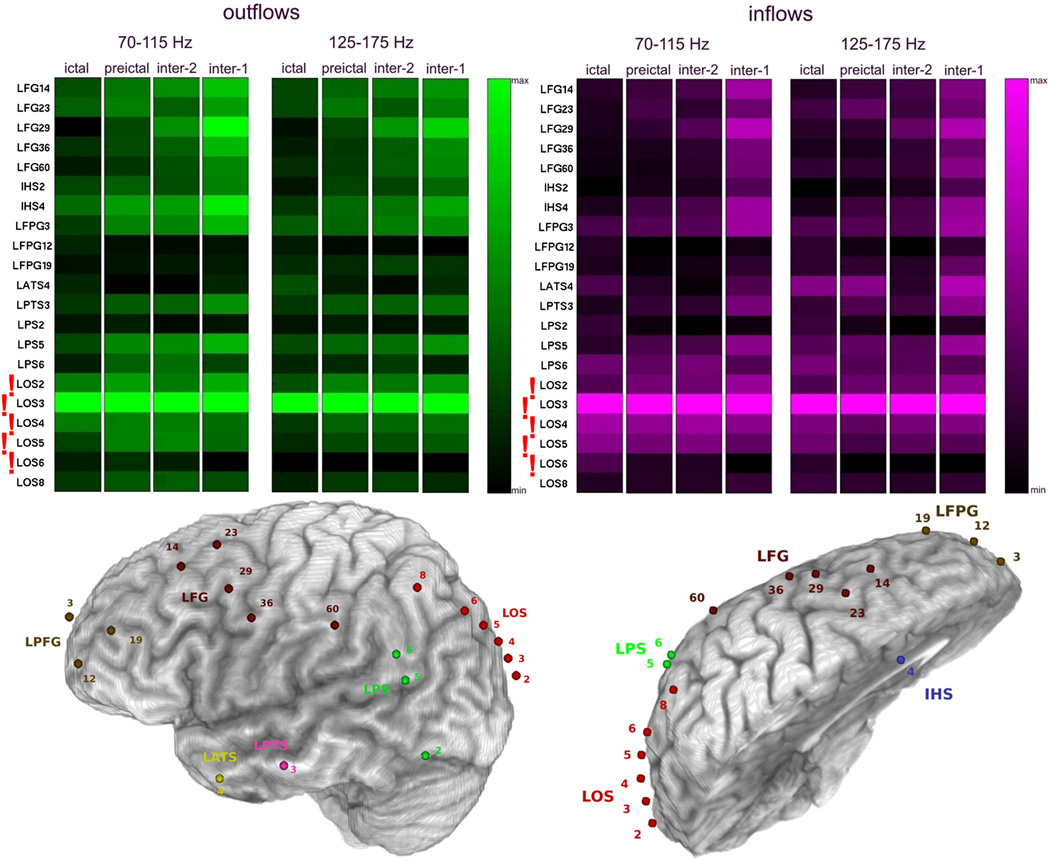
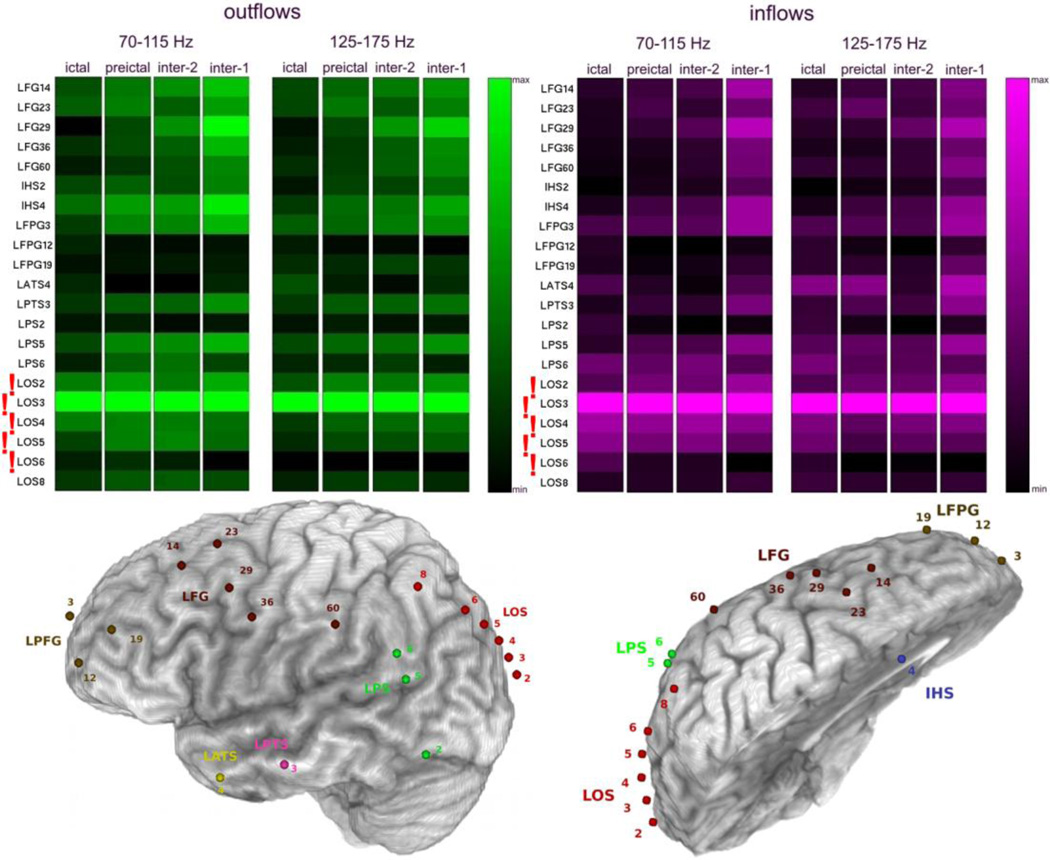
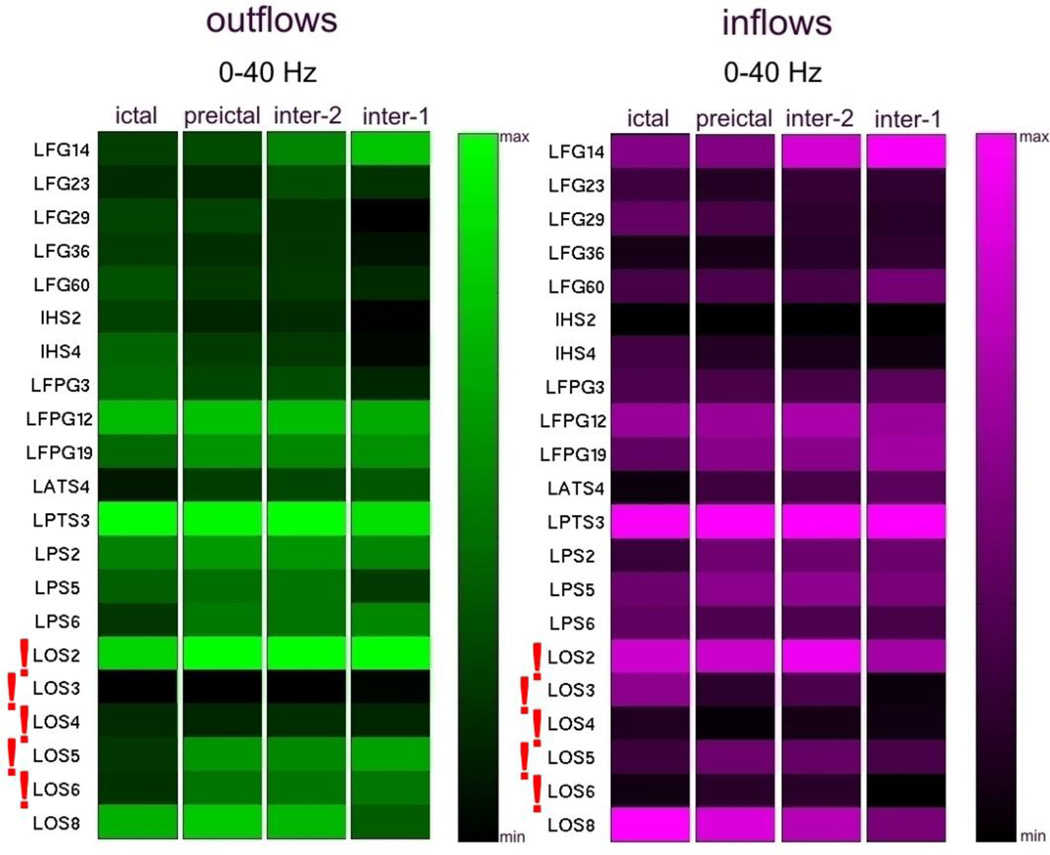
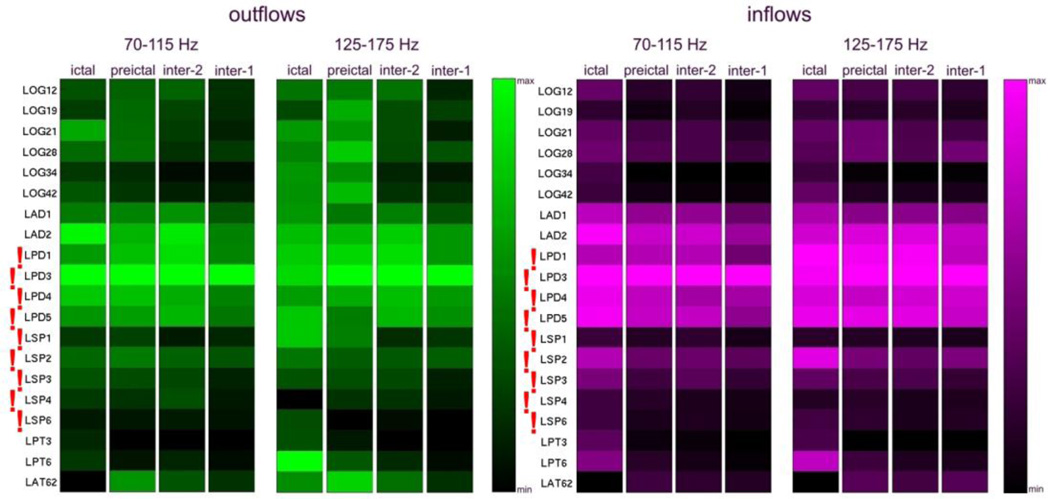
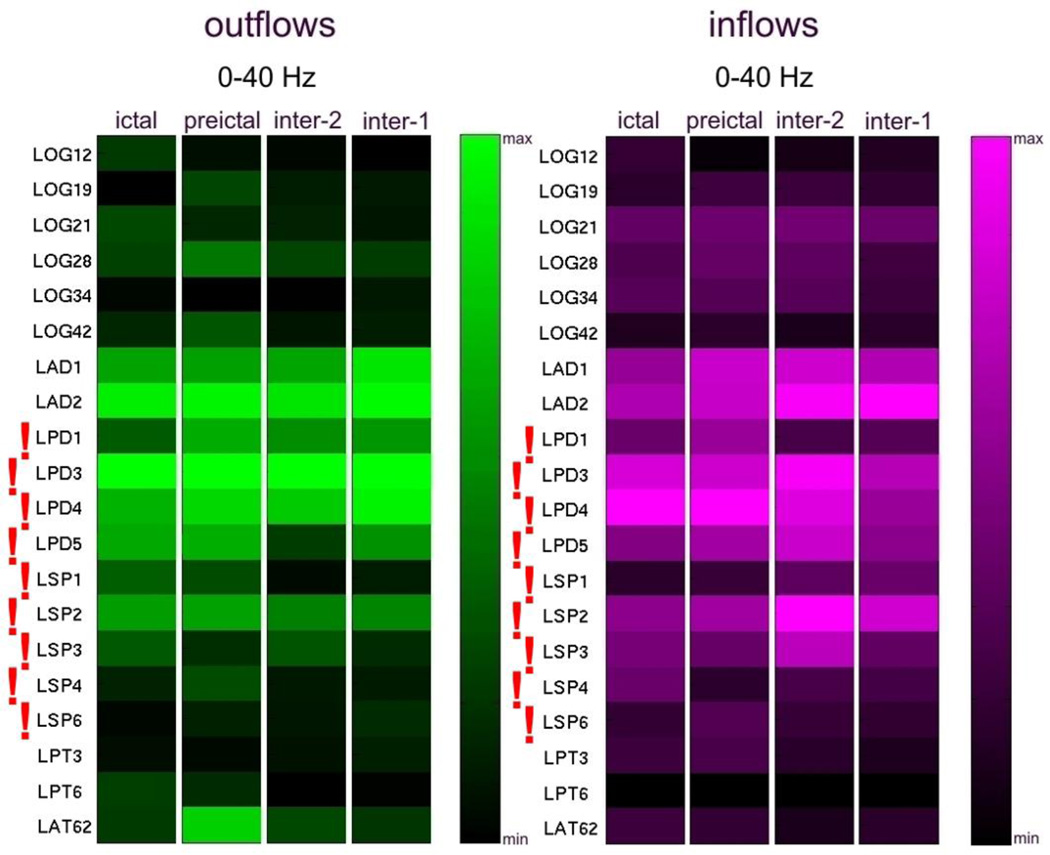
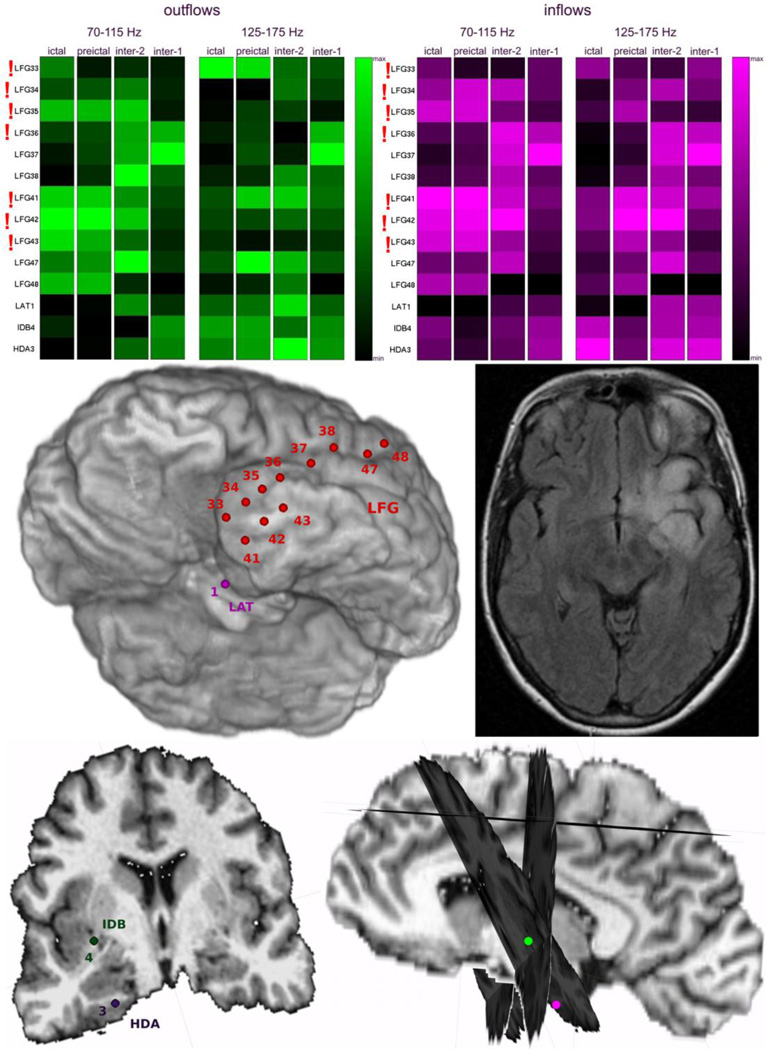
Seizures are increasingly understood to arise from epileptogenic networks across which ictal activity is propagated and sustained. In patients undergoing invasive monitoring for epilepsy surgery, high frequency oscillations have been observed within the seizure onset zone during both ictal and interictal intervals. We hypothesized that the patterns by which high frequency activity is propagated would help elucidate epileptogenic networks and thereby identify network nodes relevant for surgical planning. Intracranial EEG recordings were analyzed with a multivariate autoregressive modeling technique (short-time direct directed transfer function--SdDTF), based on the concept of Granger causality, to estimate the directionality and intensity of propagation of high frequency activity (70-175 Hz) during ictal and interictal recordings. These analyses revealed prominent divergence and convergence of high frequency activity propagation at sites identified by epileptologists as part of the ictal onset zone. In contrast, relatively little propagation of this activity was observed among the other analyzed sites. This pattern was observed in both subdural and depth electrode recordings of patients with focal ictal onset, but not in patients with a widely distributed ictal onset. In patients with focal ictal onsets, the patterns of propagation recorded during pre-ictal (up to 5 min immediately preceding ictal onset) and interictal (more than 24h before and after seizures) intervals were very similar to those recorded during seizures. The ability to characterize epileptogenic networks from interictal recordings could have important clinical implications for epilepsy surgery planning by reducing the need for prolonged invasive monitoring to record spontaneous seizures.
Keywords: Brain mapping; ECoG; Epilepsy surgery; Epileptic network; High frequency oscillations (HFOs); Seizure onset zone.
Copyright © 2014 Elsevier Inc. All rights reserved.
Figures
Similar articles
-
Centre of epileptogenic tubers generate and propagate seizures in tuberous sclerosis.Brain. 2016 Oct;139(Pt 10):2653-2667. doi: 10.1093/brain/aww192. Epub 2016 Aug 6. Brain. 2016. PMID: 27497492
-
Intracranial EEG seizure onset-patterns correlate with high-frequency oscillations in patients with drug-resistant epilepsy.Epilepsy Res. 2016 Nov;127:200-206. doi: 10.1016/j.eplepsyres.2016.09.009. Epub 2016 Sep 6. Epilepsy Res. 2016. PMID: 27635628
-
Epileptogenic networks of type II focal cortical dysplasia: a stereo-EEG study.Neuroimage. 2012 Jul 2;61(3):591-8. doi: 10.1016/j.neuroimage.2012.03.090. Epub 2012 Apr 6. Neuroimage. 2012. PMID: 22510255
-
Defining epileptogenic networks: Contribution of SEEG and signal analysis.Epilepsia. 2017 Jul;58(7):1131-1147. doi: 10.1111/epi.13791. Epub 2017 May 20. Epilepsia. 2017. PMID: 28543030 Review.
-
How to establish causality in epilepsy surgery.Brain Dev. 2013 Sep;35(8):706-20. doi: 10.1016/j.braindev.2013.04.004. Epub 2013 May 15. Brain Dev. 2013. PMID: 23684007 Free PMC article. Review.
Cited by
-
The spatial relationship between the MRI lesion and intraoperative electrocorticography in focal epilepsy surgery.Brain Commun. 2022 Nov 21;4(6):fcac302. doi: 10.1093/braincomms/fcac302. eCollection 2022. Brain Commun. 2022. PMID: 36519154 Free PMC article.
-
Physiological and pathological neuronal connectivity in the living human brain based on intracranial EEG signals: the current state of research.Front Netw Physiol. 2023 Nov 30;3:1297345. doi: 10.3389/fnetp.2023.1297345. eCollection 2023. Front Netw Physiol. 2023. PMID: 38107334 Free PMC article. Review.
-
SEEG-based reevaluation of epileptogenic networks and the predictive role for reoperation in MTLE patients with surgical failure.Epilepsia Open. 2023 Sep;8(3):846-857. doi: 10.1002/epi4.12743. Epub 2023 Apr 27. Epilepsia Open. 2023. PMID: 37043173 Free PMC article.
-
Phase-amplitude coupling between interictal high-frequency activity and slow waves in epilepsy surgery.Epilepsia. 2018 Oct;59(10):1954-1965. doi: 10.1111/epi.14544. Epub 2018 Aug 26. Epilepsia. 2018. PMID: 30146766 Free PMC article.
-
Investigation of global brain dynamics depending on emotion regulation strategies indicated by graph theoretical brain network measures at system level.Cogn Neurodyn. 2023 Apr;17(2):331-344. doi: 10.1007/s11571-022-09843-w. Epub 2022 Jul 25. Cogn Neurodyn. 2023. PMID: 37007189 Free PMC article.
References
-
- Adhikari BM, Epstein CM, Dhamala M. Localizing epileptic seizure onsets with Granger causality. Phys Rev E Stat Nonlin Soft Matter Phys. 2013;88:030701. - PubMed
-
- Baccala LA, Alvarenga MY, Sameshima K, Jorge CL, Castro LH. Graph theoretical characterization and tracking of the effective neural connectivity during episodes of mesial temporal epileptic seizure. J Integr Neurosci. 2004;3:379–395. - PubMed
-
- Baccala LA, Sameshima K. Partial directed coherence: a new concept in neural structure determination. Biol Cybern. 2001;84:463–474. - PubMed
-
- Bettus G, Wendling F, Guye M, Valton L, Regis J, Chauvel P, Bartolomei F. Enhanced EEG functional connectivity in mesial temporal lobe epilepsy. Epilepsy Res. 2008;81:58–68. - PubMed
-
- Blaker H. Confidence curves and improved exact confidence intervals for discrete distributions. Canadian Journal of Statistics. 2000;28:783–798. correction 729, 681.
Publication types
MeSH terms
Grants and funding
LinkOut - more resources
Full Text Sources
Other Literature Sources
Medical
