. 2014 Jul 8;9(7):e101084.
doi: 10.1371/journal.pone.0101084. eCollection 2014.

miR-196b-mediated translation regulation of mouse insulin2 via the 5'UTR

Affiliations

miR-196b-mediated translation regulation of mouse insulin2 via the 5'UTR

Amaresh C Panda et al. PLoS One. .

Abstract

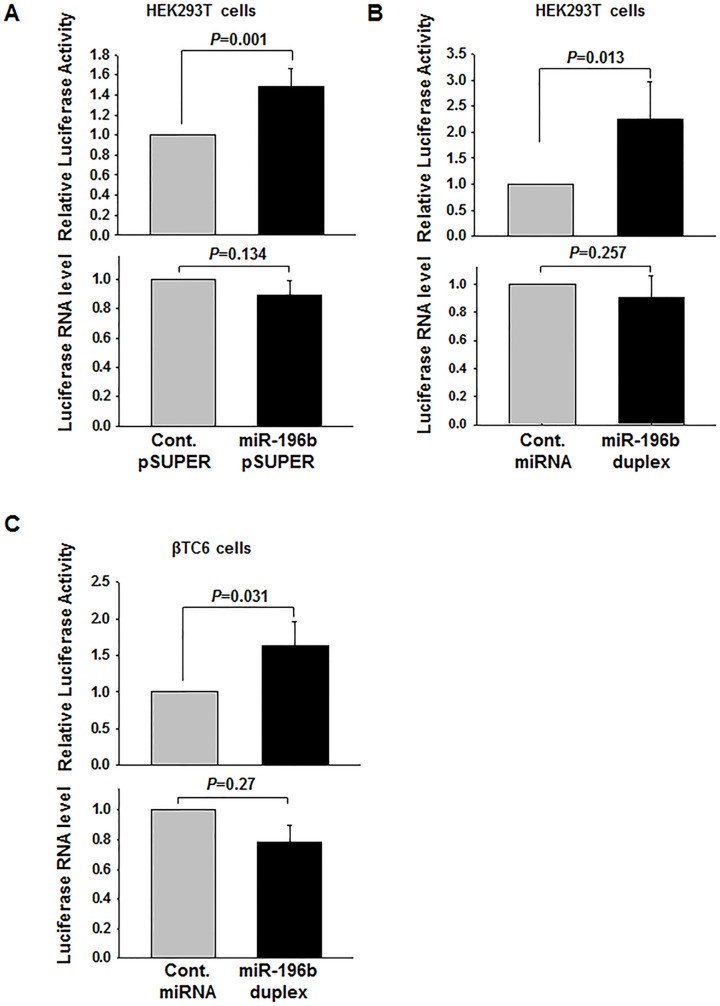
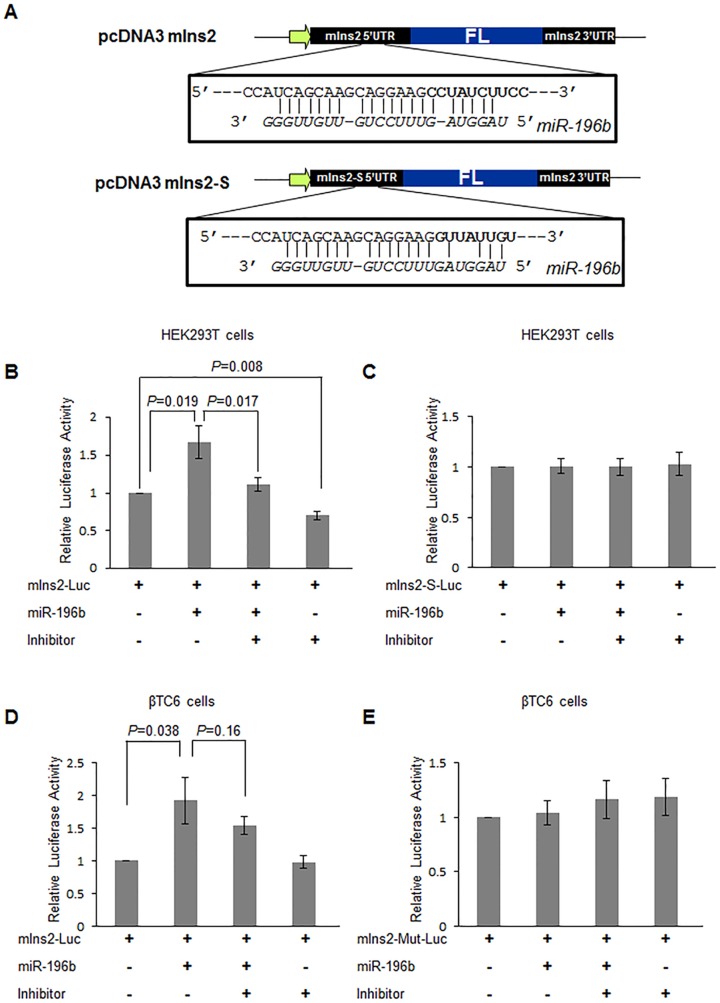
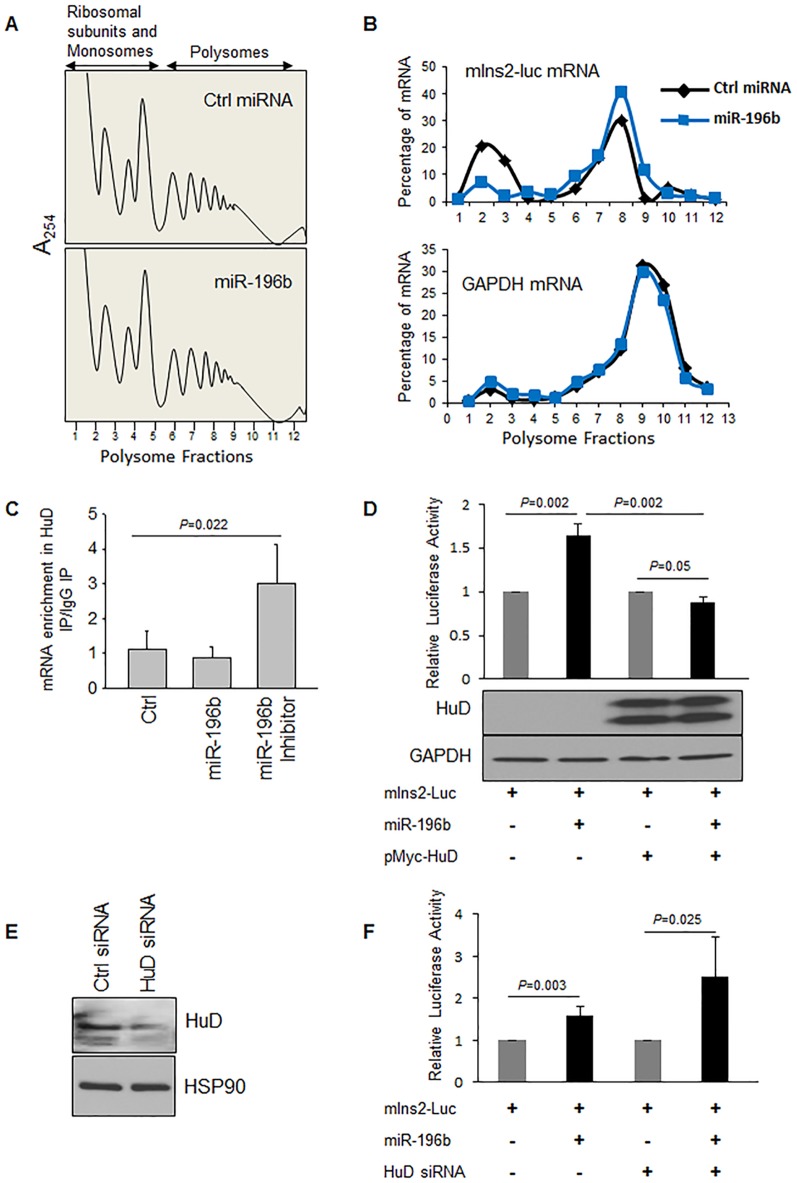
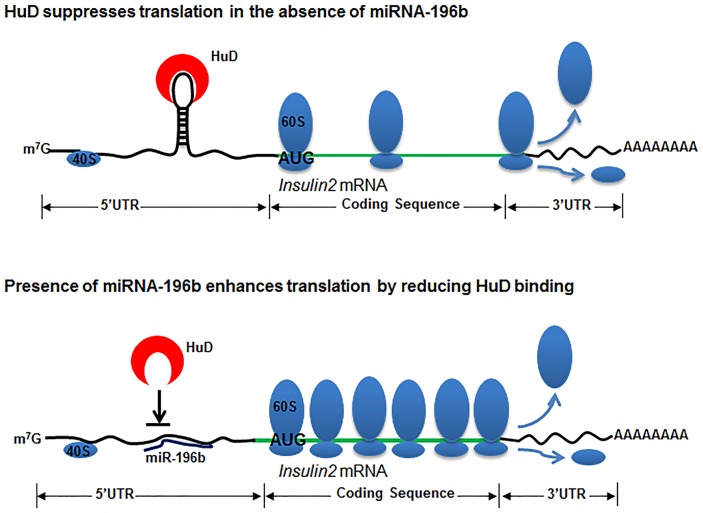
The 5' and the 3' untranslated regions (UTR) of the insulin genes are very well conserved across species. Although microRNAs (miRNAs) are known to regulate insulin secretion process, direct regulation of insulin biosynthesis by miRNA has not been reported. Here, we show that mouse microRNA miR-196b can specifically target the 5'UTR of the long insulin2 splice isoform. Using reporter assays we show that miR-196b specifically increases the translation of the reporter protein luciferase. We further show that this translation activation is abolished when Argonaute 2 levels are knocked down after transfection with an Argonaute 2-directed siRNA. Binding of miR-196b to the target sequence in insulin 5'UTR causes the removal of HuD (a 5'UTR-associated translation inhibitor), suggesting that both miR-196b and HuD bind to the same RNA element. We present data suggesting that the RNA-binding protein HuD, which represses insulin translation, is displaced by miR-196b. Together, our findings identify a mechanism of post-transcriptional regulation of insulin biosynthesis.


Conflict of interest statement

Competing Interests: The authors have declared that no competing interests exist.

Figures

Figure 1
Figure 1. miR-196b activates insulin2-reporter expression.
(A) HEK293T cells were co-transfected with the insulin2 reporter and with miR-196b pSUPER/cont miR pSUPER. Forty-eight hr later, firefly and Renilla luciferase activities were measured. (B, C) The miR-196b duplex/Control siRNA was transfected along with insulin2 reporter construct and Renilla luciferase as internal control in HEK293T (B) or βTC6 (C). The fold change in translation is shown for the insulin2 reporter, with expression levels of control miRNA-transfected cells set to 1. The relative RNA levels as assessed by RT-qPCR are indicated in the bottom panel. The graphs represent the means ± SD of 3–9 independent experiments; P values (Student's t-test) are indicated.
Figure 2
Figure 2. Translation activation mediated by miR-196b can be abolished by the anti miR-196b inhibitor.
(A) Schematic representation of the reporter constructs for insulin2 and insulin2-S 5′UTR constructs. The bold letters in the RNA sequence represents the start of exon 2 of insulin2 mRNA and the lower italic letters represents the miR-196b sequence. The vertical lines between the sequences denote base pairing. (B, C) Anti-miR-196b was introduced into cells along with reporter and the miRNA-pSuper; 48 hr later, the effect of the miR-196b inhibitor was analyzed by measuring the relative luciferase activity in HEK293T cells transfected with insulin2 reporter (B) or insulin2-S reporter (C). (D, E) The miR-196b inhibitor and miR-196b duplex/control miRNA were introduced into βTC6 cells before transfecting with insulin2-luciferase reporter (D) or the mutant-reporter (E); 48 hr later, the effect of miR-196b inhibitor was analysed by measuring the relative luciferase activity in the indicated treatment groups. The graphs represent the means ± SD of 3 independent experiments; P values (Student's t-test) are indicated.
Figure 3
Figure 3. miR-196b requires Ago2 for translation activation of the target mRNA.
(A) Reporter insulin2-Luc was cotransfected into HEK293T cells along with miR-196b, control siRNA or Ago2 siRNA. The fold change in relative luciferase activity was measured with the activity of the luciferase construct with control miRNA set to 1. Bottom, representative western blot to detect the levels of Ago2 and loading control β-Actin. The sample in each lane is indicated. (B, C) RNA-EMSA using the radiolabeled insulin2 RNA as probe and extracts from βTC6 (B) or HEK293T (C) cells. The arrow indicates the shifted RNP complexes. The lower panel shows the RNA-protein complex intensity as measured by densitometry. The graphs represent the means ± SD of 3 independent experiments; P values (Student's t-test) are indicated.
Figure 4
Figure 4. miR196b induces polysome association of Insulin2 reporter mRNA by inhibiting HuD binding.
(A) Lysates prepared from βTC6 cells transfected with Ctrl miRNA or mature miR-196 were fractionated through sucrose gradients to generate polysome profiles. Fractions 1–5 and 6–12 were considered as non-polysome and polysome respectively. (B) The relative distribution of Insulin2 reporter mRNA and GAPDH mRNA on polysome gradients was studied by RT-qPCR analysis of the RNA present in each of 12 gradient fractions, and represented as percentage of total mRNA. One of the representative experiments is shown here. (C) Interaction of HuD with Ins2-reporter mRNA in βTC6 cells transfected with control, mature miR-196b or miR-196b inhibitor, was studied by mRNP IP analysis using anti-HuD or control IgG antibodies. The RNA in the IP material was isolated, and Ins2-reporter mRNA levels were measured by RT-qPCR analysis and normalized to PGK mRNA levels. (D) Translation upregulation of insulin2 reporter with miR-196b in HEK293T cells transfected with either control or Myc-HuD plasmid. Lower panel shows the immunoblot for the over expression of Myc-HuD. (E, F) Forty-eight hours after transfection of βTC6 cells with Ctrl siRNA or HuD siRNA, HuD silencing was assessed by western blot analysis (E). Luciferase reporter with insulin2 5′UTR along with miR-196b or control miRNA duplex was introduced into βTC6 cells expressing normal or reduced HuD levels (F). The fold change in relative luciferase activity was measured with the activity of the luciferase construct with control miRNA set to 1. The graphs in (C,D,F) represent the means ± SD of 3-9 independent experiments; P values (Student's t-test) are indicated.
Figure 5
Figure 5. Expression of miR-196b.
(A) Schematic of the method used for miRNA RT-PCR using QuantiMiR kit (SBI). (B) The cDNA for miRNA RT-PCR was prepared from 1 µg of total RNA from βTC6 cells using QuantiMiR RT kit as per the manufacturer protocol. The upper panel shows the average absolute values calculated from Ct values of RT-qPCR of miRNAs amplified using universal reverse primer from the QuantiMiR kit and specific forward primers for respective miRNAs. The lower panel shows the miRNA RT-PCR or No RT-PCR products were resolved on a 3.5% agarose gel. (C) Comparison of miR-196b, miR-30d, and miR-375 expression from RT-qPCR data of βTC6 total. Copy numbers per 1 pg of total RNA were calculated using standard curve based on known amount of miRNA. (D) cDNA for miR-196b was prepared by miR-196b-RT stem-loop primer and amplified with specific primers (primers 18 and 20, Table S1). The cDNA for miR-375 was prepared by miR-375-RT stem-loop primer and amplified with specific primers (primers 19 and 20, Table S1) from e14.5 day pancreas and the PCR product was resolved on a 3.5% agarose gel. (E) Insulin2 RT-PCR detection using gene-specific primer (primers 1 and 2, Table S1) using RNA isolated from e14.5 day mouse pancreas. (F) The change in expression of various miRNAs in high glucose treated βTC6 cells using QuantiMiR RT-qPCR kit. (G) Expression of insulin2 reporter in high glucose treated βTC6 cells normalized to renilla expression. In (C,F,G) the graphs represent means ± SD of 3-8 independent experiments; P values (Student's t-test) are indicated.
Figure 6
Figure 6. Mechanism of miR-196b action.
The miR-196b target site is at the 5′UTR stem loop structure of the insulin2 mRNA. Targeting of miR-196b to the stem-loop region of the insulin2 mRNA disrupts the secondary structure and prevents binding of the translational inhibitor, resulting in the activation of insulin translation.

References

    1. Wessells NK, Evans J (1968) Ultrastructural studies of early morphogenesis and cytodifferentiation in the embryonic mammalian pancreas. Dev Biol 17(4): 413–46. - PubMed
    1. Docherty K, Clark AR (1994) Nutrient regulation of insulin gene expression. FASEB J 8(1): 20–7. - PubMed
    1. Itoh N, Sei T, Nose K, Hiroshi O (1978) Glucose stimulation of the proinsulin synthesis in isolated pancreatic islets without increasing amount of proinsulin mRNA. FEBS Lett 93(2): 343–7. - PubMed
    1. Wicksteed B, Herbert TP, Alarcon C, Lingohr MK, Moss LG, et al. (2001) Cooperativity between the preproinsulin mRNA untranslated regions is necessary for glucose-stimulated translation. J Biol Chem 276(25): 22553–8. - PubMed
    1. Muralidharan B, Bakthavachalu B, Pathak A, Seshadri V (2007) A minimal element in 5'UTR of insulin mRNA mediates its translational regulation by glucose. FEBS Lett 581(21): 4103–8. - PubMed

Publication types