. 2014 Jul 8;9(7):e101949.
doi: 10.1371/journal.pone.0101949. eCollection 2014.

IL-10 and lymphotoxin-α expression profiles within marginal zone-like B-cell populations are associated with control of HIV-1 disease progression

Collaborators, Affiliations

IL-10 and lymphotoxin-α expression profiles within marginal zone-like B-cell populations are associated with control of HIV-1 disease progression

Josiane Chagnon-Choquet et al. PLoS One. .

Abstract

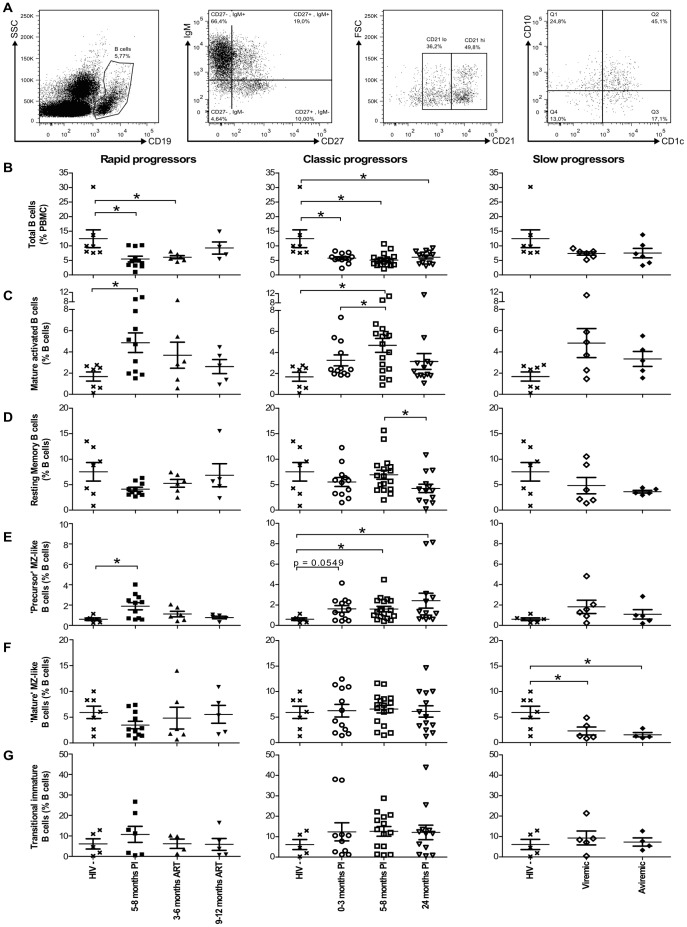
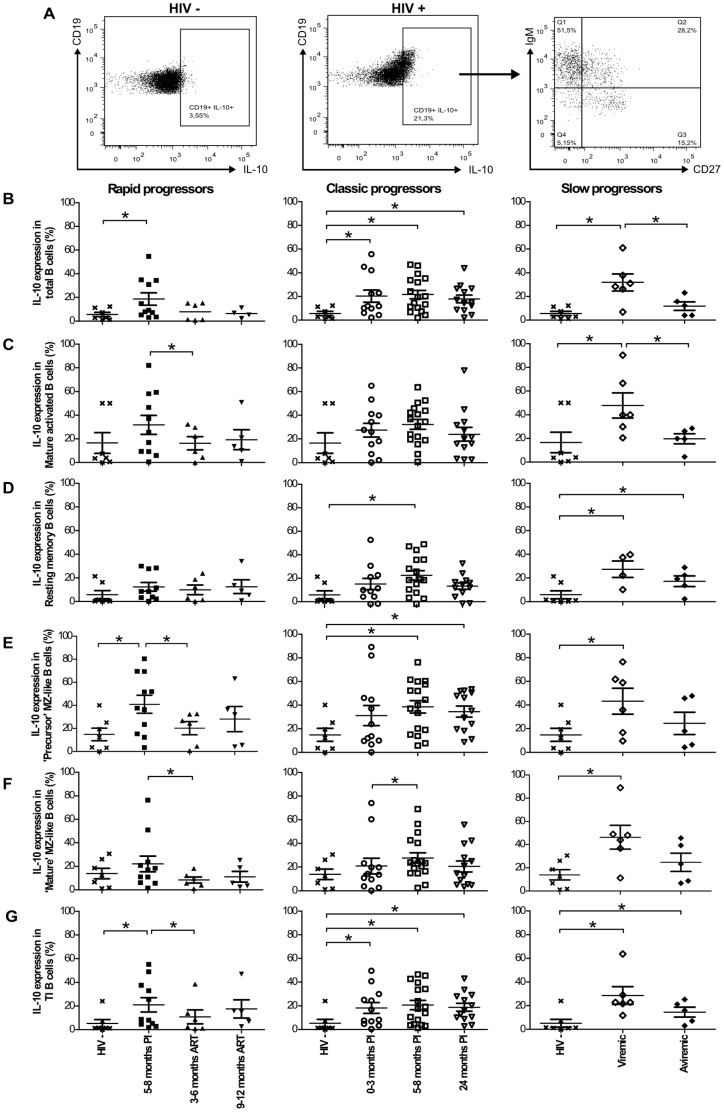
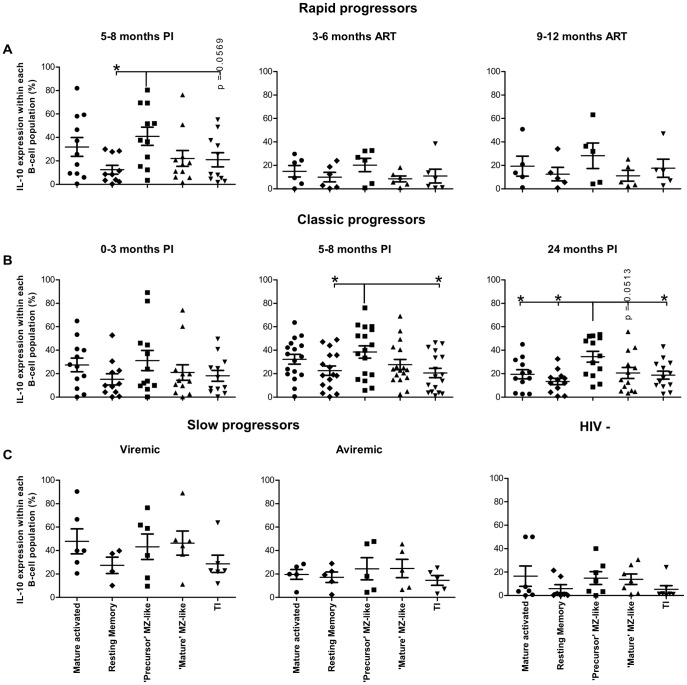
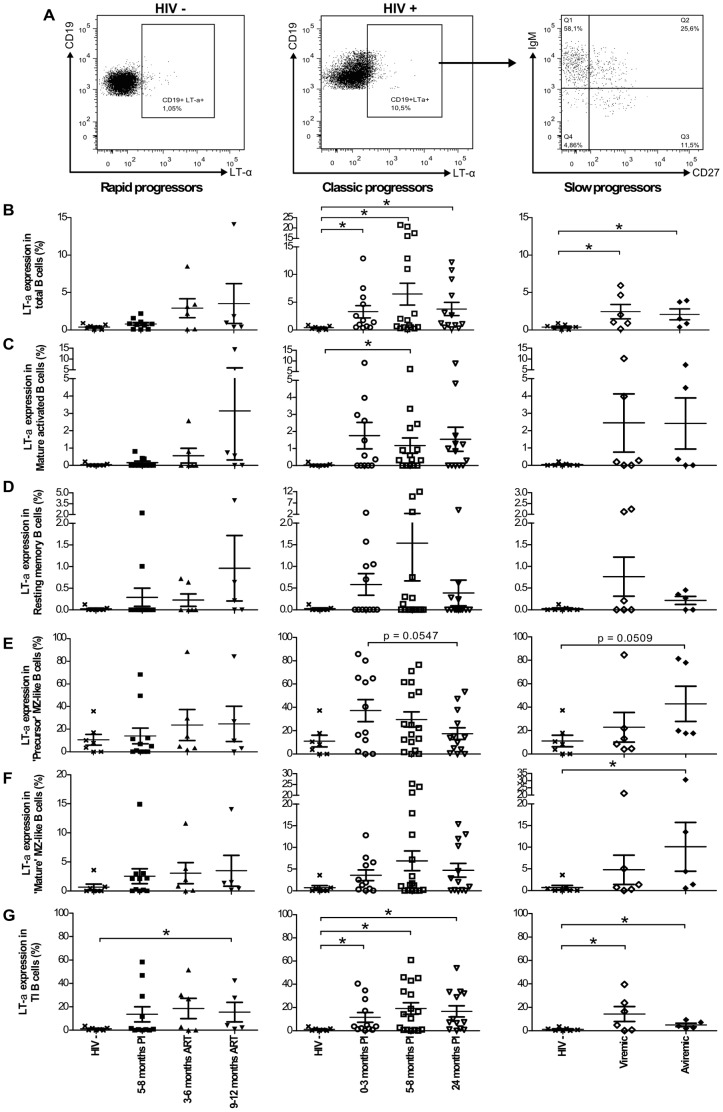
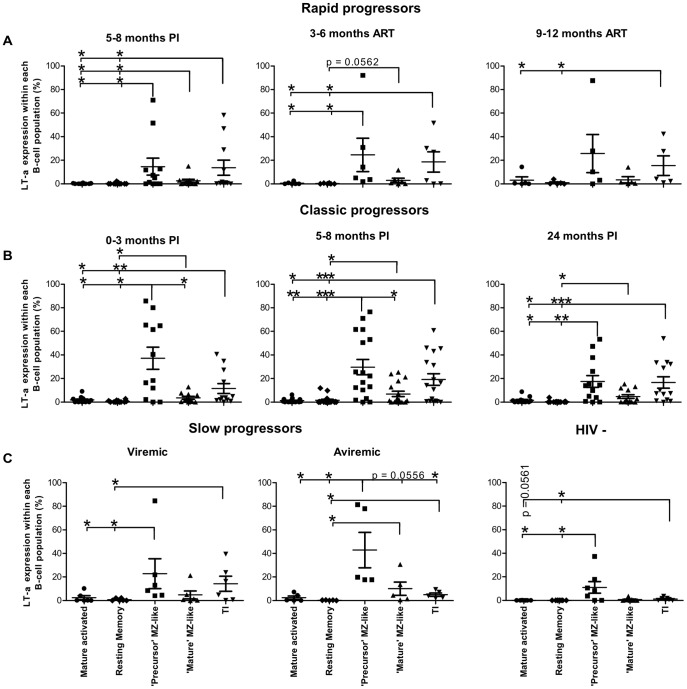
Understanding how the immune system facilitates or controls HIV-1 disease progression has important implications for the design of effective interventions. We report that although B-cell dysregulations associated with HIV-1 disease progression are accompanied by an overall decrease in the percentage of total blood B-cells, we observe an increase in relative frequencies of cells presenting characteristics of both transitional immature and first-line marginal zone (MZ) B-cell populations, we designated as precursor MZ-like B-cells. B-cells with similar attributes have been associated with IL-10 expression and "regulatory" potential. As such, the relative frequencies of precursor MZ-like B-cells expressing IL-10 are increased in the blood of viremic HIV-1-infected individuals when compared to HIV-negative subjects. Importantly, in aviremic HIV-1 Elite-Controllers (EC), we found unaltered relative percentages of precursor MZ-like B-cells which presented normal IL-10 expression patterns. Furthermore, EC had increased relative frequencies of blood MZ-like B-cells expressing LT-α. Thus in contrast to viremic HIV-1-infected individuals, EC present MZ-like B-cell populations which IL-10 and LT-α expression profiles may favour homeostasis of immune responses and lymphoid microenvironments.


Conflict of interest statement

Competing Interests: The authors have declared that no competing interests exist.

Figures

Figure 1
Figure 1. Longitudinal analysis of blood B-cell populations of HIV-1 infected individuals.
(A) Representative plot showing gating strategy on live PBMCs. Total CD19+ B-cells were selected based on expression of CD27 and/or IgM, and levels of CD21. CD1c and CD10 expression were used for further characterisation of blood MZ and TI B-cell populations respectively, as reported . Quadrants were set based on the expression values obtained with fluorescence minus one (FMO) and isotype controls. Mature activated B-cells are defined as CD19+CD27+IgM-CD21loCD1c-CD10-, resting switched memory B-cells are CD19+CD27+IgM-CD21hiCD10-, precursor marginal-zone (MZ)-like B-cells are CD19+CD27+IgM+CD21loCD1c+ CD10+, mature MZ-like B-cells are CD19+CD27+IgM+CD21hiCD1c+CD10- and transitional immature (TI) B-cells are CD19+CD27-IgM+CD21hiCD1c-CD10+. The graphs present (B) percentages of total B-cells (mean events gated: 9320±1750), and the relative frequencies of (C) mature activated (mean events gated: 360±67), (D) resting switched memory (mean events gated: 632±301), (E) precursor MZ-like (mean events gated: 145±36), (F) mature MZ-like (mean events gated: 327±233) and (G) TI (mean events gated: 944±174) B-cell populations in the blood of rapid progressors (left panels; 5–8 months PI (n = 11), 3–6 months ART (n = 6) and 9–12 months ART (n = 5)), classic progressors (middle panels; 0–3 months PI (n = 12), 5–8 months PI (n = 17), and 24 months PI (n = 13)), and viremic and aviremic slow progressors (EC) (right panels; viremic (n = 6); aviremic (n = 5)). The same values for HIV-negative donors in the left, middle and right panels are used as a control group (n = 7). Cell population frequencies were compared using the Wilcoxon signed rank test and the Mann-Whitney U test for pairwise comparisons of different phases of infection within each group and between the study groups, respectively. Data shown are mean ±SEM. * p<0.05. PI, post-infection; ART, antiretroviral therapy.
Figure 2
Figure 2. IL-10 expression by blood B-cell populations.
(A) Representative plot showing gating strategy on live total CD19+ B-cells from HIV- and HIV+ donors, expressing IL-10. Frequencies of cells expressing IL-10 within (B) total, (C) mature activated, (D) resting switched memory, (E) precursor marginal zone (MZ)-like, (F) mature MZ-like and (G) transitional immature (TI) B-cell populations in the blood of rapid progressors (left panels; 5–8 months PI (n = 11), 3–6 months ART (n = 6) and 9–12 months ART (n = 5)), classic progressors (middle panels; 0–3 months PI (n = 12), 5–8 months PI (n = 17), and 24 months PI (n = 13)), and viremic and aviremic slow progressors (EC) (right panels; viremic (n = 6); aviremic (n = 5)). The same values for HIV-negative donors in the left, middle and right panels are used as a control group (n = 7). Data are expressed as percentages of IL-10 expression within each B-cell population. Cell population frequencies were compared using the Wilcoxon signed rank test and the Mann-Whitney U test for pairwise comparisons of different phases of infection within each group and between the study groups, respectively. Data shown are mean ±SEM. * p<0.05. PI, postinfection; ART, antiretroviral therapy.
Figure 3
Figure 3. Percentage of IL-10 expressing cells for each B-cell population, within each patient group.
Percentage of IL-10 expressing cells within mature activated, resting switched memory, precursor marginal zone (MZ)-like, mature MZ-like and transitional immature (TI) B-cells within (A) rapid progressors (5–8 months PI (n = 11), 3–6 months ART (n = 6) and 9–12 months ART (n = 5), (B) classic progressors (0–3 months PI (n = 12), 5–8 months PI (n = 17), and 24 months PI (n = 13)), (C) slow progressors (viremic (n = 6); aviremic (n = 5)), and HIV-negative individuals (n = 7). Percentages were compared using the Mann-Whitney U test between the B-cell populations. Data shown are mean ±SEM. *p<0.05. PI, postinfection; ART, antiretroviral therapy.
Figure 4
Figure 4. LT-α expression by blood B-cell populations.
(A) Representative plot showing gating strategy on live total CD19+ B-cells from HIV- and HIV+ donors, expressing LT-α. Frequencies of cells expressing LT-α within (B) total, (C) mature activated, (D) resting switched memory, (E) precursor marginal zone (MZ)-like, (F) mature MZ-like and (G) transitional immature (TI) B-cells expressing LT-α in the blood of rapid progressors (left panels; 5–8 months PI (n = 11), 3–6 months ART (n = 6) and 9–12 months ART (n = 5)), classic progressors (middle panels; 0–3 months PI (n = 12), 5–8 months PI (n = 17), and 24 months PI (n = 13)), and viremic and aviremic slow progressors (EC) (right panels; viremic (n = 6); aviremic (n = 5)). The same values for HIV-negative donors in the left, middle and right panels are used as a control group (n = 7). Data are expressed as percentages of LT-α expression within each B-cell population. Cell population frequencies were compared using the Wilcoxon signed rank test and the Mann-Whitney U test for pairwise comparisons of different phases of infection within each group and between the study groups, respectively. Data shown are mean ±SEM. * p<0.05. PI, postinfection; ART, antiretroviral therapy.
Figure 5
Figure 5. Percentage of LT-α expressing cells for each B-cell population, within each patient group.
Percentage of LT-α expressing cells within mature activated, resting switched memory, precursor marginal zone (MZ)-like, mature MZ-like and transitional immature (TI) B-cells within (A) rapid progressors (5–8 months PI (n = 11), 3–6 months ART (n = 6) and 9–12 months ART (n = 5), (B) classic progressors (0–3 months PI (n = 12), 5–8 months PI (n = 17), and 24 months PI (n = 13)), (C) slow progressors (viremic (n = 6); aviremic (n = 5)), and HIV-negative individuals (n = 7). Percentages were compared using the Mann-Whitney U test between the B-cell populations. Data shown are mean ±SEM. * p<0.05, ** p<0.001, *** p<0.0001. PI, postinfection; ART, antiretroviral therapy.

Similar articles

Cited by

References

    1. Moir S, Fauci AS (2009) B cells in HIV infection and disease. Nat Rev Immunol 9: 235–245. - PMC - PubMed
    1. Poudrier J, Chagnon-Choquet J, Roger M (2012) Influence of Dendritic cells on B-cell Responses during HIV Infection. Clin Dev Immunol doi:10.1155/2012/592187. - PMC - PubMed
    1. Hanna Z, Kay DG, Rebai N, Guimond A, Jothy S, et al. (1998) Nef harbors a major determinant of pathogenicity for an AIDS-like disease induced by HIV-1 in transgenic mice. Cell 95: 163–175. - PubMed
    1. Poudrier J, Weng X, Kay DG, Paré G, Calvo EL, et al. (2001) The AIDS disease of CD4C/HIV transgenic mice shows impaired germinal centers and autoantibodies and develops in the absence of IFN-gamma and IL-6. Immunity 15: 173–185. - PubMed
    1. Poudrier J, Weng X, Kay DG, Hanna Z, Jolicoeur P (2003) The AIDS-like disease of CD4C/human immunodeficiency virus transgenic mice is associated with accumulation of immature CD11bHi dendritic cells. J Virol 77: 11733–11744. - PMC - PubMed

Publication types