

Location, location, location: cytokine concentrations are dependent on blood sampling site
- PMID: 25004061
- PMCID: PMC4167217
- DOI: 10.1097/SHK.0000000000000222
Location, location, location: cytokine concentrations are dependent on blood sampling site
Abstract
Objective: Considerable breakthroughs in the field of sepsis have been made using animal models. Sepsis exhibits a wide array of derangements that may be evaluated in the blood, including the release of proinflammatory and anti-inflammatory cytokines. The Shock journal adheres to the ARRIVE guidelines regarding reporting in vivo results to allow reproducibility of data findings. It is generally assumed that blood cytokine concentrations collected from typical sampling sites will be similar, but there are no data validating that this is true. The main purpose of the present study was to determine if the location of blood sampling results in cytokine concentration differences following inflammatory insults.
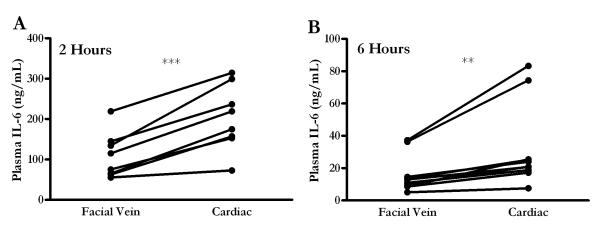
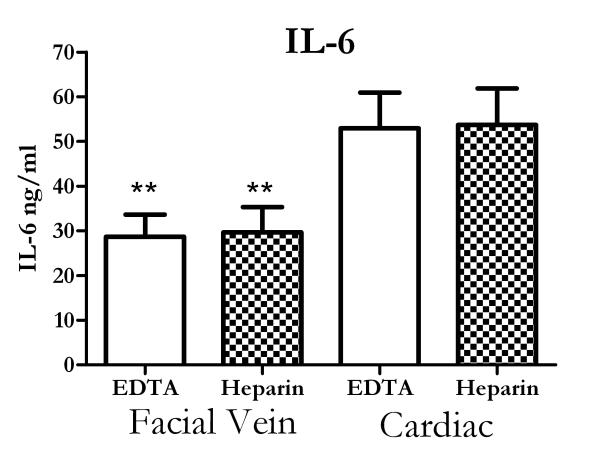
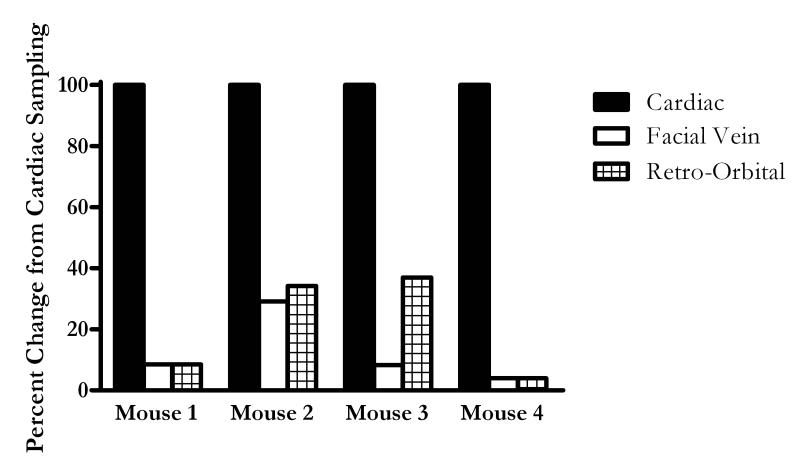
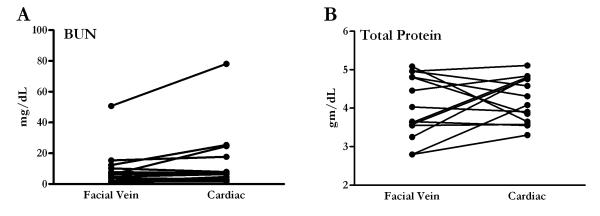
Methods: Two different models of acute inflammation were studied. Adult, female ICR (Institute of Cancer Research) mice were injected with Escherichia coli lipopolysaccharide (n = 28) or subjected to cecal ligation and puncture (n = 16). They were killed at early time points following these inflammatory challenges for the collection of blood from the facial vein, retro-orbital sinus, and heart. Additional samples were collected in EDTA and heparin. Plasma cytokines from the same mouse were collected from each sampling site and evaluated by enzyme-linked immunosorbent assay. Clinical chemical parameters including plasma blood urea nitrogen and total protein were also analyzed.
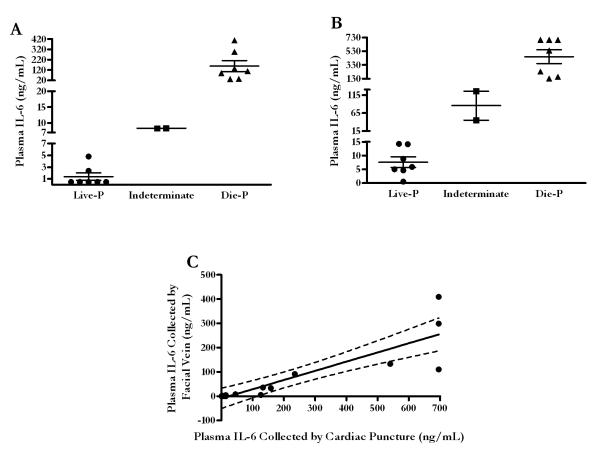
Results: Regardless of model, time of collection, or cytokine measured, cytokine values from heart blood were higher than facial vein values from the same mouse. Interleukin (IL-6) collected from the heart relative to the facial vein demonstrated elevated concentrations following injection of lipopolysaccharide. In a similar manner, higher concentrations of IL-6, macrophage inflammatory protein 2, IL-10, and IL-1 receptor antagonist were found in cardiac puncture samples compared with other sampling sites 24 h after sepsis induced by cecal ligation and puncture. Similar differences were not seen when comparing blood urea nitrogen and total protein values from the two different sites. Using plasma IL-6 collected from the heart would incorrectly stratify predicted-to-live mice into the predicted-to-die category. Therefore, a simple linear regression model was developed to correctly restratify mice to their predicted fate. These data demonstrate that proinflammatory and anti-inflammatory cytokine concentrations are dramatically elevated when drawn centrally from the heart compared with collection from peripheral locations such as the facial vein. It is critical for publications to document the sampling location when evaluating plasma cytokines and attempting to compare studies.
Figures
Similar articles
-
Stratification is the key: inflammatory biomarkers accurately direct immunomodulatory therapy in experimental sepsis.Crit Care Med. 2009 May;37(5):1567-73. doi: 10.1097/CCM.0b013e31819df06b. Crit Care Med. 2009. PMID: 19325479 Free PMC article.
-
Sepsis chronically in MARS: systemic cytokine responses are always mixed regardless of the outcome, magnitude, or phase of sepsis.J Immunol. 2012 Nov 1;189(9):4648-56. doi: 10.4049/jimmunol.1201806. Epub 2012 Sep 24. J Immunol. 2012. PMID: 23008446 Free PMC article.
-
Circulating cytokine/inhibitor profiles reshape the understanding of the SIRS/CARS continuum in sepsis and predict mortality.J Immunol. 2006 Aug 1;177(3):1967-74. doi: 10.4049/jimmunol.177.3.1967. J Immunol. 2006. PMID: 16849510
-
Systemic inflammatory response to exhaustive exercise. Cytokine kinetics.Exerc Immunol Rev. 2002;8:6-48. Exerc Immunol Rev. 2002. PMID: 12690937 Review.
-
Inconsistent terminology in rodent anatomy hinders appropriate blood sampling in laboratory animal science: A review of blood sampling techniques on the head of mice.Lab Anim. 2025 Jun;59(3):332-341. doi: 10.1177/00236772241304504. Epub 2025 Jan 25. Lab Anim. 2025. PMID: 39862173 Review.
Cited by
-
Assessment of the adjuvant activity of mesoporous silica nanoparticles in recombinant Mycoplasma hyopneumoniae antigen vaccines.Heliyon. 2017 Jan 6;3(1):e00225. doi: 10.1016/j.heliyon.2016.e00225. eCollection 2017 Jan. Heliyon. 2017. PMID: 28194450 Free PMC article.
-
Comparison of murine retroorbital plexus and facial vein blood collection to mitigate animal ethics issues.Lab Anim Res. 2021 May 6;37(1):12. doi: 10.1186/s42826-021-00090-4. Lab Anim Res. 2021. PMID: 33958002 Free PMC article.
-
Neurokinin-1 Receptor Deficiency Improves Survival in Murine Polymicrobial Sepsis Through Multiple Mechanisms in Aged Mice.Shock. 2019 Jul;52(1):61-66. doi: 10.1097/SHK.0000000000001248. Shock. 2019. PMID: 30095600 Free PMC article.
-
Linoleic acid improves PIEZO2 dysfunction in a mouse model of Angelman Syndrome.Nat Commun. 2023 Mar 1;14(1):1167. doi: 10.1038/s41467-023-36818-0. Nat Commun. 2023. PMID: 36859399 Free PMC article.
-
CD4+ T Cell Regulatory Network Underlies the Decrease in Th1 and the Increase in Anergic and Th17 Subsets in Severe COVID-19.Pathogens. 2022 Dec 22;12(1):18. doi: 10.3390/pathogens12010018. Pathogens. 2022. PMID: 36678366 Free PMC article.
References
-
- Angus DC, Linde-Zwirble WT, Lidicker J, Clermont G, Carcillo J, Pinsky MR. Epidemiology of severe sepsis in the United States: analysis of incidence, outcome, and associated costs of care. Crit Care Med. 2001;29(7):1303–10. - PubMed
-
- Martin GS, Mannino DM, Eaton S, Moss M. The epidemiology of sepsis in the United States from 1979 through 2000. N Engl J Med. 2003;348(16):1546–54. - PubMed
-
- Seok J, Warren HS, Cuenca AG, Mindrinos MN, Baker HV, Xu W, Richards DR, McDonald-Smith GP, Gao H, Hennessy L, Finnerty CC, Lopez CM, Honari S, Moore EE, Minei JP, Cuschieri J, Bankey PE, Johnson JL, Sperry J, Nathens AB, Billiar TR, West MA, Jeschke MG, Klein MB, Gamelli RL, Gibran NS, Brownstein BH, Miller-Graziano C, Calvano SE, Mason PH, Cobb JP, Rahme LG, Lowry SF, Maier RV, Moldawer LL, Herndon DN, Davis RW, Xiao W, Tompkins RG. Genomic responses in mouse models poorly mimic human inflammatory diseases. Proc Natl Acad Sci U S A. 2013;110(9):3507–12. - PMC - PubMed
-
- Remick D. Use of animal models for the study of human disease-a shock society debate. Shock. 2013;40(4):345–6. - PubMed
-
- Osuchowski MF, Remick DG, Lederer JA, Lang CH, Aasen AO, Aibiki M, Azevedo LC, Bahrami S, Boros M, Cooney R, Cuzzocrea S, Jiang Y, Junger WG, Hirasawa H, Hotchkiss RS, Li XA, Radermacher P, Redl H, Salomao R, Soebandrio A, Thiemermann C, Vincent JL, Ward P, Yao YM, Yu HP, Zingarelli B, Chaudry IH. Abandon the Mouse Research Ship? Not Just Yet! Shock. 2014 - PMC - PubMed
Publication types
MeSH terms
Substances
Grants and funding
LinkOut - more resources
Full Text Sources
Other Literature Sources
Medical
