

Dysregulation of system xc(-) expression induced by mutant huntingtin in a striatal neuronal cell line and in R6/2 mice
- PMID: 25004085
- PMCID: PMC4186714
- DOI: 10.1016/j.neuint.2014.06.017
Dysregulation of system xc(-) expression induced by mutant huntingtin in a striatal neuronal cell line and in R6/2 mice
Abstract
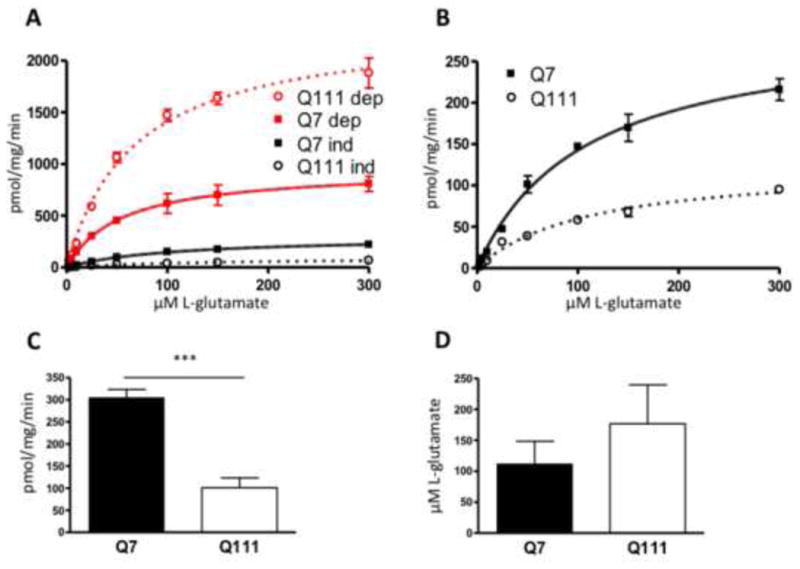
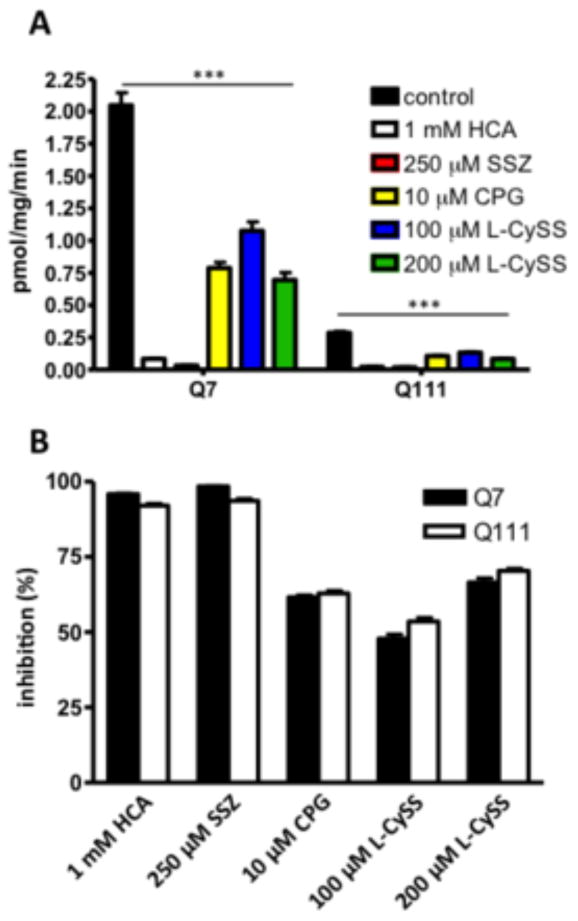
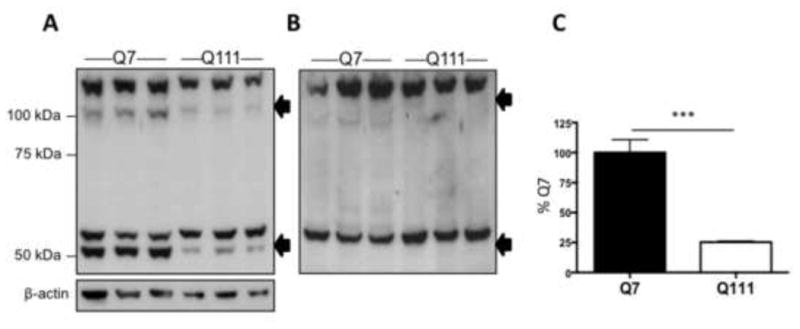
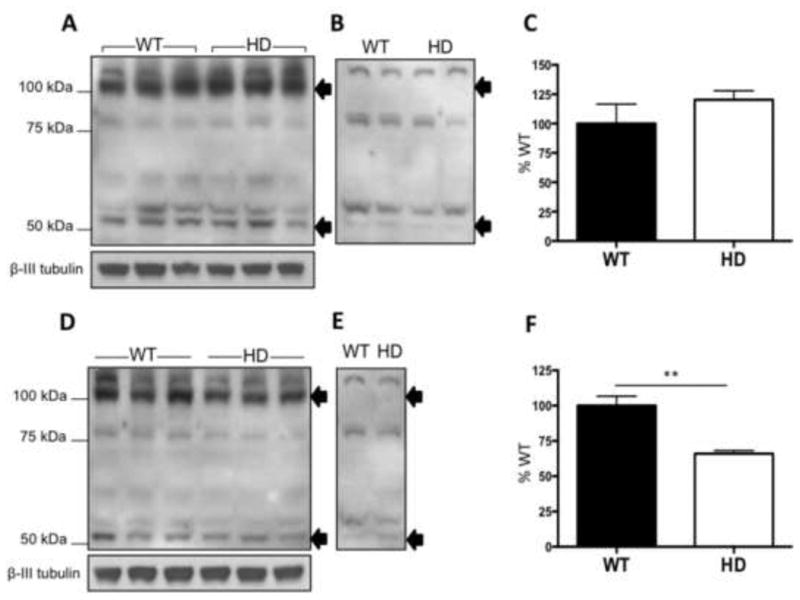
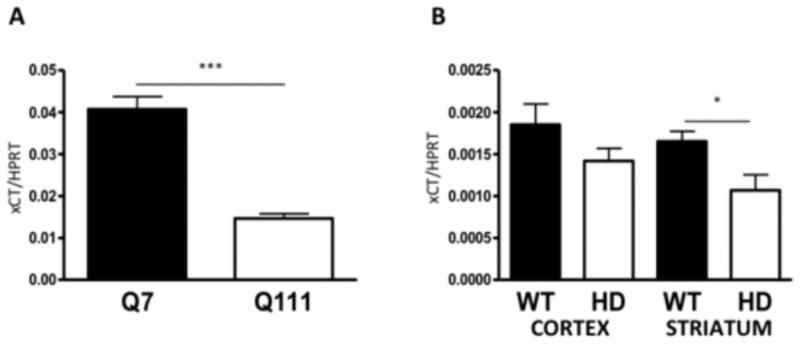
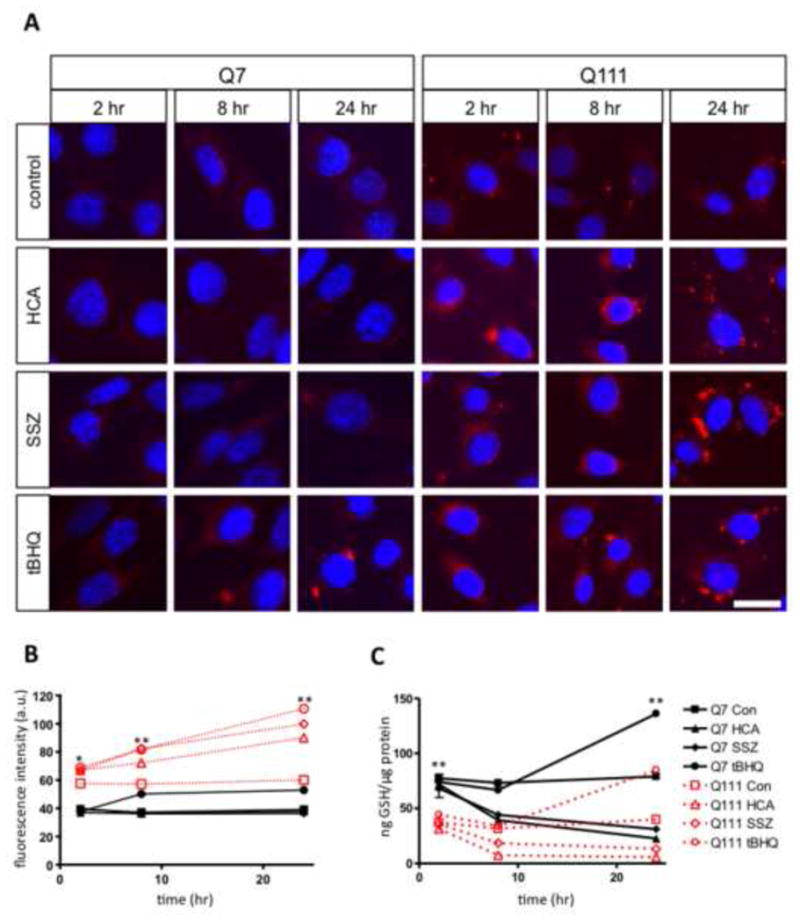
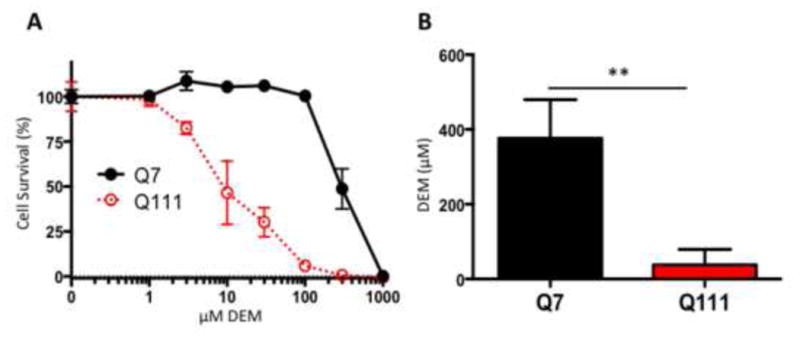
Oxidative stress has been implicated in the pathogenesis of Huntington's disease (HD), however, the origin of the oxidative stress is unknown. System xc(-) plays a role in the import of cystine to synthesize the antioxidant glutathione. We found in the STHdh(Q7/Q7) and STHdh(Q111/Q111) striatal cell lines, derived from neuronal precursor cells isolated from knock-in mice containing 7 or 111 CAG repeats in the huntingtin gene, that there is a decrease in system xc(-) function. System xc(-) is composed of two proteins, the substrate specific transporter, xCT, and an anchoring protein, CD98. The decrease in function in system xc(-) that we observed is caused by a decrease in xCT mRNA and protein expression in the STHdh(Q111/Q111) cells. In addition, we found a decrease in protein and mRNA expression in the transgenic R6/2 HD mouse model at 6weeks of age. STHdh(Q111/Q111) cells have lower basal levels of GSH and higher basal levels of ROS. Acute inhibition of system xc(-) causes greater increase in oxidative stress in the STHdh(Q111/Q111) cells than in the STHdh(Q7/Q7) cells. These results suggest that a defect in the regulation of xCT may be involved in the pathogenesis of HD by compromising xCT expression and increasing susceptibility to oxidative stress.
Keywords: Glutamate uptake; Glutathione; Huntington’s disease; Oxidative stress; STHdh cells; xCT.
Copyright © 2014 Elsevier Ltd. All rights reserved.
Conflict of interest statement
Conflict of interest: None
Figures
Similar articles
-
Differential proteomic and genomic profiling of mouse striatal cell model of Huntington's disease and control; probable implications to the disease biology.J Proteomics. 2016 Jan 30;132:155-66. doi: 10.1016/j.jprot.2015.11.007. Epub 2015 Nov 12. J Proteomics. 2016. PMID: 26581643
-
Increased expression of Bim contributes to the potentiation of serum deprivation-induced apoptotic cell death in Huntington's disease knock-in striatal cell line.Neurol Res. 2009 Feb;31(1):77-83. doi: 10.1179/174313208X331572. Epub 2008 Aug 7. Neurol Res. 2009. PMID: 18691453
-
Impaired mitochondrial dynamics and Nrf2 signaling contribute to compromised responses to oxidative stress in striatal cells expressing full-length mutant huntingtin.PLoS One. 2013;8(3):e57932. doi: 10.1371/journal.pone.0057932. Epub 2013 Mar 1. PLoS One. 2013. PMID: 23469253 Free PMC article.
-
MicroRNA-124 targets CCNA2 and regulates cell cycle in STHdh(Q111)/Hdh(Q111) cells.Biochem Biophys Res Commun. 2013 Jul 26;437(2):217-24. doi: 10.1016/j.bbrc.2013.06.041. Epub 2013 Jun 21. Biochem Biophys Res Commun. 2013. PMID: 23796713
-
The common inhaled anesthetic isoflurane increases aggregation of huntingtin and alters calcium homeostasis in a cell model of Huntington's disease.Toxicol Appl Pharmacol. 2011 Feb 1;250(3):291-8. doi: 10.1016/j.taap.2010.10.032. Epub 2010 Nov 6. Toxicol Appl Pharmacol. 2011. PMID: 21059370 Free PMC article.
Cited by
-
Main path and byways: non-vesicular glutamate release by system xc(-) as an important modifier of glutamatergic neurotransmission.J Neurochem. 2015 Dec;135(6):1062-79. doi: 10.1111/jnc.13348. Epub 2015 Sep 29. J Neurochem. 2015. PMID: 26336934 Free PMC article. Review.
-
Cysteine Metabolism in Neuronal Redox Homeostasis.Trends Pharmacol Sci. 2018 May;39(5):513-524. doi: 10.1016/j.tips.2018.02.007. Epub 2018 Mar 9. Trends Pharmacol Sci. 2018. PMID: 29530337 Free PMC article. Review.
-
Gasotransmitter hydrogen sulfide signaling in neuronal health and disease.Biochem Pharmacol. 2018 Mar;149:101-109. doi: 10.1016/j.bcp.2017.11.019. Epub 2017 Dec 1. Biochem Pharmacol. 2018. PMID: 29203369 Free PMC article. Review.
-
The importance of the excitatory amino acid transporter 3 (EAAT3).Neurochem Int. 2016 Sep;98:4-18. doi: 10.1016/j.neuint.2016.05.007. Epub 2016 May 24. Neurochem Int. 2016. PMID: 27233497 Free PMC article. Review.
-
Transcriptional control of amino acid homeostasis is disrupted in Huntington's disease.Proc Natl Acad Sci U S A. 2016 Aug 2;113(31):8843-8. doi: 10.1073/pnas.1608264113. Epub 2016 Jul 19. Proc Natl Acad Sci U S A. 2016. PMID: 27436896 Free PMC article.
References
-
- The Huntington's Disease Collaborative Research Group. A novel gene containing a trinucleotide repeat that is expanded and unstable on Huntington's disease chromosomes. Cell. 1993;72:971–983. - PubMed
-
- Aoyama K, Suh SW, Hamby AM, Liu J, Chan WY, Chen Y, Swanson RA. Neuronal glutathione deficiency and age-dependent neurodegeneration in the EAAC1 deficient mouse. Nat Neurosci. 2006;9:119–126. - PubMed
-
- Bannai S. Exchange of cystine and glutamate across plasma membrane of human fibroblasts. J Biol Chem. 1986;261:2256–2263. - PubMed
-
- Bannai S, Kitamura E. Transport interaction of L-cystine and L-glutamate in human diploid fibroblasts in culture. J Biol Chem. 1980;255:2372–2376. - PubMed
Publication types
MeSH terms
Substances
Grants and funding
LinkOut - more resources
Full Text Sources
Other Literature Sources
Molecular Biology Databases
