. 2014 Jun 15;5(11):3907-18.
doi: 10.18632/oncotarget.2028.

Mitophagy switches cell death from apoptosis to necrosis in NSCLC cells treated with oncolytic measles virus

Affiliations

Mitophagy switches cell death from apoptosis to necrosis in NSCLC cells treated with oncolytic measles virus

Mao Xia et al. Oncotarget. .

Abstract

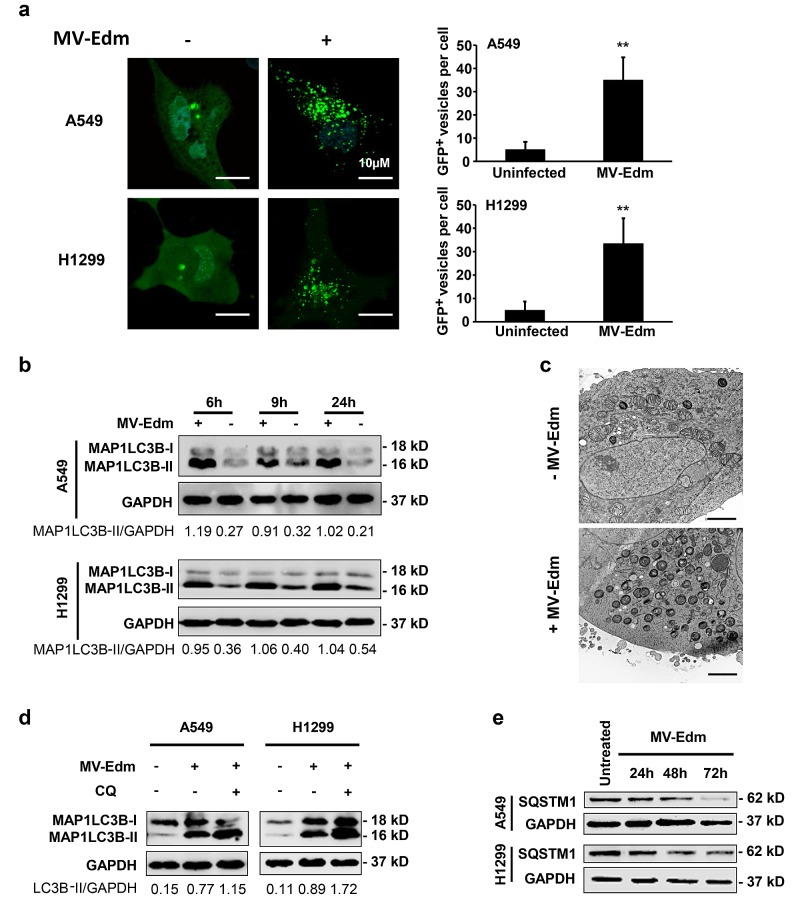
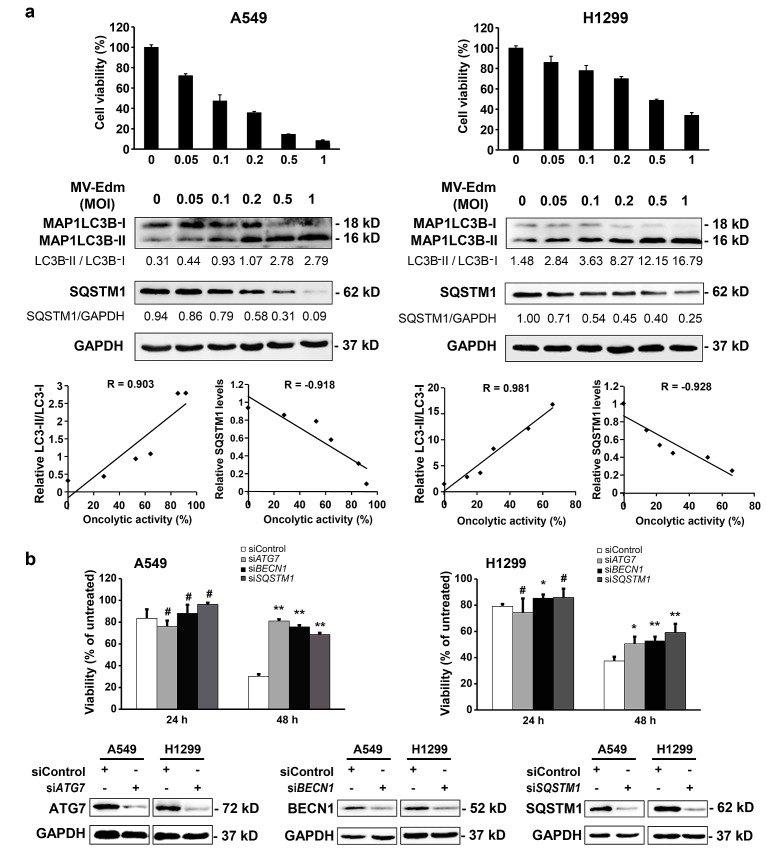
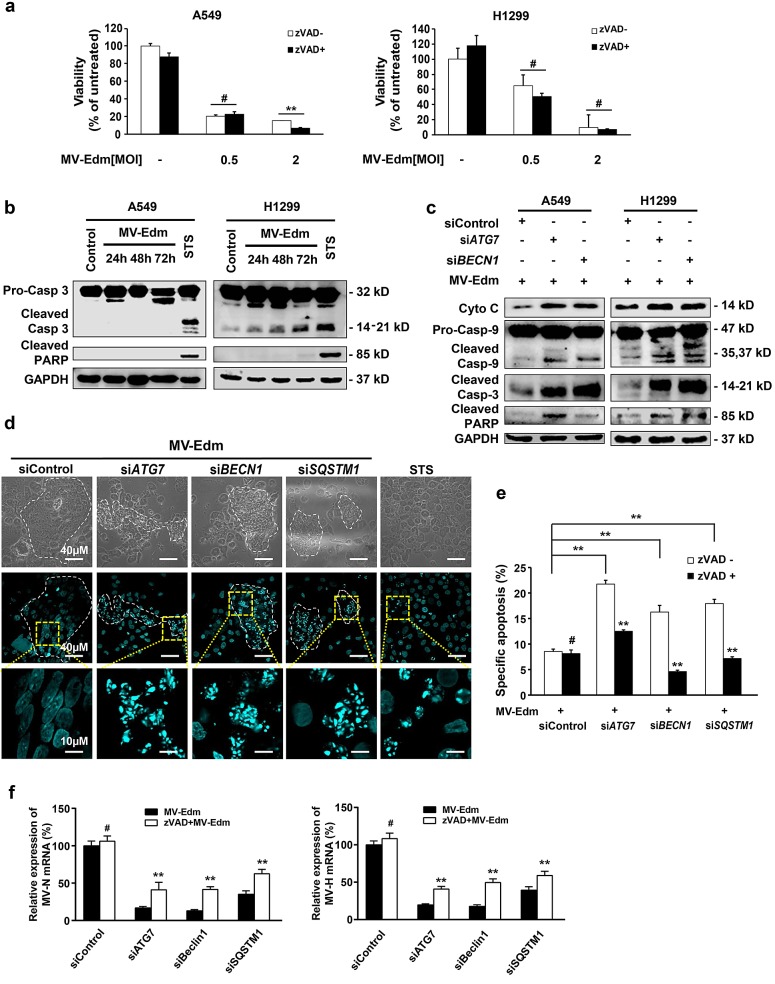
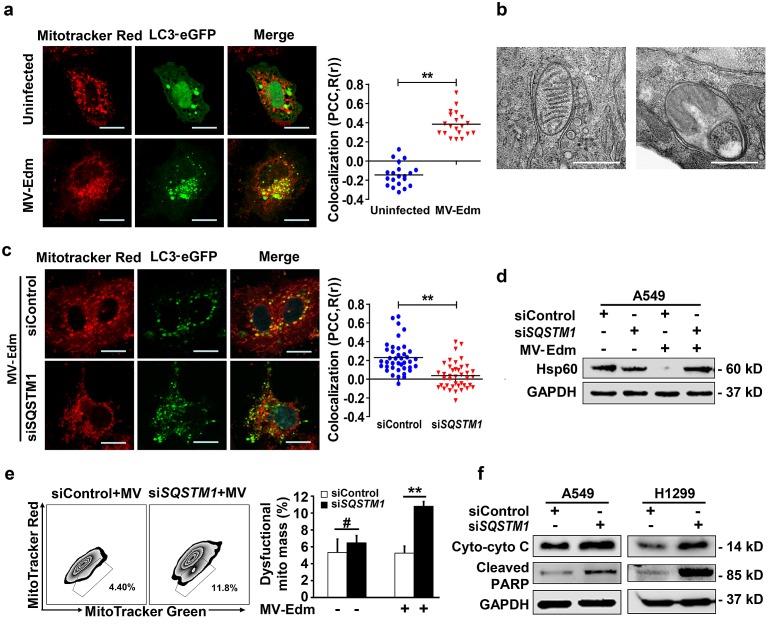
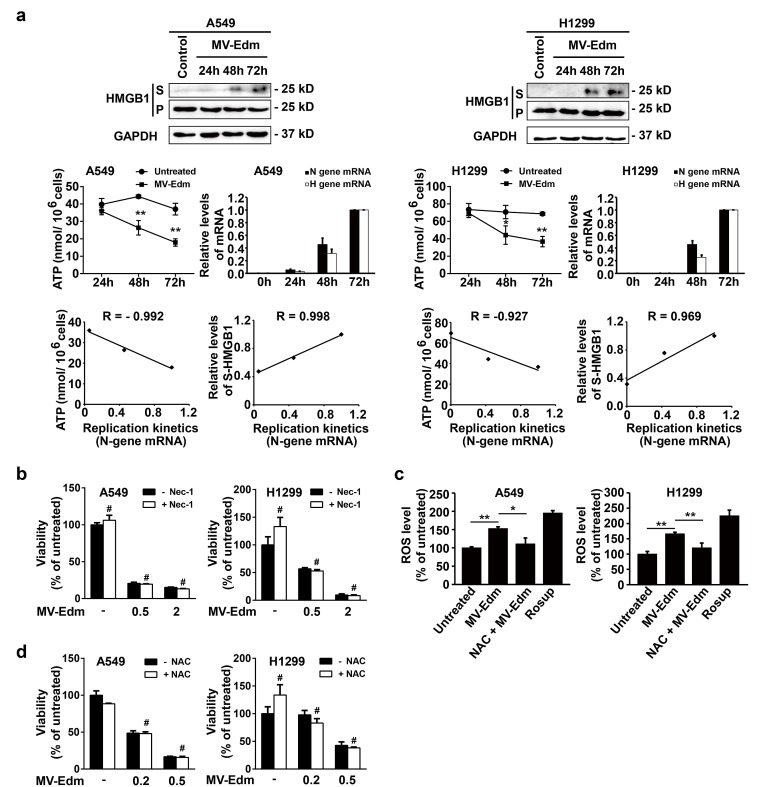
Although apoptotic phenomena have been observed in malignant cells infected by measles virus vaccine strain Edmonston B (MV-Edm), the precise oncolytic mechanisms are poorly defined. In this study we found that MV-Edm induced autophagy and sequestosome 1-mediated mitophagy leading to decreased cytochrome c release, which blocked the pro-apoptotic cascade in non-small cell lung cancer cells (NSCLCs). The decrease of apoptosis by mitophagy favored viral replication. Persistent viral replication sustained by autophagy ultimately resulted in necrotic cell death due to ATP depletion. Importantly, when autophagy was impaired in NSCLCs MV-Edm-induced cell death was significantly abrogated despite of increased apoptosis. Taken together, our results define a novel oncolytic mechanism by which mitophagy switches cell death from apoptosis to more efficient necrosis in NSCLCs following MV-Edm infection. This provides a foundation for future improvement of oncolytic virotherapy or antiviral therapy.


Conflict of interest statement

None of the authors have a financial interest to declare.

Figures

Figure 1
Figure 1. MV-Edm infection induces autophagy and preserves autophagic flux
(a) A549 and H1299 cells were transiently transfected with a plasmid encoding EGFP-LC3 for 24 h and further incubated for 6 h with or without MV-Edm (MOI = 0.5). Aggregation of EGFP-MAP1LC3B at autophagosomes was evaluated by fluorescence confocal microscopy. EGFP+ vesicles (green dots) of each cell represent autophagosomes (left panel) were quantified (right panel). Bars represent 10 μm. (b) Levels of lipidated MAP1LC3B were assessed by Western blot in lysates obtained from A549 and H1299 lung cancer cells infected with MV-Edm at a MOI of 0.5 or left uninfected for 6, 9 and 24 hours. Densitometry is shown as the ratio of MAP1LC3B-II to GAPDH. Similar results were obtained in three independent experiments. (c) A549 cells were infected with MV-Edm at a MOI of 1 for 24 h (lower panel), or left uninfected (upper panel). Cells were then subjected to electron microscopy for detection of autophagosomes. Double- or multilayered-structures with intracellular contents are shown in MV-Edm-infected. Bars represent 2 μm. (d) A549 and H1299 cells were infected with MV-Edm at a MOI of 0.5 for 4 h and grown in the absence or presence of chloroquine (CQ, 40 μM) for another 5 h before cell lysates were harvested for Western blot. Densitometry of MAP1LC3B lipidation is shown as the ratio of MAP1LC3B-II to GAPDH. Blots are representative of two independent experiments. (e) A549 and H1299 cells were infected with MV-Edm at a MOI of 0.5 for 24, 48 and 72 h. Cell lysates were then harvested for Western blot against SQSTM1. Representative blots from two independent experiments are shown. ** p < 0.01.
Figure 2
Figure 2. Autophagy contributes to MV-Edm-induced oncolysis
(a) A549 and H1299 cells were infected with MV-Edm at MOIs as indicated for 72 h. Cell death (upper panels) was measured by trypan-blue exclusion, MAP1LC3B-II conversion and SQSTM1 levels (middle panels) were determined by Western blot. Correlation between cell death and autophagy-related markers was analyzed by the Excel 2010 Analysis ToolPak (lower panels). R > 0.8 means strong correlation. Similar results were obtained in two independent experiments. (b) A549 and H1299 cells were transfected with siRNA targeting ATG7, BECN1, SQSTM1, or with non-targeting control siRNA for 24 h, and then infected with MV-Edm at a MOI of 0.5 for another 24 and 48 h, respectively. Cell death was quantified by trypan-blue exclusion (upper panel). Similar results were obtained in three independent experiments. Quality control of gene silencing was monitored by Western blot (lower panel). A representative result from two independent experiments is shown.
Figure 3
Figure 3. Autophagy protects NSCLCs from apoptosis leading to enhanced viral replication
(a) A549 and H1299 cells were infected with MV-Edm at a MOI of 0.5 or 2 in the absence or presence of a pan-caspase inhibitor z-VAD-fmk (80μM) for 72 h. Cell viability was quantified by trypan-blue exclusion. Means + SD of triplicates are shown. Similar results were obtained in three independent experiments. (b) A549 and H1299 cells were infected with MV-Edm at a MOI of 0.5 for 24, 48 and 72 h. Cell lysates were harvested for Western blot. Cell lysates from untreated and staurosporin (STS) treated cells were used as negative and positive controls, respectively. Representative blots from two independent experiments are shown. (c) Cytoplasmic cytochrome, cleaved caspase -9, -3 and PARP were evaluated by Western blotting cell lysates harvested from A549 and H1299 cells transfected with siRNAs targeting ATG7, BECN1 or non-specific control siRNA followed by MV-Edm infection at a MOI of 0.5 for 48 h. A representative result from two independent experiments is shown. (d) A549 cells were transfected with siRNA targeting ATG7, BECN1, SQSTM1, or with non-targeting control siRNA for 24 h followed by infection with MV-Edm (MOI = 0.5) for another 48 h. Cells were stained by DAPI before subjected to fluorescent confocal microscopy for evaluation of fragmented nuclei (blue spots). Cells treated with staurosporin (STS, 500 nM) for 12 h were used as a positive control. Scale bars represent 40 μm (upper two panels) and 10 μm (lower panel). Dashed white lines highlight multinucleated syncytia. (e) A549 cells were transfected with siRNA targeting ATG7, BECN1, SQSTM1, or with non-targeting control siRNA for 24 h followed by infection with MV-Edm (MOI = 0.5) in the presence or absence of zVAD (80 μM) for another 48 h. Cells were harvested and the specific apoptosis was analyzed by determining hypodiploid nuclei by FACS. Means + SD of triplicates are shown. Similar results were obtained in three independent experiments. (f) A549 cells were transfected with siRNAs targeting ATG7, BECN1, SQSTM1 or non-specific control siRNA for 24 h followed by infection with MV-Edm (MOI = 0.5) in the absence or presence of zVAD (80 μM) for another 48 h. Then the expression of N- and H-viral structural genes was quantified by qRT-PCR. Means + SD of triplicates are shown. Similar results were obtained in three independent experiments. # p > 0.05, * p < 0.05, ** p < 0.01.
Figure 4
Figure 4. MV-Edm induces mitophagy to control cytochrome C release in NSCLCs
(a) A549 cell were transiently transfected with a plasmid encoding EGFP-MAP1LC3B for 24 h and infected with MV-Edm at a MOI of 1 for another 12 h, or left uninfected. Cells were then stained with Mitotracker red and subjected to confocal microscopy. Scale bars represent 10 μm. Colocalization (yellow dots) of mitochondria (red) with autophagosomes (green puncta) was quantified by calculating Pearson's correlation coefficient (PCC, R(r)) (right panel). Means are shown (n = 30 of each). (b) Subcellular structures were analyzed by electron microscopy in cells infected with MV-Edm at a MOI of 1 for 24 h. Left panel shows a double-layered membrane engulfing a mitochondrion (early stage of mitophagy), and right panel shows a double-layered membrane containing a degraded mitochondrion (late stage of mitophagy). Bars represent 0.5 μm. ** indicates p < 0.01. (c) Colocalization of autophagosomes and mitochondria was quantified in A549 cells transfected with SQSTM1 siRNA for 24 h followed by transfection with pEGFP-Map1lc3b for another 24 h. Cells were then infected with MV-Edm at a MOI of 0.5 for 12 h and stained with Mitotracker Red before subjected to confocal microscopy (left panel). Scale bars represent 10 μm. Colocalization (yellow dots) of mitochondria (red) with autophagosomes (green puncta) was quantified by calculating Pearson's correlation coefficient (PCC, R(r)) (right panel). Means are shown (n = 30 of each). (D & E) A549 cells transfected with siRNA targeting SQSTM1, or a non-specific control siRNA for 24 h. Then cells were infected with MV-Edm at a MOI of 0.5 for another 48 h, or left uninfected. (d) The cell lysates were harvested and the mitochondrial HSPD1 (Hsp60) protein levels were determined by Western blot. A representative result from two independent experiments is shown. (e) Cells were incubated with mitotracker green and red before subjected to FACS analysis. Gated subpopulations depict damaged mitochondria (left panel). Percent of injured mitochondria was quantified (right panel). Means + SD of 3 independent experiments are shown. (f) A549 and H1299 cells were transfected with siRNA targeting SQSTM1 or non-specific control siRNA for 24 h, cells were then infected with MV-Edm at a MOI of 0.5 for another 48 h. Cytoplasmatic cytochrome c and cleaved PARP were evaluated by Western blot. A representative result from two independent experiments is shown. # p > 0.05, * p < 0.05, ** p < 0.01.
Figure 5
Figure 5. MV-Edm infection induces necrotic features in NSCLCs
(a) A549 and H1299 cells were infected with MV-Edm at a MOI of 0.5 for 24, 48 and 72 h. Supernatants (S) and cell pellets (P) were then harvested for determination of necrosis-related marker HMGB1 by Western blot (upper panel). Intracellular ATP levels were quantified by a luciferase based ATP kit and viral replication was quantified by qRT-PCR of viral structural N- and H-protein genes (middle panel). Correlations of MV-Edm replication (viral structural N protein genes) with ATP content, and with the HMGB1 were analyzed by the Excel 2010 Analysis ToolPak (lower panel). Similar results were obtained in two independent experiments. (b) A549 and H1299 cells were pretreated by the Rip-1 inhibitor necrostatin-1 (50 μM) for 1 h followed by infection with MV-Edm at a MOI of 0, 0.5 and 2 for another 48 h. Cell viability was quantified by trypan blue exclusion. Similar results were obtained in two independent experiments. (c) A549 and H1299 cells were infected with MV-Edm at a MOI of 0.5 in the presence or absence of 5 mM NAC for 6 h. Cells were then stained by DCFH-DA and subjected to flow cytometry for evaluation of ROS generation. Cells treated with Rosup for 20 minutes and untreated cells were used as positive and negative controls, respectively. (d) A549 and H1299 cells were infected with MV-Edm at a MOI of 0, 0.2 and 0.5 in the presence or absence 5 mM NAC for 48 h. Cell viability was determined by trypan blue exclusion. Means + SD of triplicates are shown. Similar results were obtained in three independent experiments. # p > 0.05, * p < 0.05, ** p < 0.01.

Similar articles

Cited by

References

    1. Russell SJ, Peng KW, Bell JC. Oncolytic virotherapy. Nat Biotechnol. 2012;30(7):658–670. - PMC - PubMed
    1. Russell SJ, Peng KW. Measles virus for cancer therapy. Current topics in microbiology and immunology. 2009;330:213–241. - PMC - PubMed
    1. Kroemer G, Galluzzi L, Vandenabeele P, Abrams J, Alnemri ES, Baehrecke EH, Blagosklonny MV, El-Deiry WS, Golstein P, Green DR, Hengartner M, Knight RA, Kumar S, Lipton SA, Malorni W, Nunez G, et al. Classification of cell death: recommendations of the Nomenclature Committee on Cell Death 2009. Cell Death Differ. 2009;16(1):3–11. - PMC - PubMed
    1. Ouyang L, Shi Z, Zhao S, Wang FT, Zhou TT, Liu B, Bao JK. Programmed cell death pathways in cancer: a review of apoptosis, autophagy and programmed necrosis. Cell Prolif. 2012;45(6):487–498. - PMC - PubMed
    1. Duprez L, Wirawan E, Vanden Berghe T, Vandenabeele P. Major cell death pathways at a glance. Microbes Infect. 2009;11(13):1050–1062. - PubMed

Publication types

MeSH terms

Substances