. 2013 Aug;60(8):1683-98.
doi: 10.1109/TUFFC.2013.2750.

Characterization of a multi-element clinical HIFU system using acoustic holography and nonlinear modeling

Characterization of a multi-element clinical HIFU system using acoustic holography and nonlinear modeling

Wayne Kreider et al. IEEE Trans Ultrason Ferroelectr Freq Control. 2013 Aug.

Abstract

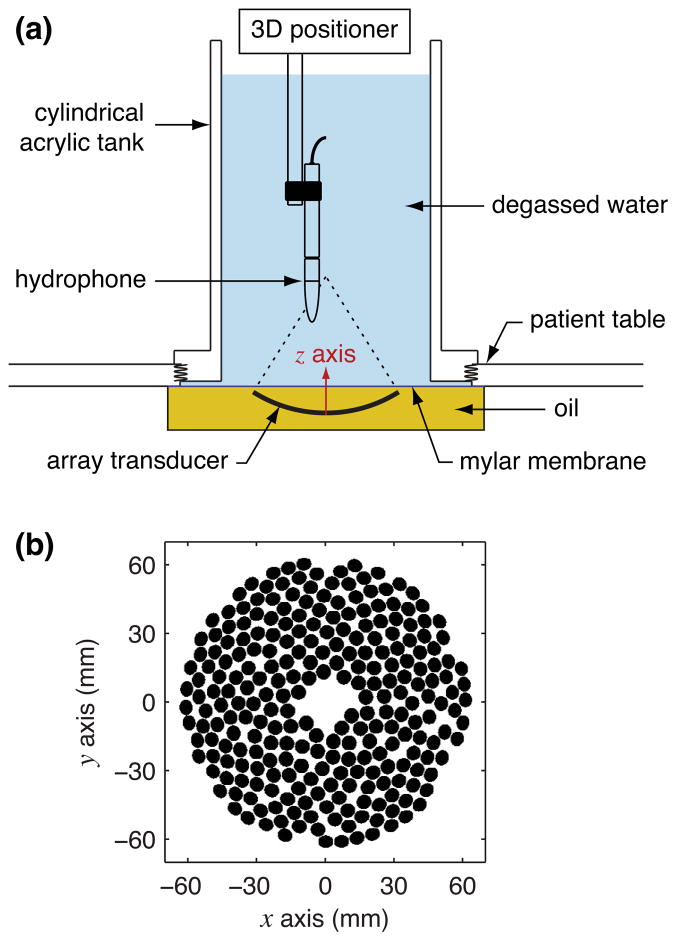
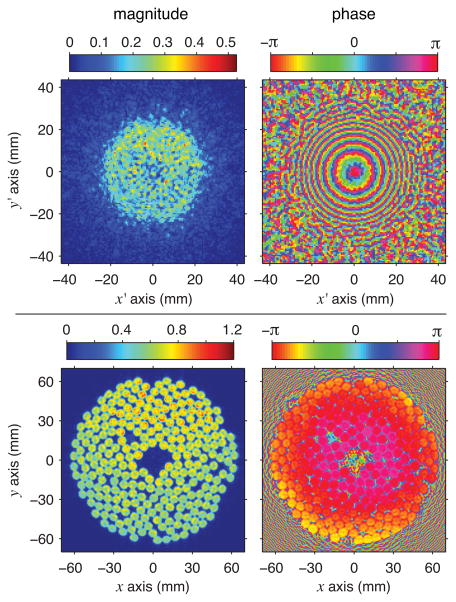
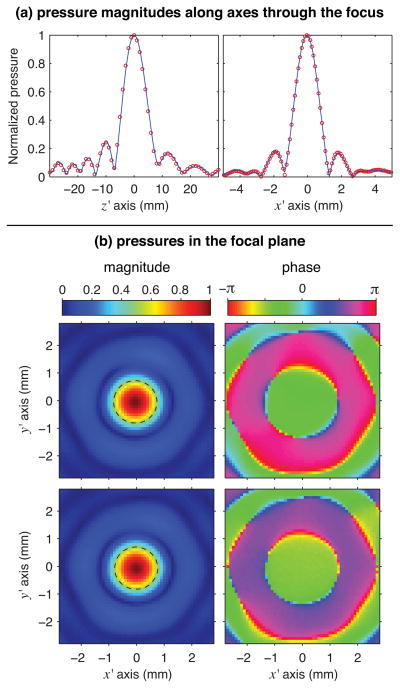
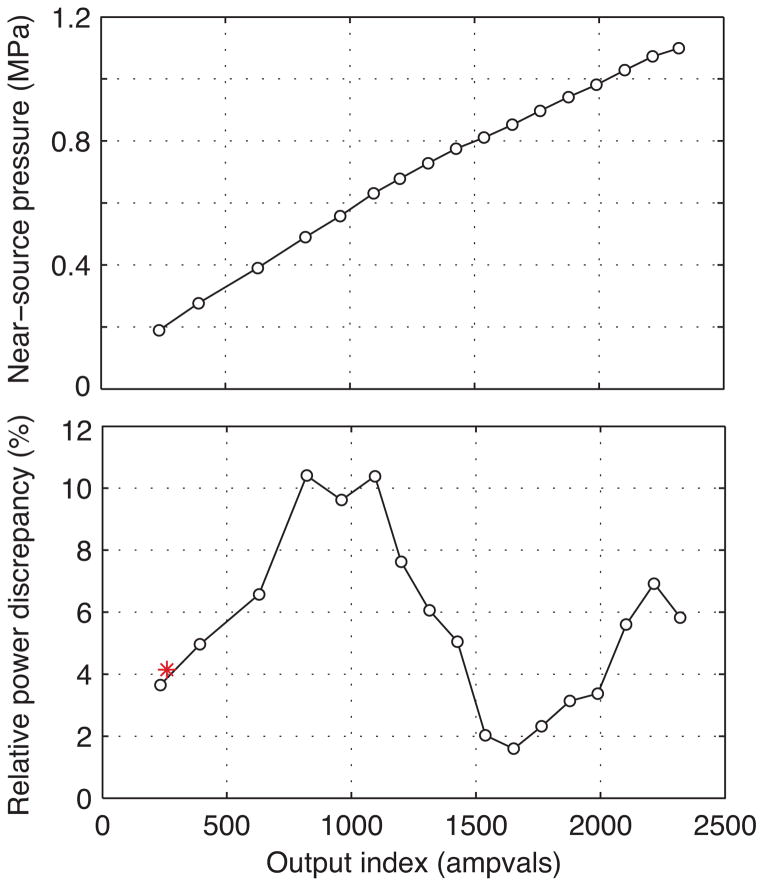
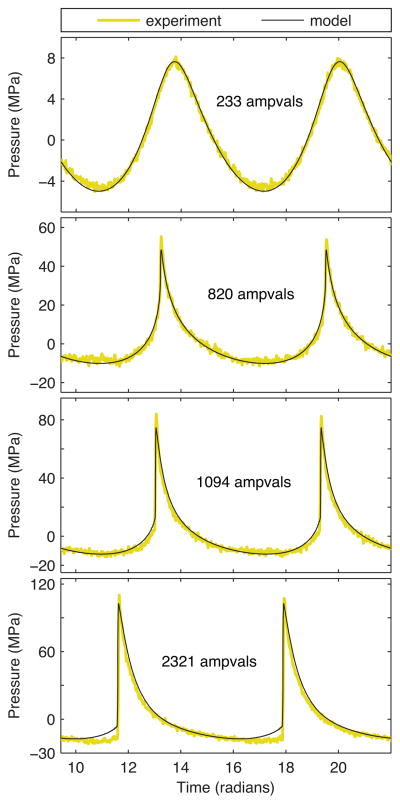
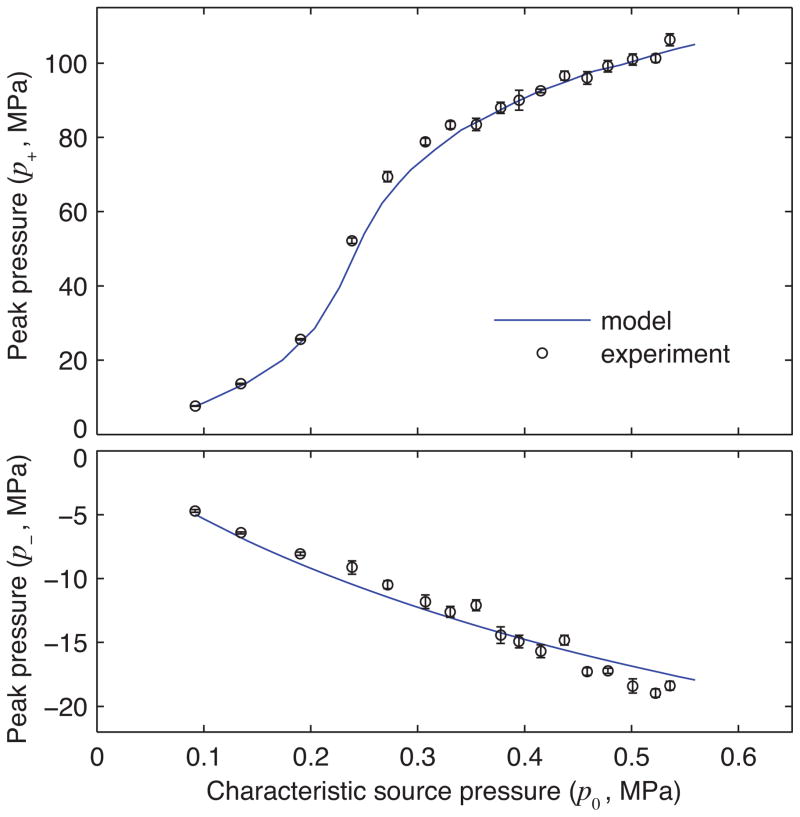
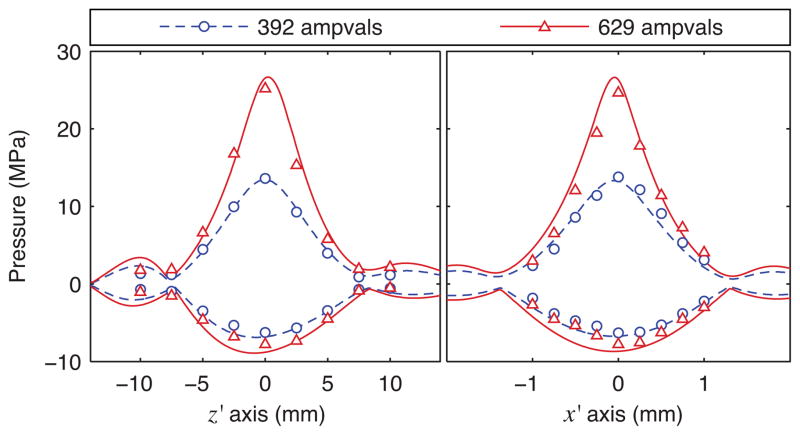
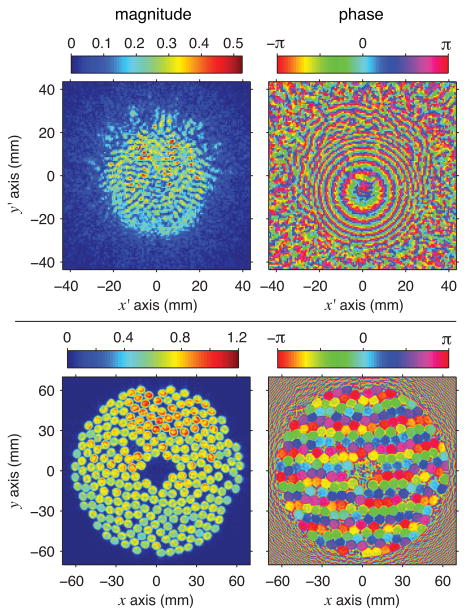
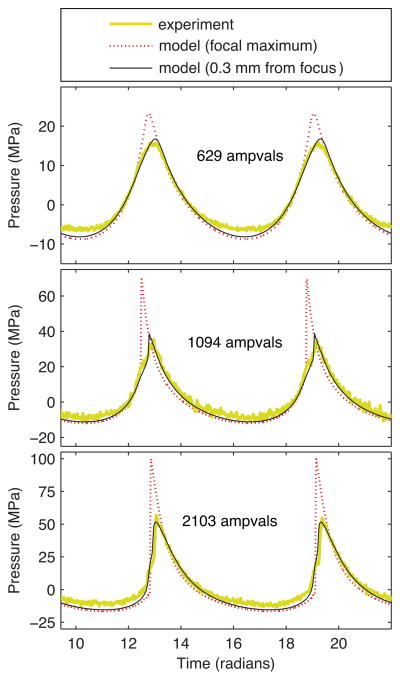
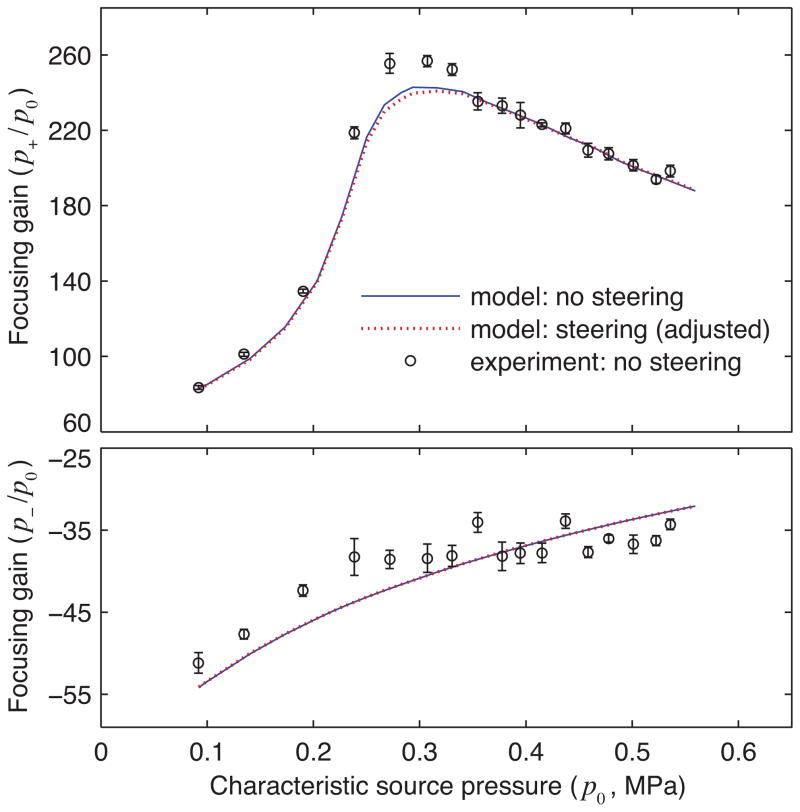
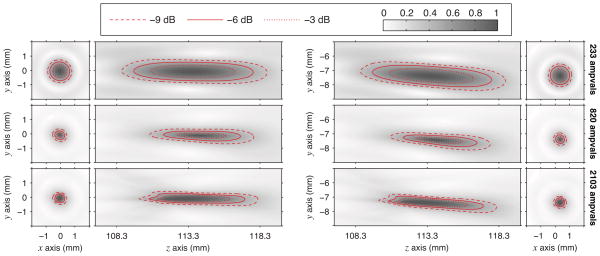
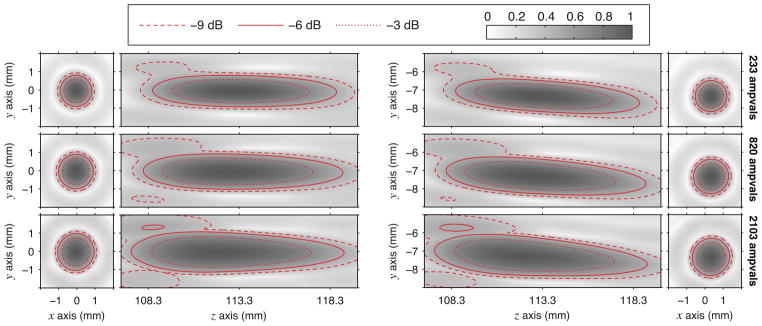
High-intensity focused ultrasound (HIFU) is a treatment modality that relies on the delivery of acoustic energy to remote tissue sites to induce thermal and/or mechanical tissue ablation. To ensure the safety and efficacy of this medical technology, standard approaches are needed for accurately characterizing the acoustic pressures generated by clinical ultrasound sources under operating conditions. Characterization of HIFU fields is complicated by nonlinear wave propagation and the complexity of phased-array transducers. Previous work has described aspects of an approach that combines measurements and modeling, and here we demonstrate this approach for a clinical phased-array transducer. First, low amplitude hydrophone measurements were performed in water over a scan plane between the array and the focus. Second, these measurements were used to holographically reconstruct the surface vibrations of the transducer and to set a boundary condition for a 3-D acoustic propagation model. Finally, nonlinear simulations of the acoustic field were carried out over a range of source power levels. Simulation results were compared with pressure waveforms measured directly by hydrophone at both low and high power levels, demonstrating that details of the acoustic field, including shock formation, are quantitatively predicted.


Figures

Fig. 1
Fig. 1
Schematics of the experimental arrangement (color online): (a) the measurement configuration with a custom tank mounted to the patient table, and (b) a 2-D projection of the mathematically defined element locations from the transducer design. Note that a transducer-aligned z-coordinate is shown in the top illustration, where z = 0 is defined at the inverted “apex” in the center of the transducer.
Fig. 2
Fig. 2
Holograms representing the continuous-wave linear acoustic field with no beam steering (color online): measured pressure hologram in megapascals (top) and source hologram calculated by backpropagating the acoustic field to the surface of the transducer (bottom). Note that the source hologram depicts acoustic velocity normal to the transducer surface, with magnitudes normalized relative to the maximum value.
Fig. 3
Fig. 3
Comparison of the structure of the linear acoustic field as measured directly with a capsule hydrophone and as calculated from a 2-D hologram measured separately (color online). (a) Along focal axes with coordinates plotted relative to the pressure maximum, calculated pressure magnitudes are shown as solid lines and independent measurement data as circles. (b) In the focal plane, pressure magnitude and phase are either calculated from a hologram measured pre-focally (top) or directly measured (bottom). The dashed line in each magnitude plot is a contour marking the −6 dB focal region.
Fig. 4
Fig. 4
Calibration of the acoustic power output of the array using a series of near-source pressure measurements at a single point (color online). Measured pressure (top) and relative difference between measured and nominal power levels normalized to the nominal level (bottom) are plotted as a function of the ampvals settings. Measured powers were determined by using single-point, near-source measurements to scale the power represented by a measured hologram at 259 ampvals (denoted by the asterisk); nominal powers were specified by Philips. Selected values are listed in Table I.
Fig. 5
Fig. 5
Comparison of focal waveforms with no beam steering (color online). Experimental waveforms were measured directly with a fiber optic hydrophone. Simulated waveforms utilized boundary conditions defined by calibration measurements for the power level (Fig. 4 and Table I) in combination with a source vibration pattern based on the source hologram (Fig. 2).
Fig. 6
Fig. 6
Summary of waveform comparisons between simulations and measurements with no beam steering (color online): peak positive (top) and negative (bottom) pressures at the focus are plotted against the source pressure output. Experimental peak values are represented as a mean value ± one standard deviation over 8 acoustic cycles.
Fig. 7
Fig. 7
Beam profiles along axes passing through the focus (no beam steering) (color online). The dashed and solid lines represent the peak positive and peak negative pressures based on modeled waveforms. The circles and triangles represent experimental data. In each plot, data for two power levels are included, where 392 and 629 ampvals correspond to nominal acoustic powers of 50 and 100 W respectively.
Fig. 8
Fig. 8
Holograms representing the continuous-wave linear acoustic field with beam steering -8 mm in the y direction (color online): measured pressure hologram in megapascals (top) and source hologram calculated by backpropagation (bottom). The source hologram depicts acoustic velocity normal to the transducer surface, with magnitudes normalized to the maximum in the no-steering case for direct comparison to Fig. 2.
Fig. 9
Fig. 9
Comparison of focal waveforms for the steering case (color online). Experimental waveforms were measured directly with a fiber optic hydrophone, while simulated waveforms utilized boundary conditions determined by the source hologram from Fig. 8 and power levels described by holography units from the fifth column in Table I. For model simulations, the focal maximum occurred at y = −7.4 mm, while waveforms at y = −7.7 mm approximately match the experimental data.
Fig. 10
Fig. 10
Focal gains determined from both direct FOPH measurements and modeling (color online). The data shown in Fig. 6 are included along with steering simulations. Peak pressures at the focus are normalized to the corresponding nominal source pressure p0 for no-steering case. Note that the adjusted p0 was used in the boundary conditions for the steering case to account for the increased output level required to achieve the same linear focal pressure as measured without steering.
Fig. 11
Fig. 11
From simulations without steering (left column) and with steering (right column), peak positive pressures in an axial plane through the focus are plotted at three different power levels (color online). Each plot depicts values normalized to the maximum as a grayscale intensity, while three contour lines are added for clarity. Steering simulations utilized the same adjusted source pressures as in Fig. 10.
Fig. 12
Fig. 12
A corollary to Fig. 11 for negative pressures (color online).

References

    1. Kremkau FW. Sonography Principles and Instruments. 8. St. Louis, MO: Saunders; 2011.
    1. Hill CR, Bamber JC, ter Haar G, editors. Physical Principles of Medical Ultrasonics. 2. West Sussex, UK: John Wiley & Sons; 2004.
    1. Rassweiler JJ, Knoll T, Koehrmann KU, McAteer JA, Lingeman JE, Cleveland RO, Bailey MR, Chaussy C. Shock wave technology and application: an update. Eur Urol. 2011;59(5):784–796. - PMC - PubMed
    1. Bailey MR, Khokhlova VA, Sapozhnikov OA, Kargl SG, Crum LA. Physical mechanisms of the therapeutic effect of ultrasound - (A review) Acoust Phys. 2003;49(4):369–388.
    1. Xu Z, Hall TL, Fowlkes JB, Cain CA. Effects of acoustic parameters on bubble cloud dynamics in ultrasound tissue erosion (histotripsy) J Acoust Soc Am. 2007;122(1):229–236. - PMC - PubMed

Publication types