. 2014 Jul 9:14:495.
doi: 10.1186/1471-2407-14-495.

Epigenetic silencing of genes and microRNAs within the imprinted Dlk1-Dio3 region at human chromosome 14.32 in giant cell tumor of bone

Affiliations

Epigenetic silencing of genes and microRNAs within the imprinted Dlk1-Dio3 region at human chromosome 14.32 in giant cell tumor of bone

Burkhard Lehner et al. BMC Cancer. .

Abstract

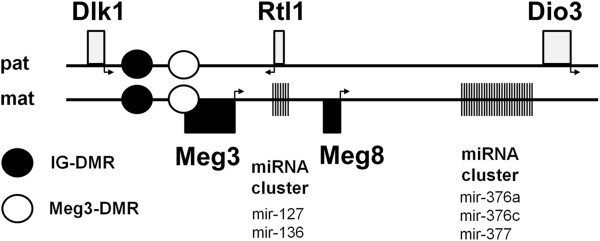
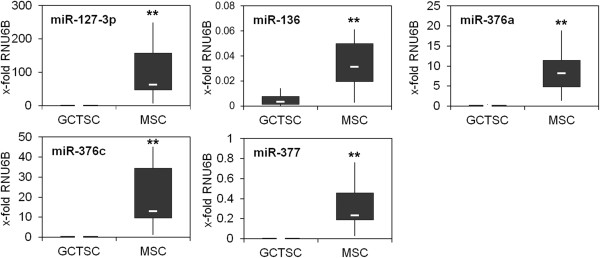
Background: Growing evidence exists that the neoplastic stromal cell population (GCTSC) within giant cell tumors (GCT) originates from mesenchymal stem cells (MSC). In a previous study we identified a microRNA signature that differentiates between these cell types. Five differentially expressed microRNAs are located within the Dlk1-Dio3 region on chromosome 14. Aberrant regulation within this region is known to influence cell growth, differentiation and the development of cancer. The aim of this study was to elucidate the involvement of deregulations within the Dlk1-Dio3 region in GCT pathogenesis.

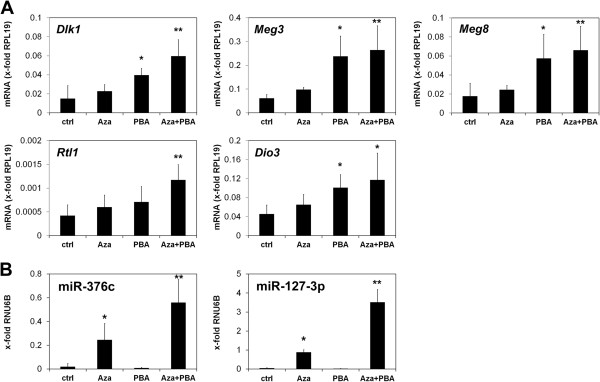
Methods: Quantitative gene and microRNA expression analyses were performed on GCTSCs and MSCs with or without treatment with epigenetic modifiers. Methylation analysis of differentially methylated regions was performed by bisulfite sequencing.

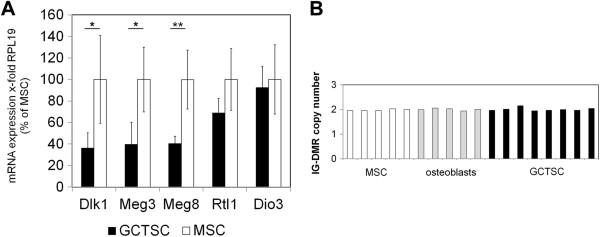
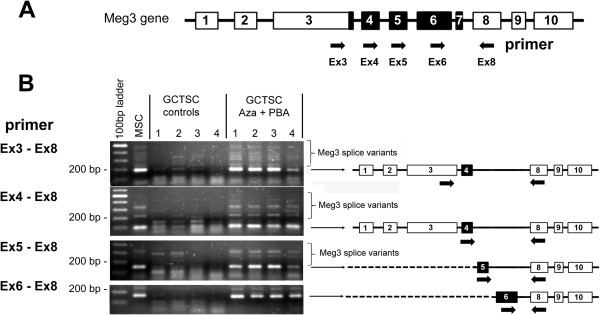
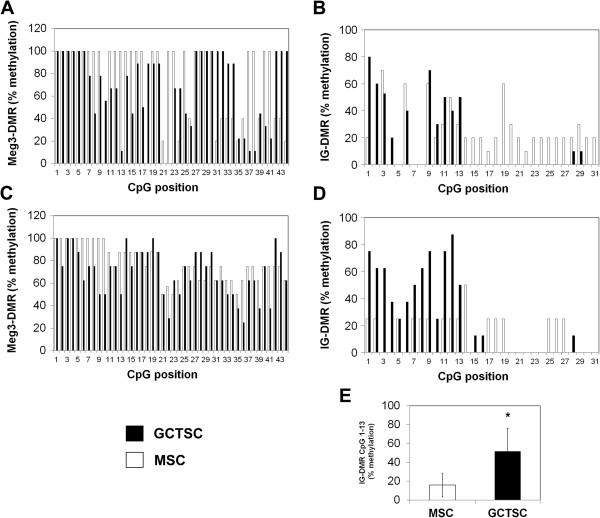
Results: In addition to microRNA silencing we detected a significant downregulation of Dlk1, Meg3 and Meg8 in GCTSCs compared to MSCs. DNA methylation analyses of the Meg3-DMR and IG-DMR revealed a frequent hypermethylation within the IG-DMR in GCTs. Epigenetic modification could restore expression of some but not all analyzed genes and microRNAs suggesting further regulatory mechanisms.

Conclusion: Epigenetic silencing of genes and microRNAs within the Dlk1-Dio3 region is a common event in GCTSCs, in part mediated by hypermethylation within the IG-DMR. The identified genes, micro RNAs and microRNA target genes might be valuable targets for the development of improved strategies for GCT diagnosis and therapy.


Figures

Figure 1
Figure 1
Schematic illustration of the Dlk1-Dio3 locus on human chromosome 14q32. The location of the noncoding maternally expressed genes Meg3 and Meg8, the paternally expressed genes Dlk1, Rtl1 and Dio3, the differentially methylated regions (DMRs) and the position of the microRNA clusters are indicated.
Figure 2
Figure 2
Silencing of specific microRNAs in GCTSCs. Total RNA including microRNAs was extracted from cultured GCTSCs (n = 10) and MSCs (n = 10) and expression of microRNAs was quantified relative to the expression of the small nuclear RNA RNU6B. The white lines indicate the median, the lower and upper boundaries of the box indicate the 25th and 75th percentile. The whiskers indicate the highest and lowest values. (**p < 0.01 determined by Mann–Whitney-U test).
Figure 3
Figure 3
Significant downregulation of Dlk1, Meg3 and Meg8 in GCTSCs. (A) Expression of Dlk1, Meg3, Meg8, Rtl1 and Dio3 was analyzed by RT-qPCR in GCTSCs (n = 5) and MSCs (n = 5). Data were normalized on the basis of the ribosomal protein L19 (RPL19) expression in the corresponding sample. Data are presented as mean ± SD. (*p < 0.05 **p < 0.01 determined by Mann–Whitney-U test). (B) IG-DMR copy number assay. The IG-DMR copy number was determined by RT-qPCR in MSCs, GCTSCs and osteoblasts and calculated using the genomic RNAse P region as reference.
Figure 4
Figure 4
Restoration of gene and microRNA expression in GCTSCs after treatment with epigenetic modifiers. GCTSCs (n = 5) and MSCs (n = 5) were cultured in medium containing 10 μM 5-Aza-2′-deoxycytidine (Aza), 3 mM phenylbutyric acid (PBA) or both for 10 days. (A) Expression of Dlk1, Meg3, Meg8, Rtl1 and Dio3 normalized to the RPL19 expression in the corresponding sample. (B) Expression of miR-127-3p andmiR-376c normalized to the RNU6B expression in the corresponding sample. Data are presented as mean ± SD. (*p < 0.05 **p < 0.01 compared to untreated control cells determined by Mann–Whitney-U test).
Figure 5
Figure 5
Identification of Meg3 splice variants. (A) Schematic illustration of the Meg3 gene exon structure. Exons found in all Meg3 isoforms are shown in white, variable exons are shown in black. The location of the primers used to detect the different Meg3 isoforms are marked by arrows. (B) GCTSCs were cultured with or without the addition of Aza and PBA before Meg3 splice variants were amplified by PCR using primers located in different exons. PCR products were separated on a 1.6% agarose gel. Untreated MSCs served as controls. The structure of the main transcript is indicated. Additional splice variants appear as larger transcripts above the main product.
Figure 6
Figure 6
Identification of a hypermethylated region within the IG-DMR of GCTSCs. Cellular DNA was extracted from GCTSCs (n = 8) and MSCs (n = 8) and DNA fragments covering the Meg3-DMR (44 CpGs) and the IG-DMR (31 CpGs) were amplified by PCR, bisulfite treated, cloned into pCR4-TOPO vector and sequenced. (A, B) Calculated methylation frequencies of all analyzed CpGs within the Meg3-DMR and the IG-DMR of 10 individual clones derived from one GCTSC and one MSC cell line. (C, D) Calculated methylation frequencies within the Meg3-DMR and the IG-DMR of eight different GCTSC and MSC cell lines. (E) Methylation analysis restricted to the first 13 CpGs analyzed within the IG-DMR. Data are presented as mean ± SD. (*p < 0.05 determined by Mann–Whitney-U test).

Similar articles

Cited by

References

    1. Gupta R, Seethalakshmi V, Jambhekar NA, Prabhudesai S, Merchant N, Puri A, Agarwal M. Clinicopathologic profile of 470 giant cell tumors of bone from a cancer hospital in western India. Ann Diagn Pathol. 2008;12:239–248. - PubMed
    1. Wulling M, Engels C, Jesse N, Werner M, Delling G, Kaiser E. The nature of giant cell tumor of bone. J Cancer Res Clin Oncol. 2001;127:467–474. - PubMed
    1. Gamberi G, Benassi MS, Bohling T, Ragazzini P, Molendini L, Sollazzo MR, Merli M, Ferrari C, Magagnoli G, Bertoni F, Picci P. Prognostic relevance of C-myc gene expression in giant-cell tumor of bone. J Orthop Res. 1998;16:1–7. - PubMed
    1. Osaka S, Toriyama M, Taira K, Sano S, Saotome K. Analysis of giant cell tumor of bone with pulmonary metastases. Clin Orthop Relat Res. 1997;335:253–261. - PubMed
    1. Capanna R, Fabbri N, Bettelli G. Curettage of giant cell tumor of bone. The effect of surgical technique and adjuvants on local recurrence rate. Chir Organi Mov. 1990;75:206. - PubMed

Publication types