Review
doi: 10.1107/S2053230X1401262X.
Epub 2014 Jun 27.
Crystallization screening: the influence of history on current practice
Affiliations
- PMID: 25005076
- PMCID: PMC4089519
- DOI: 10.1107/S2053230X1401262X
Item in Clipboard
Review
Crystallization screening: the influence of history on current practice
Acta Crystallogr F Struct Biol Commun.
2014 Jul.
Abstract
While crystallization historically predates crystallography, it is a critical step for the crystallographic process. The rich history of crystallization and how that history influences current practices is described. The tremendous impact of crystallization screens on the field is discussed.
Keywords: crystallization screening.
Figures

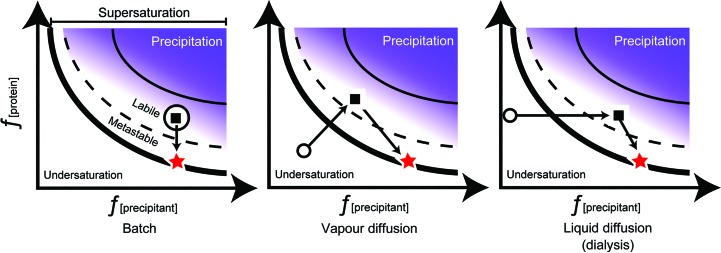
A simplified phase diagram for the crystallization of proteins. The phase diagram shows a concentration of protein versus a concentration of precipitant. The precipitant could be any chemical or physical variable that affects protein solubility. The undersaturated region is both kinetically and thermodynamically incapable of supporting crystal nucleation or growth. The thick boundary between undersaturation and the metastable region represents the saturation point of the protein. This is the endpoint after full equilibration of an experiment that produces a crystal. At saturation the crystal is in a state of dynamic equilibrium with the surrounding solution, which will always contain some protein. This saturation boundary has been measured in the laboratory for a small number of proteins; a selection of these are named in §1. The supersaturated regions are shown above the saturation boundary. The metastable zone is thermodynamically, but not kinetically, able to support spontaneous homogeneous nucleation events. The solution will remain clear. If a nucleant is introduced into a metastable solution, it can support growth of the crystal. The next highest level of supersaturation, the labile zone, is sufficiently supersaturated for spontaneous homogeneous nucleation. If the experiment is closer to the metastable zone, fewer nucleation events are likely to occur before entering the metastable zone. If the experiment is closer to the precipitation zone then a greater number of nucleation events are likely. The precipitation zone is many times supersaturated with respect to crystallization. Boundaries are shown between the metastable and labile zones, when in fact these boundaries only represent probabilities and, owing to the stochastic nature of the process, there can be overlap. Note that while only two axes are shown, multiple variables govern the solubility and the representation shown can be taken as only a slice through a complex multi-dimensional space.
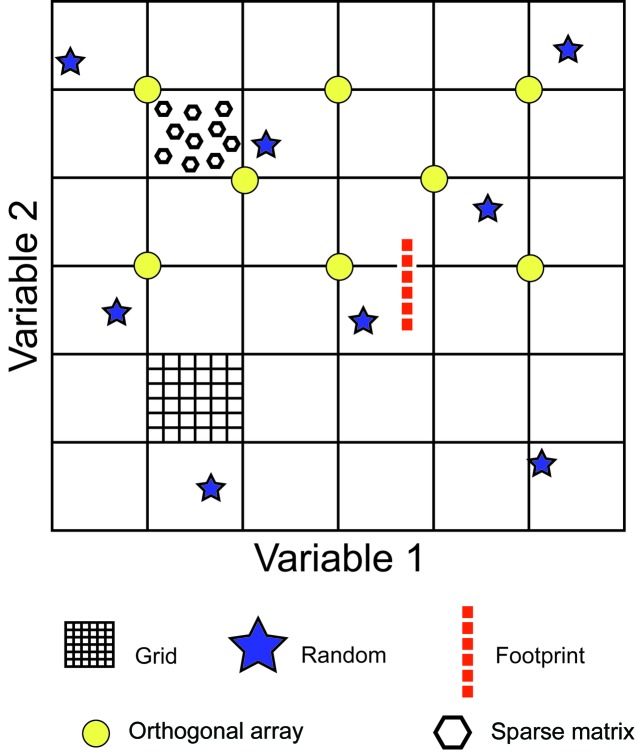
Idealized phase diagrams showing the trajectories of three different crystallization methods. From right to left, thermodynamic representations of batch, vapour-diffusion and liquid-diffusion (dialysis) experimental approaches to supersaturation, crystal formation and equilibrium (saturation). The open circle is the starting point of the experiment, the black square is the point of spontaneous homogeneous nucleation and the red star is the equilibrium point of the crystal. For batch experiments, the successful experiment is set up at labile supersaturation. A nucleation event takes place and protein in solution undergoes a phase change to the solid (crystalline) form. Equilibrium is reached when the protein in the surrounding solution reaches a state of saturation with the solid (crystal) phase. In the vapour-diffusion experiment, the initial drop conditions are undersaturated. As the drop dehydrates, typically through a dynamic equilibrium with the reservoir solution, the relative concentration of the protein and precipitant will steadily increase until the drop reaches a metastable state that will kinetically and thermodynamically support spontaneous homogeneous nucleation. The drop will typically further dehydrate as it equilibrates with the reservoir solution and the crystal will pass through the metastable zone; here it will grow to a larger size, but the solution will not be sufficiently supersaturated to support nucleation events. The drop reaches a saturation point when the drop and reservoir have equilibrated with respect to the vapour pressure of water, and the protein in the drop is in a dynamic equilibrium between the liquid and solid (crystalline) phase. The final example shows a liquid-diffusion experiment, in this case dialysis. The protein solution is held at a fixed volume. As precipitant passes through the semi-permeable dialysis membrane, the concentration of the precipitant will continue to increase while the protein concentration remains constant. When the solution reaches a metastable state then the protein will form a solid phase (crystalline). At this point, the concentration of the protein in the solution will decrease as protein transitions from a liquid to a solid phase. Saturation is reached when the solid and liquid phases have reached a state of dynamic equilibrium.
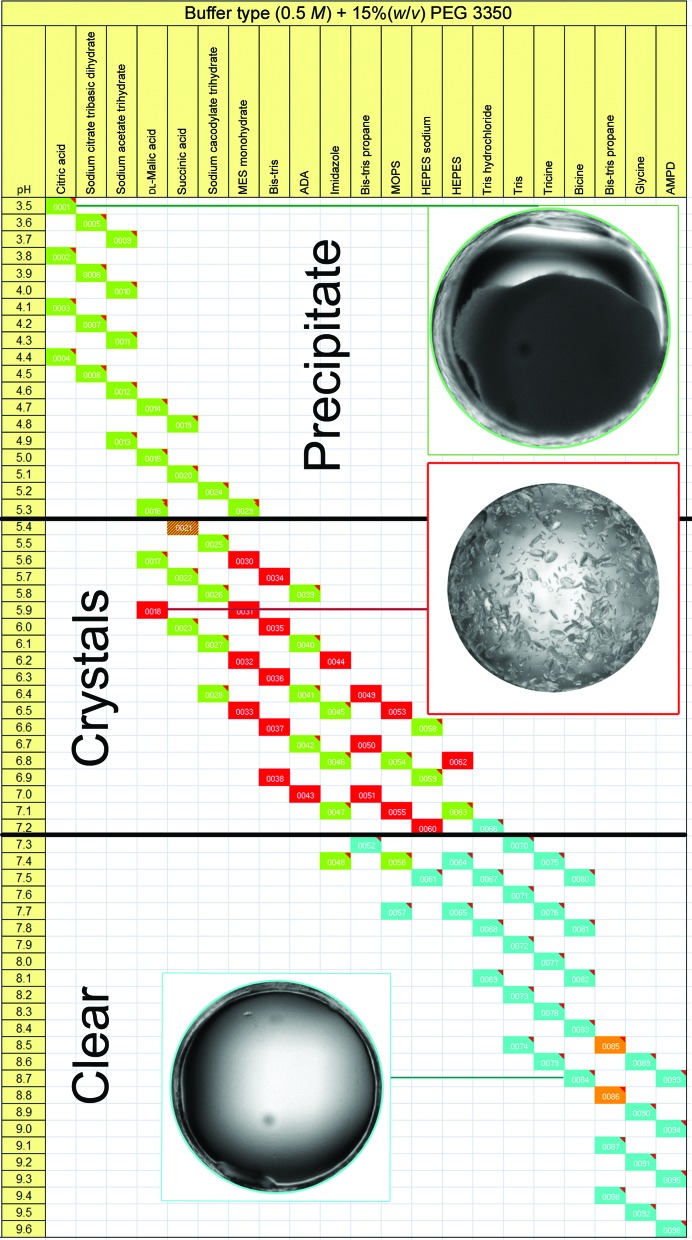
Sampling of variables in two dimensions. Random sampling (blue stars) is considered to be among the best approaches for crystallization success. While random sampling covers a broad range of parameter space, sparse-matrix sampling (white hexagons) is a random screen that focuses on variables known to have had past success. An orthogonal array (yellow circles) is a symmetric sampling of random space. Footprint screen (orange squares) sampling begins by incrementally searching in a narrow range of variables. Adapted from Segelke (2001 ▶).
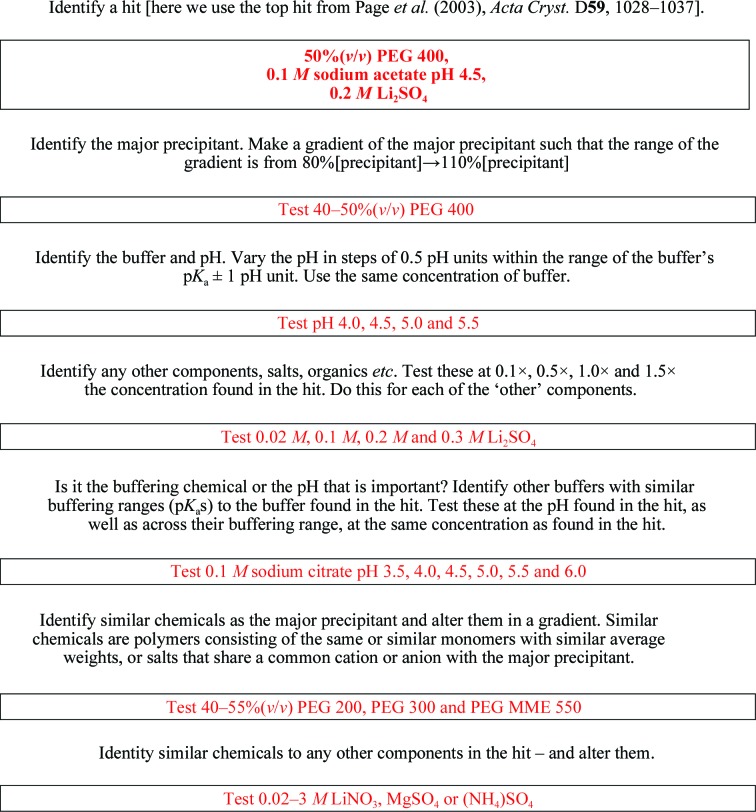
Chemical space layout of a pH/buffer-type screen. This clearly illustrates cases where having an identical chemical buffer at different pH and vice versa can alter the outcome of an experiment. Analysis of a putative glutathione-dependent formaldehyde-activating enzyme, pI = 6.88, with the Hampton Research Slice pH screen modified for microbatch with the addition of 15%(w/v) PEG 3350 and buffer concentrations of 0.5 M. Acidic pH produced heavy precipitate (green) in the range 3.5 ≤ pH ≤ 5.3. In the pH range 5.4 ≤ pH ≤ 7.2 crystals (red) or precipitates (green) formed depending on the pH and the chemistry. Mainly clear drops (blue) were formed in the range 7.3 ≤ pH ≤ 9.6. This screen very effectively distinguishes buffer pH from buffer-type effects on crystallization. The diameter of the circle is 0.9 mm.
Optimization flowchart. This flowchart illustrates the case described in the text where an initial crystallization condition of 50%(v/v) PEG 400, 0.2 M lithium sulfate, 0.1 M sodium acetate pH 4.5 is used as a starting point to optimize crystals, presumably for diffraction analysis.
Similar articles
-
Gently does it.Science. 2014 Mar 7;343(6175):1094-7. doi: 10.1126/science.343.6175.1094. Science. 2014. PMID: 24604192 No abstract available.
-
The China connection: Michael Rossmann and his first encounter with me.Protein Cell. 2010 Jan;1(1):6-8. doi: 10.1007/s13238-010-0001-6. Protein Cell. 2010. PMID: 21203992 Free PMC article. No abstract available.
-
Dazzling history.Science. 2014 Mar 7;343(6175):1092-3. doi: 10.1126/science.343.6175.1092. Science. 2014. PMID: 24604191 No abstract available.
-
Protein Crystallization.Methods Mol Biol. 2017;1607:17-50. doi: 10.1007/978-1-4939-7000-1_2. Methods Mol Biol. 2017. PMID: 28573568 Review.
-
Practical macromolecular cryocrystallography.Acta Crystallogr F Struct Biol Commun. 2015 Jun;71(Pt 6):622-42. doi: 10.1107/S2053230X15008304. Epub 2015 May 27. Acta Crystallogr F Struct Biol Commun. 2015. PMID: 26057787 Free PMC article. Review.
Cited by
-
X-Ray Crystallographic Studies for Revealing Binding Sites of General Anesthetics in Pentameric Ligand-Gated Ion Channels.Methods Enzymol. 2018;603:21-47. doi: 10.1016/bs.mie.2018.01.017. Epub 2018 Mar 24. Methods Enzymol. 2018. PMID: 29673527 Free PMC article.
-
A crystallization apparatus for temperature-controlled flow-cell dialysis with real-time visualization.J Appl Crystallogr. 2016 Apr 22;49(Pt 3):806-813. doi: 10.1107/S1600576716004635. eCollection 2016 Jun 1. J Appl Crystallogr. 2016. PMID: 27275137 Free PMC article.
-
Design of Experiments As a Tool for Optimization in Recombinant Protein Biotechnology: From Constructs to Crystals.Mol Biotechnol. 2019 Dec;61(12):873-891. doi: 10.1007/s12033-019-00218-x. Mol Biotechnol. 2019. PMID: 31664704 Review.
-
The MORPHEUS II protein crystallization screen.Acta Crystallogr F Struct Biol Commun. 2015 Jul;71(Pt 7):831-7. doi: 10.1107/S2053230X1500967X. Epub 2015 Jun 27. Acta Crystallogr F Struct Biol Commun. 2015. PMID: 26144227 Free PMC article.
-
A simple technique to reduce evaporation of crystallization droplets by using plate lids with apertures for adding liquids.Acta Crystallogr F Struct Biol Commun. 2014 Dec 1;70(Pt 12):1707-13. doi: 10.1107/S2053230X14025126. Epub 2014 Nov 28. Acta Crystallogr F Struct Biol Commun. 2014. PMID: 25484231 Free PMC article.
References
-
- Asherie, N. (2004). Protein crystallization and phase diagrams. Methods, 34, 266–272. - PubMed
-
- Asherie, N., Ginsberg, C., Blass, S., Greenbaum, A. & Knafo, S. (2008). Solubility of thaumatin. Cryst. Growth Des. 8, 1815–1817.
-
- Ataka, M., Shinzawa-Itoh, K. & Yoshikawa, S. (1992). Phase diagrams of a crystalline membrane protein, bovine heart cytochrome c oxidase, in the salting-in region. J. Cryst. Growth, 122, 60–65.
-
- Ataka, M. & Tanaka, S. (1986). The growth of large single crystals of lysozyme. Biopolymers, 25, 337–350. - PubMed
-
- Atha, D. H. & Ingham, K. C. (1981). Mechanism of precipitation of proteins by polyethylene glycols. Analysis in terms of excluded volume. J. Biol. Chem. 256, 12108–12117. - PubMed
Publication types
MeSH terms
Substances
Grants and funding
LinkOut - more resources
Full Text Sources
Other Literature Sources