. 2014 Jul;141(14):2770-9.
doi: 10.1242/dev.108910.

Stochastic NANOG fluctuations allow mouse embryonic stem cells to explore pluripotency

Affiliations

Stochastic NANOG fluctuations allow mouse embryonic stem cells to explore pluripotency

Elsa Abranches et al. Development. 2014 Jul.

Abstract

Heterogeneous expression of the transcription factor NANOG has been linked to the existence of various functional states in pluripotent stem cells. This heterogeneity seems to arise from fluctuations of Nanog expression in individual cells, but a thorough characterization of these fluctuations and their impact on the pluripotent state is still lacking. Here, we have used a novel fluorescent reporter to investigate the temporal dynamics of NANOG expression in mouse embryonic stem cells (mESCs), and to dissect the lineage potential of mESCs at different NANOG states. Our results show that stochastic NANOG fluctuations are widespread in mESCs, with essentially all expressing cells showing fluctuations in NANOG levels, even when cultured in ground-state conditions (2i media). We further show that fluctuations have similar kinetics when mESCs are cultured in standard conditions (serum plus leukemia inhibitory factor) or ground-state conditions, implying that NANOG fluctuations are inherent to the pluripotent state. We have then compared the developmental potential of low-NANOG and high-NANOG mESCs, grown in different conditions, and confirm that mESCs are more susceptible to enter differentiation at the low-NANOG state. Further analysis by gene expression profiling reveals that low-NANOG cells have marked expression of lineage-affiliated genes, with variable profiles according to the signalling environment. By contrast, high-NANOG cells show a more stable expression profile in different environments, with minimal expression of lineage markers. Altogether, our data support a model in which stochastic NANOG fluctuations provide opportunities for mESCs to explore multiple lineage options, modulating their probability to change functional state.

Keywords: Gene expression heterogeneity; Lineage priming; Nanog; Pluripotency; Stem cells.


Figures

Fig. 1.
Fig. 1.
Time-lapse imaging of Nd cells grown in serum/LIF or 2i/LIF conditions. (A) Kinetics of Nanog:VNP expression in 37 mESCs grown in serum/LIF and 49 mESCs grown in 2i/LIF. For each individual cell, the range of fluorescence values detected along an interphase is depicted (from minimum to maximum values), as well as the mean value (line). Plots of individual cells throughout time are shown in supplementary material Figs S2 and S3. The average values of the FIn for all mESCs in each condition is calculated, and is not significantly different between serum/LIF and 2i/LIF. Non-fluctuating cells are marked with an asterisk. Fluorescence values are depicted as arbitrary units of fluorescence (A.U.F.). (B) Bar charts representing fluctuating mESCs (25 cells in serum/LIF and 47 cells in 2i/LIF) grouped according to FIn values. (C) Global analysis of the kinetics of Nanog:VNP gain (+) and decay (−) rates in all tracked mESCs. Rates around zero reflect the periods in which fluorescence levels do not vary (*). In 2i/LIF conditions, the majority of the mESCs are continuously fluctuating and only rarely slow down to zero rates. Fast variations in fluorescence are detected in both conditions, with peaks (**) at similar paces. Global mean, maximum, minimum and median values are shown in Table 1. (D) Histograms for Nanog:VNP fluorescence levels at division time. The frequency of cells that enter division with low or no Nanog:VNP in serum/LIF (*) is higher in serum/LIF and reflects the higher percentage of non-expressing cells in these conditions. Average values for Nanog:VNP fluorescence at the time of mitosis tend to be higher in 2i/LIF conditions, although not statistically different. (E) Histograms for Nanog:VNP fluorescence levels at all time points, for all mESCs in serum/LIF and 2i/LIF.
Fig. 2.
Fig. 2.
Nanog heterogeneity at the mRNA level, in different culture conditions (serum/LIF and 2i/LIF). (A) Representative field from Nd mESCs grown in serum/LIF, showing individual mRNA ‘spots’ in different cells. Quantifications are depicted in C. (B) Same as A for Nd cells grown in 2i/LIF medium, with quantifications depicted in D. (C) Histograms showing the distribution of Nanog mRNA molecules per cell, for Nd and E14tg2a mESCs. The number of analysed cells in each condition is shown in brackets. Population mean, Fano factor (defined as the ratio of the variance to the mean) (Raj and van Oudenaarden, 2009) and coefficient of variation (CV, defined as the ratio of the standard deviation to the mean) are also shown for each cell population. For both conditions, the calculated Fano factor and CV values are similar between Nd and E14tg2a mESC lines. The Fano factor allows an estimation of noise strength and is much higher than predicted for a normal Poissonian distribution (equal to 1). Insets show respective boxplots, with median values depicted as solid black lines within the box, and mean values as full black circles. The edges of the box indicate the 25th and 75th percentiles and the whiskers indicate the range of non-outlier data points. Outliers are plotted individually (open circles). (D) Same as C for mESCs grown in 2i/LIF medium. Scale bars: 10 µm.
Fig. 3.
Fig. 3.
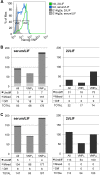
Clonogenic potential of Nanog:VNP subpopulations, under different culture conditions (serum/LIF and 2i/LIF). (A) Representative histograms of FACS-sorted Nd subpopulations, grown in serum/LIF or 2i/LIF. VNPL and VNPH populations, as well as non-sorted bulk populations (All), were collected for posterior analysis. (B) Number and type of colonies (undifferentiated – AP positive, mixed or differentiated – AP negative; illustrative images in supplementary material Fig. S5) obtained from each mESC subpopulation (All, VNPL, VNPH) initially grown in serum/LIF (n=2). Subpopulations were plated at clonal density in serum/LIF or 2i/LIF media (600 cells per well of a six-well dish) and colony types analysed after 6 days. (C) Same as B for cells initially grown in 2i/LIF media (n=2), and replated in either serum/LIF or 2i/LIF. VNPL cells replated in serum/LIF generate predominantly mixed (71% and 92%) and differentiated colonies (27% and 6%), whereas VNPH cells generate fewer differentiated colonies and higher percentages of mixed and pure mESC colonies (more than 93% of total formed colonies). In addition, VNPH cells reveal higher clonogenic capacity than VNPL cells in 2i/LIF, although this difference is more attenuated when cells have been previously grown in 2i/LIF.
Fig. 4.
Fig. 4.
Fluidigm transcriptome analysis in FACS-sorted Nd mESCs. (A) Gene expression profiling of pluripotency and lineage-affiliated genes (31 out of 48 genes tested) in cell samples collected [n=3 (serum/LIF) or n=2 (2i/LIF and BMP4/LIF)] immediately after sorting of Nd mESCs grown in serum/LIF, 2i/LIF or BMP4/LIF conditions. Data are represented as log2 fold changes of VNPL relative to respective VNPH samples. Values lower than −1 indicate lower expression (fold change ≥2) in VNPL samples (pluripotency genes), whereas values higher than 1 indicate increased gene expression in VNPL mESCs. Genes are coloured according to their classification (pluripotency, trophoectoderm, primitive endoderm, mesoderm and ectoderm). (B) Pair-wise comparison of the variations in expression for each individual gene (depicted as log2 fold changes) between VNPL and VNPH Nd mESCs, grown in serum/LIF and 2i/LIF. Note for example that Pax3 (30) has higher expression in VNPL mESCs from both 2i/LIF or serum/LIF, while Nestin (29) is only higher in VNPL mESCs from serum/LIF. Also, variations in pluripotency gene expression in 2i/LIF are below the fold change cut-off (2×), with exception of Zfp42 (11) that has higher expression in VNPH mESCs (C) The same as B for VNPL and VNPH Nd mESCs grown in serum/LIF and BMP4/LIF. (D) The same as B for VNPL and VNPH Nd mESCs grown in BMP4/LIF and 2i/LIF. PE, primitive endoderm; TE, trophoectoderm.
Fig. 5.
Fig. 5.
Principal component analysis (PCA) of pluripotency and lineage-affiliated genes in VNPL and VNPH purified-subpopulations of Nd mESCs. (A) Distribution of subpopulations on scores plot. Each point corresponds to a biological sample and is coloured according to cell culture media, as indicated (serum/LIF: SL; 2i/LIF: 2iL; BMP4/LIF: BL). Empty marks refer to VNPL subpopulations, whereas full marks refer to VNPH subpopulations. Dashed circles highlight groups of samples occupying similar state spaces, reflecting higher similarity in their gene expression profiles. (B) Distribution of variables (genes) on loadings plot. Each point corresponds to a gene and is coloured according to its functional role, as indicated. Pluripotency genes are concentrated in the same state space highlighted by a dashed line. The variances associated with each principal component and corresponding eigenvalues are indicated in supplementary material Fig. S6B. PE, primitive endoderm; TE, trophoectoderm.

References

    1. Abranches E., Bekman E., Henrique D. (2013). Generation and characterization of a novel mouse embryonic stem cell line with a dynamic reporter of nanog expression. PLoS ONE 8, e59928 10.1371/journal.pone.0059928 - DOI - PMC - PubMed
    1. Adachi K., Niwa H. (2013). A liaison between intrinsic and extrinsic regulators of pluripotency. EMBO J. 32, 2531-2532. 10.1038/emboj.2013.196 - DOI - PMC - PubMed
    1. Chambers I., Silva J., Colby D., Nichols J., Nijmeijer B., Robertson M., Vrana J., Jones K., Grotewold L., Smith A. (2007). Nanog safeguards pluripotency and mediates germline development. Nature 450, 1230-1234. 10.1038/nature06403 - DOI - PubMed
    1. Chickarmane V., Troein C., Nuber U. A., Sauro H. M., Peterson C. (2006). Transcriptional dynamics of the embryonic stem cell switch. PLoS Comput. Biol. 2, e123 10.1371/journal.pcbi.0020123 - DOI - PMC - PubMed
    1. Choi S.-C., Choi J.-H., Park C.-Y., Ahn C.-M., Hong S.-J., Lim D.-S. (2012). Nanog regulates molecules involved in stemness and cell cycle-signaling pathway for maintenance of pluripotency of P19 embryonal carcinoma stem cells. J. Cell Physiol. 227, 3678-3692. 10.1002/jcp.24076 - DOI - PubMed

Publication types

MeSH terms