

Validation of the pulse decomposition analysis algorithm using central arterial blood pressure
- PMID: 25005686
- PMCID: PMC4105793
- DOI: 10.1186/1475-925X-13-96
Validation of the pulse decomposition analysis algorithm using central arterial blood pressure
Abstract
Background: There is a significant need for continuous noninvasive blood pressure (cNIBP) monitoring, especially for anesthetized surgery and ICU recovery. cNIBP systems could lower costs and expand the use of continuous blood pressure monitoring, lowering risk and improving outcomes.The test system examined here is the CareTaker® and a pulse contour analysis algorithm, Pulse Decomposition Analysis (PDA). PDA's premise is that the peripheral arterial pressure pulse is a superposition of five individual component pressure pulses that are due to the left ventricular ejection and reflections and re-reflections from only two reflection sites within the central arteries.The hypothesis examined here is that the model's principal parameters P2P1 and T13 can be correlated with, respectively, systolic and pulse pressures.
Methods: Central arterial blood pressures of patients (38 m/25 f, mean age: 62.7 y, SD: 11.5 y, mean height: 172.3 cm, SD: 9.7 cm, mean weight: 86.8 kg, SD: 20.1 kg) undergoing cardiac catheterization were monitored using central line catheters while the PDA parameters were extracted from the arterial pulse signal obtained non-invasively using CareTaker system.
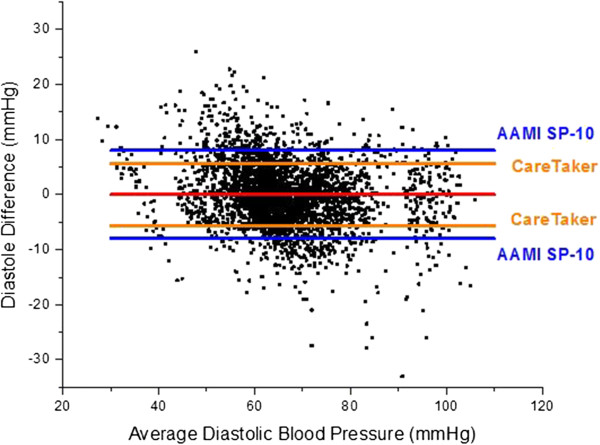
Results: Qualitative validation of the model was achieved with the direct observation of the five component pressure pulses in the central arteries using central line catheters. Statistically significant correlations between P2P1 and systole and T13 and pulse pressure were established (systole: R square: 0.92 (p < 0.0001), diastole: R square: 0.78 (p < 0.0001). Bland-Altman comparisons between blood pressures obtained through the conversion of PDA parameters to blood pressures of non-invasively obtained pulse signatures with catheter-obtained blood pressures fell within the trend guidelines of the Association for the Advancement of Medical Instrumentation SP-10 standard (standard deviation: 8 mmHg(systole: 5.87 mmHg, diastole: 5.69 mmHg)).
Conclusions: The results indicate that arterial blood pressure can be accurately measured and tracked noninvasively and continuously using the CareTaker system and the PDA algorithm. The results further support the physical model that all of the features of the pressure pulse envelope, whether in the central arteries or in the arterial periphery, can be explained by the interaction of the left ventricular ejection pressure pulse with two centrally located reflection sites.
Figures


References
-
- Martina JR(1), Westerhof BE, van Goudoever J, de Beaumont EM, Truijen J, Kim YS, Immink RV, Jöbsis DA, Hollmann MW, Lahpor JR, de Mol BA, van Lieshout JJ. Noninvasive continuous arterial blood pressure monitoring with Nexfin®. Anesthesiology. 2012;116(5):1092–1103. - PubMed
-
- Imholz BP(1), Wieling W, van Montfrans GA, Wesseling KH. Fifteen years’ experience with finger arterial pressure monitoring: assessment of the technology. Cardiovasc Res. 1998;38(3):605–616. - PubMed
-
- Hager H(1), Mandadi G, Pulley D, Eagon JC, Mascha E, Nutter B, Kurz A. A comparison of noninvasive blood pressure measurement on the wrist with invasive arterial blood pressure monitoring in patients undergoing bariatric surgery. Obes Surg. 2009;19(6):717–724. - PubMed
-
- Meidert AS(1), Huber W, Müller JN, Schöfthaler M, Hapfelmeier A, Langwieser N, Wagner JY, Eyer F, Schmid RM, Saugel B. Radial artery applanation tonometry for continuous non-invasive arterial pressure monitoring in intensive care unit patients: comparison with invasively assessed radial arterial pressure. Br J Anaesth. 2014;112(3):521–528. - PubMed
-
- Zorn EA(1), Wilson MB, Angel JJ, Zanella J, Alpert BS. Validation of an automated arterial tonometry monitor using Association for the Advancement of Medical Instrumentation standards. Blood Press Monit. 1997;2(4):185–188. - PubMed
Publication types
MeSH terms
LinkOut - more resources
Full Text Sources
Other Literature Sources
Medical
