

Improving peak detection in high-resolution LC/MS metabolomics data using preexisting knowledge and machine learning approach
- PMID: 25005748
- PMCID: PMC4184266
- DOI: 10.1093/bioinformatics/btu430
Improving peak detection in high-resolution LC/MS metabolomics data using preexisting knowledge and machine learning approach
Abstract
Motivation: Peak detection is a key step in the preprocessing of untargeted metabolomics data generated from high-resolution liquid chromatography-mass spectrometry (LC/MS). The common practice is to use filters with predetermined parameters to select peaks in the LC/MS profile. This rigid approach can cause suboptimal performance when the choice of peak model and parameters do not suit the data characteristics.
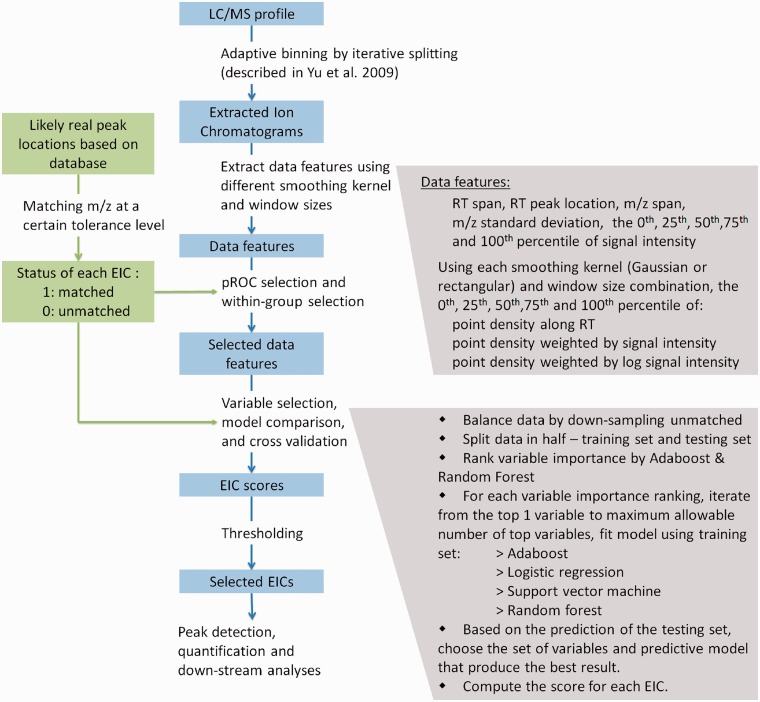
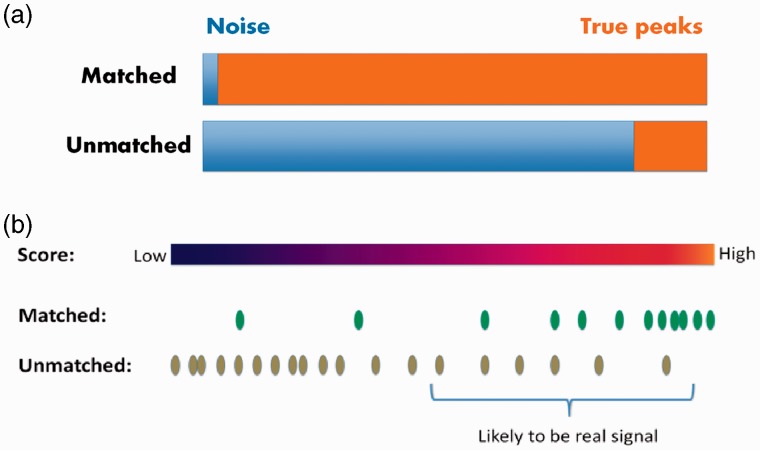
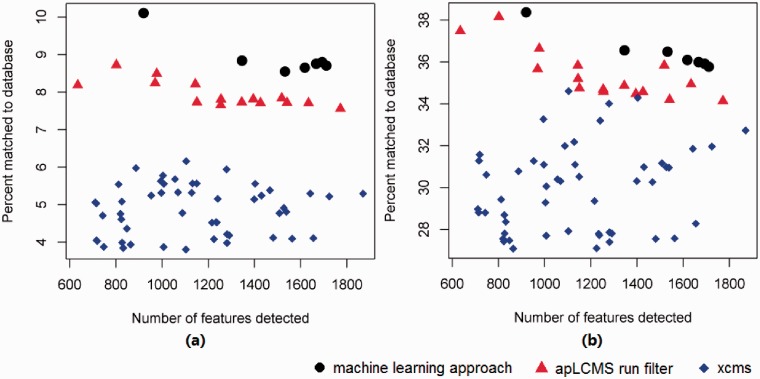
Results: Here we present a method that learns directly from various data features of the extracted ion chromatograms (EICs) to differentiate between true peak regions from noise regions in the LC/MS profile. It utilizes the knowledge of known metabolites, as well as robust machine learning approaches. Unlike currently available methods, this new approach does not assume a parametric peak shape model and allows maximum flexibility. We demonstrate the superiority of the new approach using real data. Because matching to known metabolites entails uncertainties and cannot be considered a gold standard, we also developed a probabilistic receiver-operating characteristic (pROC) approach that can incorporate uncertainties.
Availability and implementation: The new peak detection approach is implemented as part of the apLCMS package available at http://web1.sph.emory.edu/apLCMS/ CONTACT: tyu8@emory.edu
Supplementary information: Supplementary data are available at Bioinformatics online.
© The Author 2014. Published by Oxford University Press. All rights reserved. For Permissions, please e-mail: journals.permissions@oup.com.
Figures
References
-
- Aberg KM, et al. Feature detection and alignment of hyphenated chromatographic-mass spectrometric data. Extraction of pure ion chromatograms using Kalman tracking. J. Chromatogr. A. 2008;1192:139–146. - PubMed
-
- Cui Q, et al. Metabolite identification via the Madison Metabolomics Consortium Database. Nat. Biotechnol. 2008;26:162–164. - PubMed
-
- Fawcett T. An introduction to ROC analysis. Pattern Recognit. Lett. 2006;27:861–874.
-
- Hastie T, et al. The Elements of Statistical Learning: Data Mining, Inference: Prediction. Springer, New York, NY: 2009.
-
- Issaq HJ, et al. Analytical and statistical approaches to metabolomics research. J. Sep. Sci. 2009;32:2183–2199. - PubMed
Publication types
MeSH terms
Grants and funding
LinkOut - more resources
Full Text Sources
Other Literature Sources
