. 2014 Jul 9:4:5638.
doi: 10.1038/srep05638.

Revealing the structure of the world airline network

Affiliations

Revealing the structure of the world airline network

T Verma et al. Sci Rep. .

Abstract

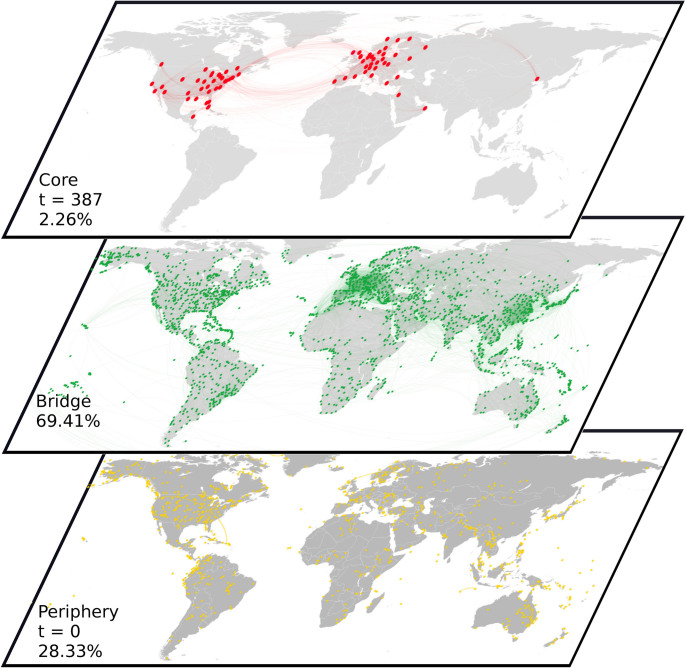
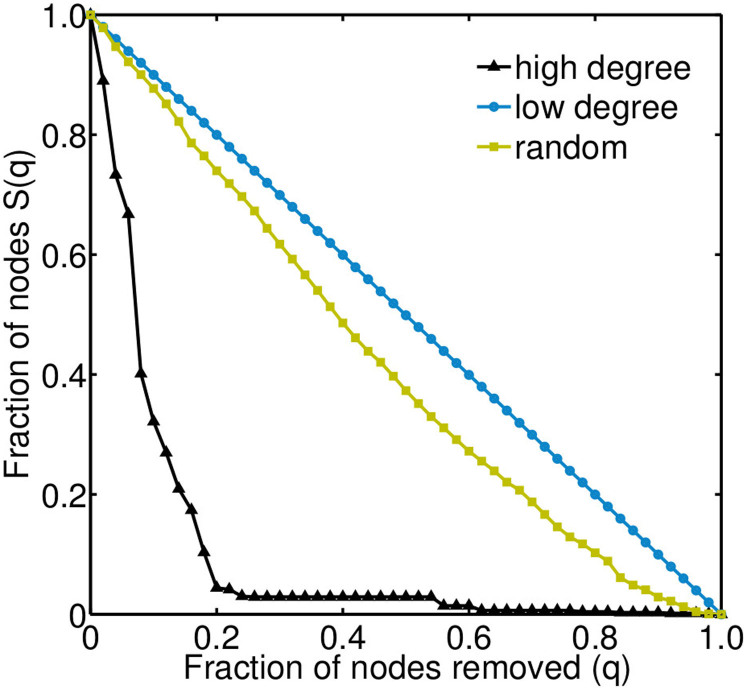
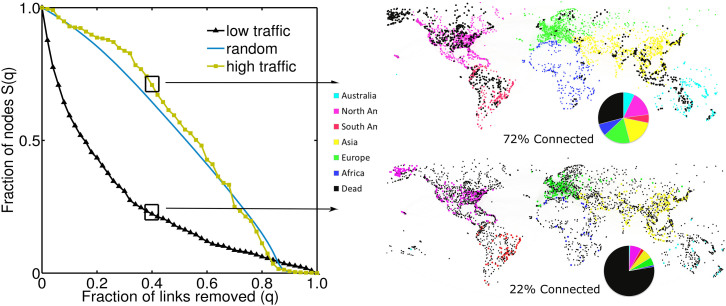
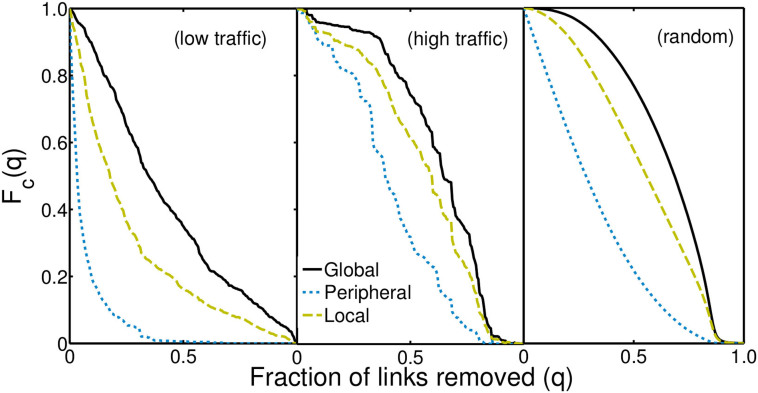
Resilience of most critical infrastructures against failure of elements that appear insignificant is usually taken for granted. The World Airline Network (WAN) is an infrastructure that reduces the geographical gap between societies, both small and large, and brings forth economic gains. With the extensive use of a publicly maintained data set that contains information about airports and alternative connections between these airports, we empirically reveal that the WAN is a redundant and resilient network for long distance air travel, but otherwise breaks down completely due to removal of short and apparently insignificant connections. These short range connections with moderate number of passengers and alternate flights are the connections that keep remote parts of the world accessible. It is surprising, insofar as there exists a highly resilient and strongly connected core consisting of a small fraction of airports (around 2.3%) together with an extremely fragile star-like periphery. Yet, in spite of their relevance, more than 90% of the world airports are still interconnected upon removal of this core. With standard and unconventional removal measures we compare both empirical and topological perceptions for the fragmentation of the world. We identify how the WAN is organized into different classes of clusters based on the physical proximity of airports and analyze the consequence of this fragmentation.


Figures

Figure 1
Figure 1. The world airline network divided into three parts.
The bottom layer is the Periphery with airports having a zero clustering coefficient. These airports reveal the peripheral world. The top layer is the Core with airports that form the nucleus of the t-core, t = 387. Nodes in the t-core are part of at least t triangles. This layer shows how well connected some of the major economic hubs of the world are. The intermediate layer is the Bridge with all the remaining airports that act as bridges to connect remote locations to global hubs. All maps are produced using Gephi.
Figure 2
Figure 2. Drop in the size of the largest connected cluster of the WAN against removal of nodes.
High degree refers to a conventional targeted removal strategy wherein each subsequent step corresponds to removing upto a fraction, q, of nodes with the highest degree. In low degree strategy, each subsequent step corresponds to removing upto a fraction, q, of nodes with the lowest degree. The random removal strategy is an average over 500 statistically independent simulations.
Figure 3
Figure 3. Drop in the size of the largest cluster of the WAN against removal of links.
Connections are ranked according to the number of passengers using it. In high traffic removal, each subsequent step corresponds to removal of all connections up to a fraction, q, with the highest number of passengers. In low traffic removal, each subsequent step corresponds to removal of all connections up to a fraction, q, with the lowest number of passengers. The random removal strategy is an average over 500 statistically independent simulations and each step removes a fraction, q, of connections chosen at random. After removing 40% of the busy connections, 72% of the network is still connected, shown in the top-right map. The bottom right map shows that after removing the same fraction of idle connections, the world disintegrates completely, revealing the vulnerable nature of the periphery of the network (22% connected). The black nodes are not part of the largest connected cluster. The remaining colors represent different continents and show the nodes that are part of the largest connected cluster. All maps are produced using Gephi.
Figure 4
Figure 4. Drop in fraction of airports within a cluster regime.
Fc(q) is the fraction of airports belonging to a cluster regime c after removal of a fraction of connections q. The first frame shows a drop in airports that belong to the largest connected component based on an low traffic removal. The subsequent frames show the same for high traffic removal and an average over 500 random removals. In all cases, peripheral hubs (Cc = Cw = 0) drop out of the largest connected component first.

References

    1. The Sydney Morning Herald., http://goo.gl/gvy9Kg, (2010) (Date of access:04/04/2014).
    1. ICAO., http://goo.gl/LCgb5f, (2012) (Date of access:04/04/2014).
    1. Albert R., Jeong H. & Barabási A.-L. Error and attack tolerance of complex networks. Nature 406, 378–382 (2000). - PubMed
    1. Barabási A.-L., Albert R. & Jeong H. Scale-free characteristics of random networks: the topology of the world-wide web. Phys. A 281, 69–77 (2000).
    1. Boccaletti S., Latora V., Moreno Y., Chavez M. & Hwang D.-U. Complex networks: structure and dynamics. Phys. Rep. 424, 175–308 (2006).

Publication types

LinkOut - more resources