

A distinct glucose metabolism signature of acute myeloid leukemia with prognostic value
- PMID: 25006128
- PMCID: PMC5726328
- DOI: 10.1182/blood-2014-02-554204
A distinct glucose metabolism signature of acute myeloid leukemia with prognostic value
Erratum in
- Blood. 2014 Oct 30;124(18):2893
Abstract
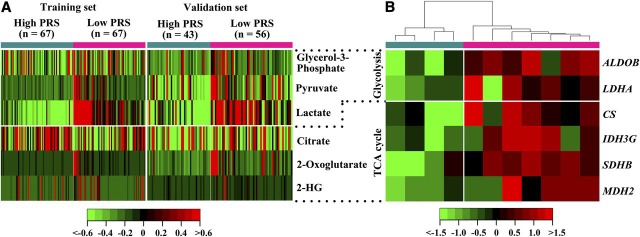
Acute myeloid leukemia (AML) is a group of hematological malignancies with high heterogeneity. There is an increasing need to improve the risk stratification of AML patients, including those with normal cytogenetics, using molecular biomarkers. Here, we report a metabolomics study that identified a distinct glucose metabolism signature with 400 AML patients and 446 healthy controls. The glucose metabolism signature comprises a panel of 6 serum metabolite markers, which demonstrated prognostic value in cytogenetically normal AML patients. We generated a prognosis risk score (PRS) with 6 metabolite markers for each patient using principal component analysis. A low PRS was able to predict patients with poor survival independently of well-established markers. We further compared the gene expression patterns of AML blast cells between low and high PRS groups, which correlated well to the metabolic pathways involving the 6 metabolite markers, with enhanced glycolysis and tricarboxylic [corrected] acid cycle at gene expression level in low PRS group. In vitro results demonstrated enhanced glycolysis contributed to decreased sensitivity to antileukemic agent arabinofuranosyl cytidine (Ara-C), whereas inhibition of glycolysis suppressed AML cell proliferation and potentiated cytotoxicity of Ara-C. Our study provides strong evidence for the use of serum metabolites and metabolic pathways as novel prognostic markers and potential therapeutic targets for AML.
© 2014 by The American Society of Hematology.
Figures


References
-
- Shen Y, Zhu YM, Fan X, et al. Gene mutation patterns and their prognostic impact in a cohort of 1185 patients with acute myeloid leukemia. Blood. 2011;118(20):5593–5603. - PubMed
-
- Schlenk RF, Döhner K, Krauter J, et al. German-Austrian Acute Myeloid Leukemia Study Group. Mutations and treatment outcome in cytogenetically normal acute myeloid leukemia. N Engl J Med. 2008;358(18):1909–1918. - PubMed
-
- Mrózek K, Heerema NA, Bloomfield CD. Cytogenetics in acute leukemia. Blood Rev. 2004;18(2):115–136. - PubMed
-
- O’Donnell MR, Abboud CN, Altman J, et al. Acute myeloid leukemia. J Natl Compr Canc Netw. 2012;10(8):984–1021. - PubMed
-
- Wald D, Vermaat JM, Peleg G, Tse W. Genetic abnormalities in acute myelogenous leukemia with normal cytogenetics. Curr Hematol Malig Rep. 2008;3(2):83-88. - PubMed
Publication types
MeSH terms
Substances
Grants and funding
LinkOut - more resources
Full Text Sources
Other Literature Sources
Medical
Research Materials
