. 2014 Jul 8;5(4):e01442-14.
doi: 10.1128/mBio.01442-14.

Unprecedented high-resolution view of bacterial operon architecture revealed by RNA sequencing

Affiliations

Unprecedented high-resolution view of bacterial operon architecture revealed by RNA sequencing

Tyrrell Conway et al. mBio. .

Abstract

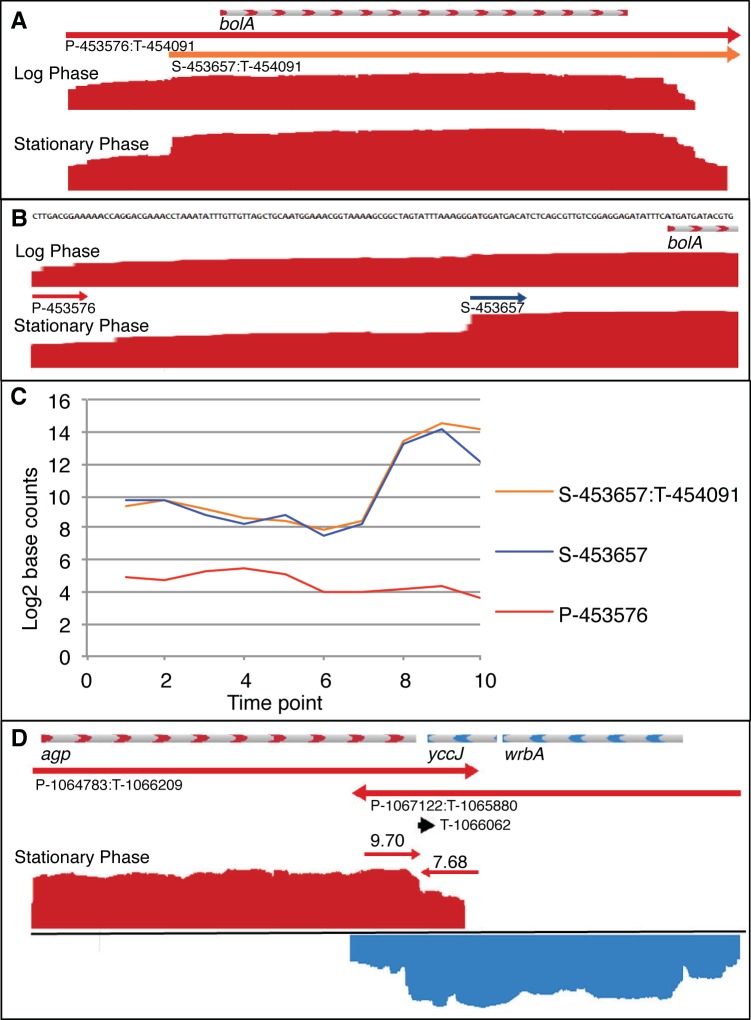
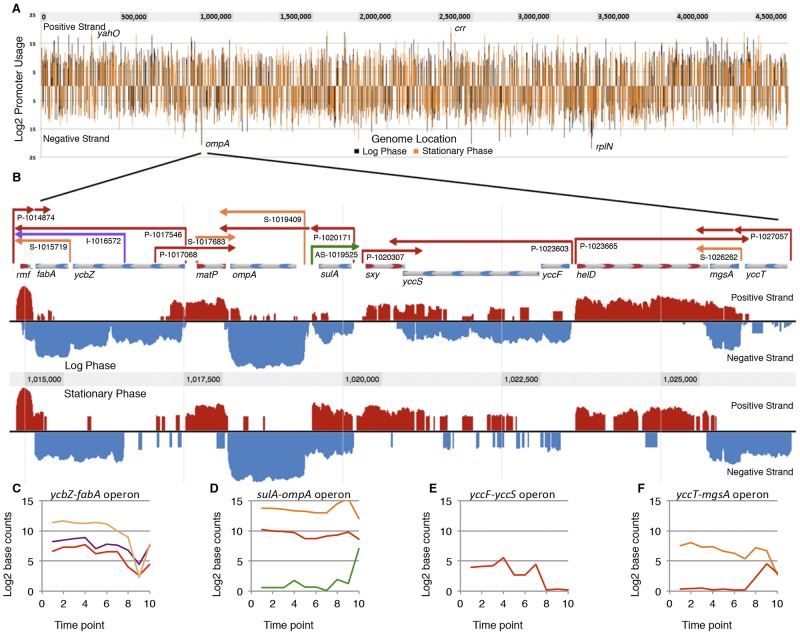
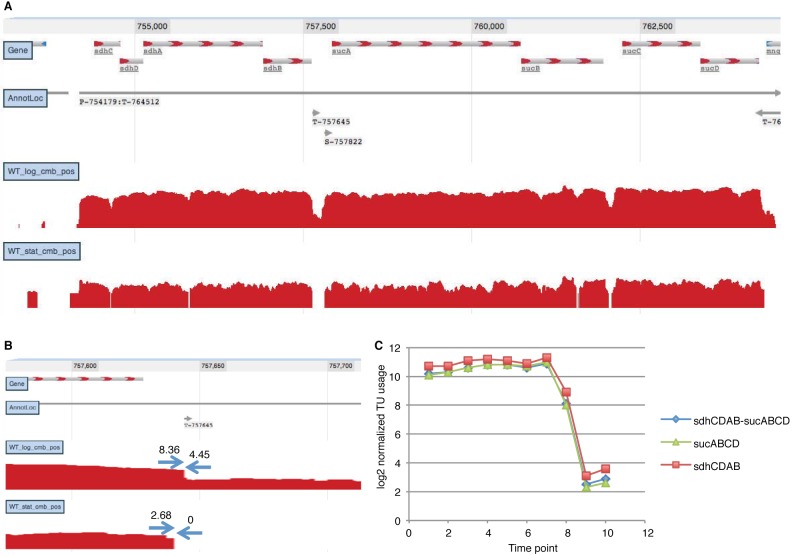
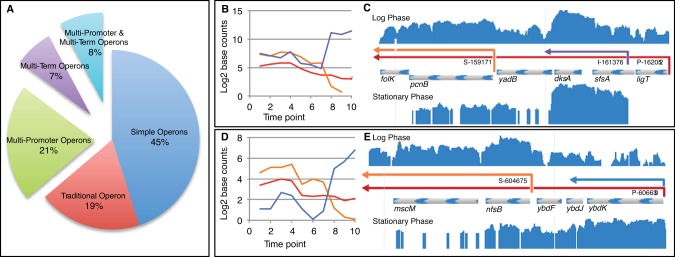
We analyzed the transcriptome of Escherichia coli K-12 by strand-specific RNA sequencing at single-nucleotide resolution during steady-state (logarithmic-phase) growth and upon entry into stationary phase in glucose minimal medium. To generate high-resolution transcriptome maps, we developed an organizational schema which showed that in practice only three features are required to define operon architecture: the promoter, terminator, and deep RNA sequence read coverage. We precisely annotated 2,122 promoters and 1,774 terminators, defining 1,510 operons with an average of 1.98 genes per operon. Our analyses revealed an unprecedented view of E. coli operon architecture. A large proportion (36%) of operons are complex with internal promoters or terminators that generate multiple transcription units. For 43% of operons, we observed differential expression of polycistronic genes, despite being in the same operons, indicating that E. coli operon architecture allows fine-tuning of gene expression. We found that 276 of 370 convergent operons terminate inefficiently, generating complementary 3' transcript ends which overlap on average by 286 nucleotides, and 136 of 388 divergent operons have promoters arranged such that their 5' ends overlap on average by 168 nucleotides. We found 89 antisense transcripts of 397-nucleotide average length, 7 unannotated transcripts within intergenic regions, and 18 sense transcripts that completely overlap operons on the opposite strand. Of 519 overlapping transcripts, 75% correspond to sequences that are highly conserved in E. coli (>50 genomes). Our data extend recent studies showing unexpected transcriptome complexity in several bacteria and suggest that antisense RNA regulation is widespread. Importance: We precisely mapped the 5' and 3' ends of RNA transcripts across the E. coli K-12 genome by using a single-nucleotide analytical approach. Our resulting high-resolution transcriptome maps show that ca. one-third of E. coli operons are complex, with internal promoters and terminators generating multiple transcription units and allowing differential gene expression within these operons. We discovered extensive antisense transcription that results from more than 500 operons, which fully overlap or extensively overlap adjacent divergent or convergent operons. The genomic regions corresponding to these antisense transcripts are highly conserved in E. coli (including Shigella species), although it remains to be proven whether or not they are functional. Our observations of features unearthed by single-nucleotide transcriptome mapping suggest that deeper layers of transcriptional regulation in bacteria are likely to be revealed in the future.


Figures

FIG 1
FIG 1
Single-nucleotide resolution of promoters and terminators in example complex operons. (A) The bolA operon contains transcription units (TUs) P-453657:T-454091 (red arrow) and S-453688:T-454091 (orange arrow). RNA-Seq data are shown in a JBrowse visualization of positive-strand (red) transcription in logarithmic- and stationary-phase samples (average from three replicates). The base count data were normalized and log2 transformed such that track heights in JBrowse are directly comparable. (B) bolA promoter region showing primary promoter P-453576 and secondary promoter S-453658 at single-nucleotide resolution (drawn to scale). (C) Plot of promoter usage (average count of 10 bases beginning at TSS) and TU usage (average count of bases within TU) for 10 growth curve time points showing bolA induction upon entry into stationary phase (see Fig. S1 for growth curve). (D) Terminator usage (average counts of 10 bases preceding and following terminator) is shown for T-1066062, which is shared by converging operons agp on positive strand (red) and wrbA-yccJ on negative strand (blue).
FIG 2
FIG 2
Genome-wide promoter locations and annotated transcriptome map of a selected region. (A) Promoters aligned by genome location. Line heights correspond to normalized, TEX-enriched promoter usage values (see text for details), shown for logarithmic phase (black) and stationary phase (orange). (B) Annotated regulatory features of a selected region of the genome. Positive-strand RNA-Seq data (red) and negative-strand data (blue) were normalized for comparison between logarithmic- and stationary-phase samples. Primary promoters and corresponding TUs (red) are indicated by arrows extending from promoter to terminator, as are secondary promoters (orange), internal promoters (purple), and AS promoters (green). Beginning on the left, rmf is transcribed from a primary promoter and depending on growth conditions terminates either before or within the ycbZ-fabA operon, which has a primary promoter upstream of ycbZ, an internal promoter within ycbZ, and a secondary promoter upstream of fabA. matP is transcribed from primary and secondary promoters. ompA is transcribed from a secondary promoter in logarithmic phase and is cotranscribed from the primary promoter of the sulA-ompA operon during stationary phase. An AS TU that overlaps the sulA sense transcript is turned on in stationary phase. The sxy and yccF-yccS operons converge. Finally, mgsA is transcribed as an independent TU from a secondary promoter in logarithmic phase and also is expressed in the yccT-mgsA operon from a promoter that is active only in stationary phase. (C) Plot of TU base counts for ycbZ-fabA operon, colorized according to color scheme in panel B; (D) TU plot of sulA-ompA operon; (E) TU plot of yccFS operon; (F) TU plot of yccT-mgsA operon.
FIG 3
FIG 3
Balanced transcript coverage of the sdhCDAB-sucABCD operon achieved by complex interaction of internal terminator and secondary promoter. (A) JBrowse instance showing coverage data; (B) terminator usage in logarithmic (WT_log_cmb_pos) and stationary (WT_stat_cmb_pos) phase; (C) TU coverage time series.
FIG 4
FIG 4
Computational analysis of single-nucleotide resolution data reveals complex operon architecture. (A) Operons organized by increasing complexity; (B) TU usage plot of ligT-sfsA-dksA-yadB-pcnB-floK operon. The primary TU corresponding to the entire operon is shown in red. The differentially expressed dksA-specific TU driven by promoter I-161376 is shown in purple. The pcnB-folK TU driven by S-159171 is shown in orange. Note that transcript levels of dksA increase upon entry into stationary phase, whereas pcnB-folK decreases. (C) JBrowse instance showing ligT-sfsA-dksA-yadB-pcnB-floK operon; (D) TU usage plot of ybdK-ybdJ-ybdF-nrsB-mbcM operon. Note the primary TU corresponding to the entire operon (red) decreases only slightly during transition from logarithmic phase into stationary phase, because it is comprised of two differentially expressed TUs, one of which increases and the other decreases during growth: the nfsB-mbcM-specific transcript (orange) essentially disappears in stationary phase, whereas the ybdK-specific transcript (blue) is induced in stationary phase. (E) JBrowse instance of ybdK-ybdJ-ybdF-nrsB-mbcM operon.
FIG 5
FIG 5
Three promoters contribute to expression levels of genes within the ahpCF and the ybfE-fldA-uof-fur operons. (A) WT time series of TU base counts of three overlapping TUs within the ahpCF operon; (B) usage of 3 ahpC promoters (10-base average from TSS +1 to +10) during logarithmic phase (time point 4); (C) TU coverage time series of the ybfE-fldA-uof-fur operon; (D) differential usage of three promoters within the ybfE-fldA-uof-fur operon during log phase. Promoter usage and TU coverage calculations are described in the legend to Fig. 1.

Similar articles

Cited by

References

    1. Lederberg J, Tatum EL. 1946. Gene recombination in Escherichia coli. Nature 158:558. 10.1038/158558c0 - DOI - PubMed
    1. Jacob F, Monod J. 1961. Genetic regulatory mechanisms in the synthesis of proteins. J. Mol. Biol. 3:318–356. 10.1016/S0022-2836(61)80072-7 - DOI - PubMed
    1. Lehman IR, Bessman MJ, Simms ES, Kornberg A. 1958. Enzymatic synthesis of deoxyribonucleic acid. I. Preparation of substrates and partial purification of an enzyme from Escherichia coli. J. Biol. Chem. 233:163–170 - PubMed
    1. Lengyel P, Speyer JF, Ochoa S. 1961. Synthetic polynucleotides and the amino acid code. Proc. Natl. Acad. Sci. U. S. A. 47:1936–1942. 10.1073/pnas.47.12.1936 - DOI - PMC - PubMed
    1. Luria SE, Delbrück M. 1943. Mutations of bacteria from virus sensitivity to virus resistance. Genetics 28:491–511 - PMC - PubMed

Publication types

MeSH terms

Associated data