. 2014 Aug 29;289(35):24560-72.
doi: 10.1074/jbc.M114.571620. Epub 2014 Jul 8.

Polarization of prostate cancer-associated macrophages is induced by milk fat globule-EGF factor 8 (MFG-E8)-mediated efferocytosis

Affiliations

Polarization of prostate cancer-associated macrophages is induced by milk fat globule-EGF factor 8 (MFG-E8)-mediated efferocytosis

Fabiana N Soki et al. J Biol Chem. .

Abstract

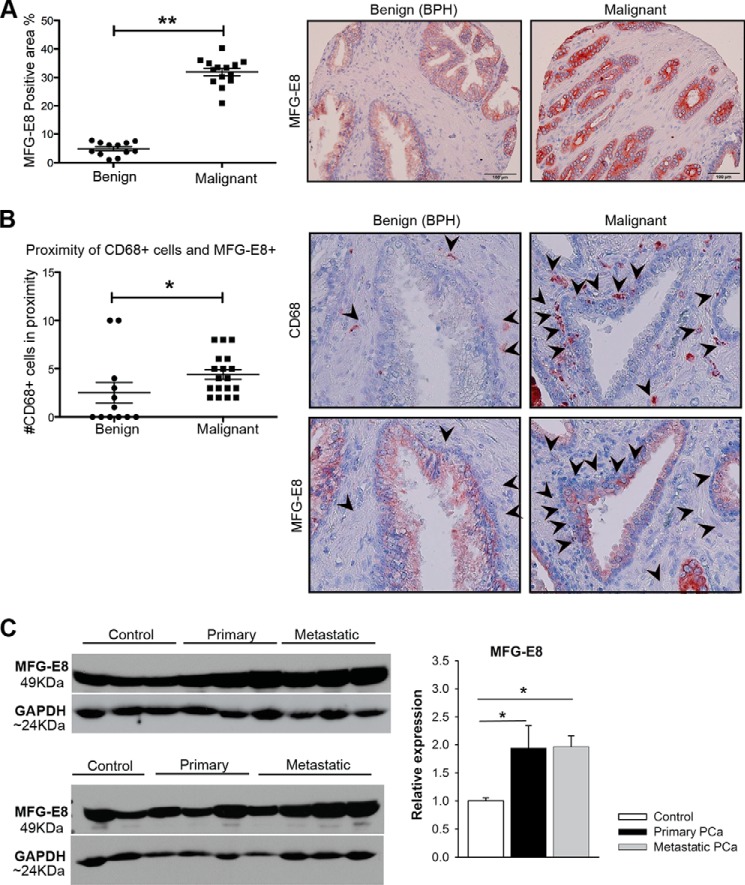
Tumor cells secrete factors that modulate macrophage activation and polarization into M2 type tumor-associated macrophages, which promote tumor growth, progression, and metastasis. The mechanisms that mediate this polarization are not clear. Macrophages are phagocytic cells that participate in the clearance of apoptotic cells, a process known as efferocytosis. Milk fat globule- EGF factor 8 (MFG-E8) is a bridge protein that facilitates efferocytosis and is associated with suppression of proinflammatory responses. This study investigated the hypothesis that MFG-E8-mediated efferocytosis promotes M2 polarization. Tissue and serum exosomes from prostate cancer patients presented higher levels of MFG-E8 compared with controls, a novel finding in human prostate cancer. Coculture of macrophages with apoptotic cancer cells increased efferocytosis, elevated MFG-E8 protein expression levels, and induced macrophage polarization into an alternatively activated M2 phenotype. Administration of antibody against MFG-E8 significantly attenuated the increase in M2 polarization. Inhibition of STAT3 phosphorylation using the inhibitor Stattic decreased efferocytosis and M2 macrophage polarization in vitro, with a correlating increase in SOCS3 protein expression. Moreover, MFG-E8 knockdown tumor cells cultured with wild-type or MFG-E8-deficient macrophages resulted in increased SOCS3 expression with decreased STAT3 activation. This suggests that SOCS3 and phospho-STAT3 act in an inversely dependent manner when stimulated by MFG-E8 and efferocytosis. These results uncover a unique role of efferocytosis via MFG-E8 as a mechanism for macrophage polarization into tumor-promoting M2 cells.

Keywords: Alternative Activation; Bone; Bone Marrow; Efferocytosis; MFG-E8; Macrophage; Phagocytosis; Prostate Cancer; Skeletal Metastasis; Tumor-associated Macrophages.


Figures

FIGURE 1.
FIGURE 1.
MFG-E8 expression is increased in prostate cancer patients. A and B, immunohistochemistry was performed on serial sections of prostate cancer TMAs containing 30 benign (n = 12) and malignant (n = 18) matched tissue specimens combined. A, MFG-E8 expression in benign and malignant prostate cancer TMAs was analyzed by calculation of percent positive MFG-E8 expression in the region of interest. Data are mean ± S.E. **, p < 0.0001. B, proximity of CD68-positive macrophages and MFG-E8 was determined by analyzing three tissue sections at ×200 magnification per specimen per TMA. Overlapping or cells in close proximity positive for CD68 and MFG-E8 were counted, as indicated by arrowheads. The number (#) of CD68+ cells in proximity to MFG-E8 was counted as indicated in the graph. The mean of all three images was calculated, and the overall mean was obtained for each tissue type. Data are mean ± S.E. *, p < 0.05. C, serum exosome proteins were isolated from patients with primary (n = 6) and metastatic (n = 7) prostate cancer (PCa) or control tumor-free individuals (n = 3). The first two controls from the top blot were also included in the bottom blot for standardization and relative calculation. MFG-E8 protein expression was quantified using Scion Image software and calculated relative to control GAPDH. Data are mean ± S.E. *, p < 0.05.
FIGURE 2.
FIGURE 2.
Efferocytosis of apoptotic tumor cells and MFG-E8 expression. A, representative confocal images (×63, 1. 4 oil objective) of stained macrophages (Mφ, red) cocultured for 5 h with CFSE-stained HAP (>60% apoptosis) and BAP (<10% apoptosis) RM-1 prostate cancer cells (green) at a 1:1 ratio. DAPI nuclear staining is shown in blue. White arrowheads show colocalization suggesting efferocytosis. B, quantification of efferocytosis in four fields of confocal microscopic images. Macrophages were cocultured with HAP or BAP RM-1 cells. Data are mean ± S.E. (n = 4/group). *, p < 0.05. C, flow cytometric analyses of bone marrow macrophages cultured with CFSE-stained RM-1 cells with basal or high apoptosis for 5 h. A representative plot shows cells double-positive for CFSE and the macrophage marker F4/80 indicating efferocytosis. The graph shows collective data (mean ± S.E., n = 5/group). *, p < 0.05. D, flow cytometric analyses of efferocytosis. Unstained RAW 264.7 cells cocultured for 5 h with Cell Tracker-stained HAP (>60% apoptosis) and BAP (<10% apoptosis) RM-1 cells. Efferocytosis was measured on the basis of unstained macrophages engulfing the RM1 Cell Tracker+ cells described as percent total cells ± S.E. (n = 5/group, p < 0.05). FSC, forward scatter. E, MFG-E8 is increased in macrophages cultured with high apoptotic RM-1 and PC-3 cells. Shown is a Western blot analysis for MFG-E8 protein expression when RAW 264.7 cells were cultured with BAP or HAP for 1, 5, and 24 h of incubation.
FIGURE 3.
FIGURE 3.
Macrophage-derived MFG-E8 expression is increased during efferocytosis regardless of tumor-derived MFG-E8 expression. A, MFG-E8 expression in prostate cancer and macrophage cell cultures. Shown is expression of MFG-E8 in cells alone. RAW 264.7 macrophages (RAW), RM-1, PC-3, and C42B prostate cancer cells express MFG-E8. Prostate cancer cells were treated with CoCl2 for 24 h (>60% apoptosis) and designated as HAP. BAP cells were left untreated (<10% apoptosis). Proteins were analyzed by Western blotting. Expression is reported relative to corresponding β-actin levels. Shown is a representative blot of two independent experiments where values correspond to fold change relative to RAW control (for RM1) or to PC-3 (for PC-3 and C42B). Data are mean ± S.E. (SEM) (n = 2/group). Rel. exp., relative expression. B, MFG-E8 protein expression from bone marrow macrophages collected from C57Bl/6 WT or MFG-E8 KO. C, MFG-E8 stable knockdown in cells was generated using five different clones as described under “Experimental Procedures.” Protein expression indicated the greatest knockdown for MFG-E8 in clones m_08 and m_30. D, WT or KO macrophages were cultured with BAP or HAP RM-1 cells containing GIPZ (negative control) or clone shRNA (m_08 and m_30) for 5 h at a 1:1 ratio. A representative image for Western blot analyses is shown, and MFG-E8 expression was determined. Experiments were repeated twice with similar results. E, quantification for MFG-E8 expression was determined by relative expression of MFG-E8 to the control β-actin. Data are mean ± S.E. of two independent experiments and normalized to HAP WT GIPZ control (n = 2/group). *, p < 0.05.
FIGURE 4.
FIGURE 4.
Efferocytosis via MFG-E8 induces M2 polarization. A and B, FACS analyses of efferocytosis in bone marrow macrophages (Mφ) cultured with BAP or HAP RM-1 (A) or PC-3 (B) cells. Efferocytosis was demonstrated as double-positive cells (CFSE+F4/80+) indicating macrophages (F4/80+) that engulfed tumor cells (CFSE+). Representative FACS and M2 polarization is shown as F4/80+CD206+ cells. Data are mean ± S.E. (n = 4/group from three independent experiments). *, p < 0.05. C, macrophages were treated with IgG or anti-MFG-E8 (20 μg/ml) and then cocultured with HAP RM-1 cells. FACS analyses of efferocytosis, reported as double-positive cells (CFSE+F4/80+) and M2 polarization (F4/80+CD206+) and representative FACS are shown. Data are mean ± S.E. (n = 4/group). *, p < 0.05 from three independent experiments. D, bone marrow macrophages were cultured for 24 h with HAP RM-1 cells or not cultured. The supernatant was collected, and proteins were analyzed using a mouse inflammation antibody array. The fold increase in densitometry was calculated relative to the positive controls (yellow) and according to the protocol of the manufacturer. Shown are IL-6 (red), chemokine (C-C motif) ligand 2 (CCL2 or MCP-1, blue), and chemokine (C-C motif) ligand 1 (CCL1 or TCA-3, green). Data are mean ± S.E. (n = 3/group). *, p < 0.05 from three independent experiments. E, bone marrow macrophages were cultured for 5 h with HAP RM-1 cells at 37 °C or at 4 °C to block efferocytosis. Gene expression levels were analyzed by quantitative PCR relative to Gapdh, and fold change was calculated. Shown are interleukin 10 (Il10), transforming growth factor β 1 (Tgfb1), Ym-1 (also known as chitinase 3-like protein 3, Chi3l3), and arginase1 (Arg1). Data are mean ± S.E. (n = 6/group from two independent experiments). *, p < 0.05; **, p < 0.001. F, bone marrow macrophages incubated at 4 °C did not alter gene expression. Gene expression relative to Gapdh and fold change was calculated for interleukin 10 (Il10), transforming growth factor β 1 (Tgfb1), Ym-1(Chi3l3), and arginase1 (Arg1). Data are mean ± S.E. (n = 3/group). *, p < 0.05.
FIGURE 5.
FIGURE 5.
MFG-E8 has a direct role in M2 macrophage polarization. A, rmMFG-E8 treatment increased the M2 population in bone marrow macrophages. Bone marrow cells were expanded for three days with M-CSF and treated with rmMFG-E8 for 50 h at different concentrations (0–2 μg/ml). Shown are FACS analyses of M2 cells double-positive for CD206 and intracellular Ym-1. A representative FACS analysis is shown. Data are mean ± S.E. (n = 4/group). Two independent experiments were performed with similar results. *, p < 0.05. NS, not significant; Mφ, bone marrow macrophages. B, IL-4-induced bone marrow macrophage M2 polarization (Ym-1+ CD206+) was reduced when cells were treated with anti-MFG-E8 antibody. Bone marrow macrophages were treated with 10 units/ml of IL-4 for 24 h in the presence of anti-MFG-E8 antibody (20 μg/ml) or IgG control. Data are mean ± S.E. (n = 4/group). *, p < 0.05.
FIGURE 6.
FIGURE 6.
Macrophage efferocytosis and activation of phospho-STAT3 signaling. A and B, flow cytometric analyses for efferocytosis (dual CFSE+F4/80+) and M2 polarization (F4/80+CD206+). Macrophages (Mφ) were pretreated with the phospho-STAT3 inhibitor Stattic 2 h prior to culture with RM-1 (A) and PC-3 (B) HAP tumor cells at a 1:3 ratio (Mφ:HAP). Data are mean ± S.E. (n = 4/group). *, p < 0.05. Experiments were performed three times with similar results. DMSO, dimethyl sulfoxide. C, macrophages were cocultured with PS-coated carboxylated beads (1:2 ratio) for 1 h. Shown are representative confocal images of bone marrow macrophages (red) from WT or MFG-E8 mutant mice (KO) engulfing fluorescent carboxylated beads. DAPI (blue) was the nuclear stain. D, quantification of phagocytic index was calculated using the following formula: (number of engulfed beads / number of total Mφ) × (Mφ that engulfed beads/number of total Mφ) × 100. Data are mean ± S.E. from two independent experiments, a total of n = 7/group. *, p < 0.05. E, representative Western blot showing two independent samples per group and the density quantification. Phospho-STAT3 expression levels were normalized to total STAT3 (p-STAT3/STAT3, n = 4/group), and SOCS3 (n = 2) expression levels were normalized relative to β-actin levels. Fold change was calculated for WT or MFG-E8 mutant mice (KO) dimethyl sulfoxide controls. Experiments were repeated twice, and data are mean ± S.E. *, p < 0.05.
FIGURE 7.
FIGURE 7.
MFG-E8 and efferocytosis in the STAT3/SOCS3 signaling pathway. A, WT or MFG-E8 mutant (KO) macrophages were pretreated 2 h with the efferocytosis inhibitor Cytochalasin D (2 μm) or control dimethyl sulfoxide. Cells were then incubated with HAP PC-3 cells at a 1:3 ratio for 6 h. Western blot analysis was performed in two independent samples per group, and the relative expression to β-actin control was quantified. Phospho-STAT3 expression levels were normalized to total STAT3 (p-STAT3/STAT3). Data are mean ± S.E. (n = 2/group). *, p < 0.05. B, high apoptotic GIPZ (negative control) or MFG-E8 knockdown shRNA (m_08 and m_30) RM-1 cells were incubated for 5 h at a 1:1 ratio. A representative image for Western blot analyses is shown, and p-STAT3 and SOCS3 expression was determined. Data are mean ± S.E. of two independent samples per group repeated twice (total n = 4/group). *, p < 0.05.
FIGURE 8.
FIGURE 8.
Proposed model of MFG-E8-mediated efferocytosis of tumor cells and macrophage polarization. MFG-E8 is a protein that functions as a bridge binding to the αvβ3vβ5 integrin expressed by macrophages and to PS externalized on apoptotic cells. Macrophages (Mφ) interact with apoptotic cells, resulting in increased MFG-E8 expression, therefore mediating the efferocytosis of apoptotic tumor cells. This interaction activates the phosphorylation of STAT3, leading to a polarization of macrophages into M2 tumor-promoting macrophages with increased expression of M2 markers such as CD206 and Ym-1 as well as M2-related genes of cytokines and growth factors known to contribute to tumor promotion. Moreover, MFG-E8 and efferocytosis may inhibit SOCS3, a negative regulator of STAT3, therefore keeping STAT3 signaling activated and promoting M2 polarization.

Similar articles

Cited by

References

    1. Bubendorf L., Schöpfer A., Wagner U., Sauter G., Moch H., Willi N., Gasser T. C., Mihatsch M. J. (2000) Metastatic patterns of prostate cancer: an autopsy study of 1,589 patients. Hum. Pathol. 31, 578–583 - PubMed
    1. Weilbaecher K. N., Guise T. A., McCauley L. K. (2011) Cancer to bone: a fatal attraction. Nat. Rev. Cancer 11, 411–425 - PMC - PubMed
    1. Li X., Loberg R., Liao J., Ying C., Snyder L. A., Pienta K. J., McCauley L. K. (2009) A destructive cascade mediated by CCL2 facilitates prostate cancer growth in bone. Cancer Res. 69, 1685–1692 - PMC - PubMed
    1. Loberg R. D., Ying C., Craig M., Yan L., Snyder L. A., Pienta K. J. (2007) CCL2 as an important mediator of prostate cancer growth in vivo through the regulation of macrophage infiltration. Neoplasia 9, 556–562 - PMC - PubMed
    1. Loberg R. D., Gayed B. A., Olson K. B., Pienta K. J. (2005) A paradigm for the treatment of prostate cancer bone metastases based on an understanding of tumor cell-microenvironment interactions. J. Cell. Biochem. 96, 439–446 - PubMed

Publication types