. 2014 Mar;4(1):82-102.
doi: 10.1086/674881.

PK10453, a nonselective platelet-derived growth factor receptor inhibitor, prevents the progression of pulmonary arterial hypertension

Affiliations

PK10453, a nonselective platelet-derived growth factor receptor inhibitor, prevents the progression of pulmonary arterial hypertension

Venkatrao Medarametla et al. Pulm Circ. 2014 Mar.

Abstract

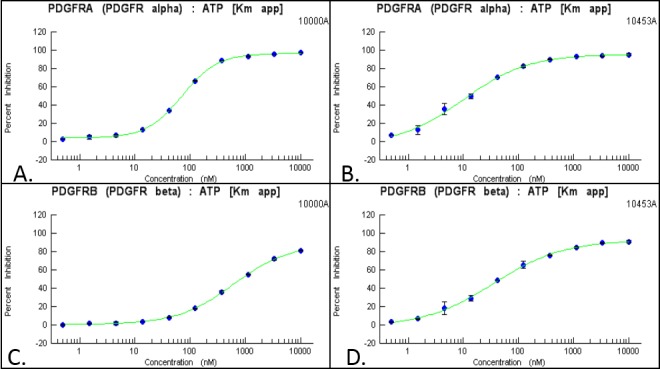
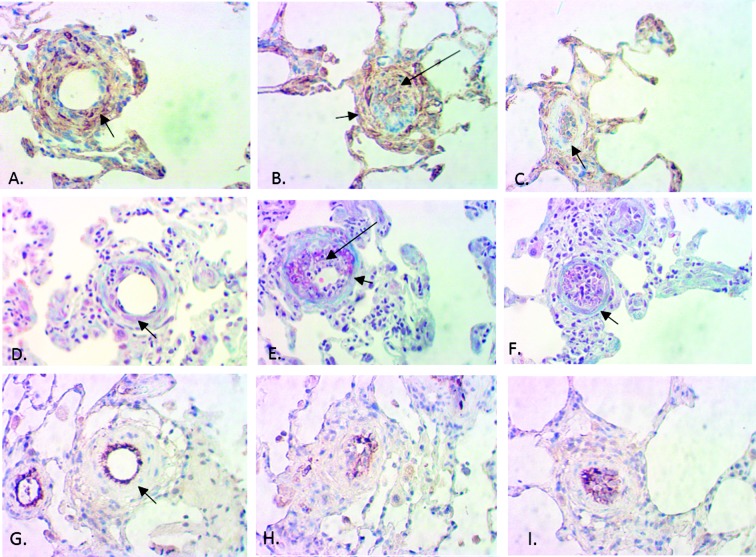
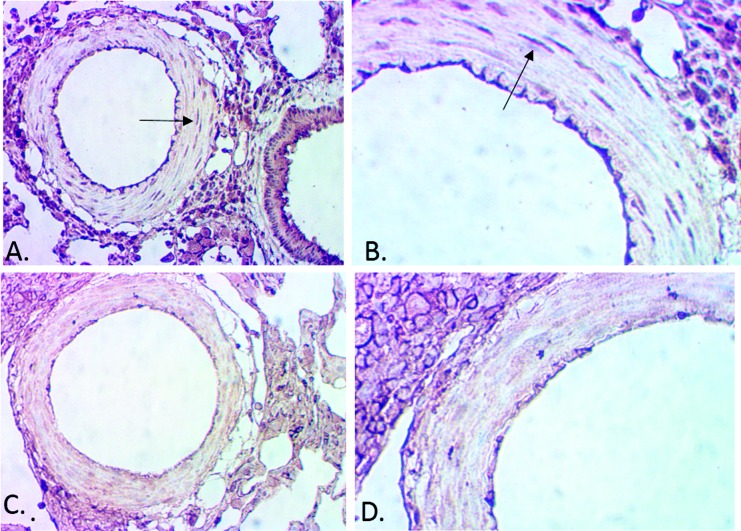
The platelet-derived growth factor (PDGF) signaling pathway has been found to be activated in human pulmonary arterial hypertension (PAH) and in animal models of the disease. Our study tested the hypothesis that a novel, nonselective inhaled PDGF receptor inhibitor, PK10453, would decrease pulmonary hypertension both in the rat monocrotaline (MCT) model and the rat MCT plus pneumonectomy (MCT+PN) model of PAH. PK10453, delivered by inhalation for 4 (D4)- and 8 (D8)-minute exposures 3 times a day for 2 weeks, decreased right ventricular systolic pressure (RVSP) in both the rat MCT and rat MCT+PN models: RVSP was 80.4 ± 2.6 mmHg in the vehicle MCT group (n = 6), 44.4 ± 5.8 mmHg in the D4 MCT group (n = 6), and 37.1 ± 4.5 mmHg in the D8 MCT group (n = 5; P < 0.001 vs. vehicle); RVSP was 75.7 ± 7.1 mmHg in the vehicle MCT+PN group (n = 9), 40.4 ± 2.7 mmHg in the D4 MCT+PN group (n = 10), and 43.0 ± 3.0 mmHg in the D8 MCT+PN group (n = 8; P < 0.001). In the rat MCT+PN model, continuous telemetry monitoring of pulmonary artery pressures also demonstrated that PK10453 prevented the progression of PAH. Imatinib given by inhalation was equally effective in the MCT model but was not effective in the MCT+PN model. Immunohistochemistry demonstrated increased activation of the PDGFβ receptor compared to the PDGFα receptor in neointimal and perivascular lesions found in the MCT+PN model. We show that imatinib is selective for the PDGFα receptor, whereas PK10453 has a lower half-maximal inhibitor concentration (IC50) for inhibition of kinase activity of both the PDGFα and PDGFβ receptors compared to imatinib. In conclusion, PK10453, when delivered by inhalation, significantly decreased the progression of PAH in the rat MCT and MCT+PN models. Nonselective inhibition of both the PDGFα and PDGFβ receptors may have a therapeutic advantage over selective PDGFα receptor inhibition in PAH.

Keywords: kinase inhibitors; platelet-derived growth factor (PDGF); pulmonary arterial hypertension.


Figures

Figure 1
Figure 1
The IC50 (half-maximal inhibitor concentration) of imatinib against PDGFRα was 71 nM (A), and that against PDGFRβ was 607 nM (C). The IC50 of PK10453 against PDGFRα was 10.1 nM (B), and that against PDGFRβ was 35 nM (D). ATP: adenosine triphosphate; Km: Michaelis-Menten constant; PDGFR: platelet-derived growth factor receptor.
Figure 2
Figure 2
In-cell Western assays (ICWs) demonstrating the lower IC50 (half-maximal inhibitor concentration) of PK10453 against PDGF BB-stimulated phosphorylation of AKT at Ser473 and Thr308, compared to that of imatinib, in human fetal lung fibroblasts (HLFs). A, B, PDGF AA stimulation of pAKT(Ser473) (A) and pAKT(Thr308) (B) in HLFs was blocked by PK10453 (squares) and imatinib (triangles), with a comparable IC50 between 0.3 and 0.6 μM. C, PDGF BB stimulation of pAKT(Ser473) was blocked by PK10453 (squares) with an IC50 of 0.13 μM, compared to 1.8 μM for imatinib (triangles). D, PDGF BB stimulation of pAKT(Thr308) was blocked by PK10453 (squares) with an IC50 of 0.43 μM, compared to 3.25 μM for imatinib (triangles). Bottom, examples of ICWs for PDGF AA- and PDGF BB-stimulated AKT phosphorylation, PK10453 versus imatinib. The signal at 800 nm is color-coded green and represents the phospho-protein-specific signal; the signal at 700 nm is color-coded red and represents signal from total AKT. In the examples shown, the 800- and 700-nm signals are superimposed. PDGF: platelet-derived growth factor. In AD, pAKT: phosphorylated AKT; tAKT: total AKT; section sign (§) indicates P < 0.01; asterisk indicates P < 0.001.
Figure 3
Figure 3
Images of frozen lung sections (right upper, middle, and lower lobes) after inhalation of PK10453+IR-780 tracer; 2-minute inhalation time. IR-780 emits at 800 nm. Image acquisition at 800 nm is color-coded green; image acquisition at 700 nm is color-coded red and represents tissue autofluorescence. Intervals of the digital ruler are 1 cm.
Figure 4
Figure 4
Pharmacokinetic advantage of inhaled over intravenous PK10453 was calculated by modeling PK10453 concentrations in lung and plasma over time. A, Concentration of PK10453 after intravenous (IV) administration (pIV), measured in plasma and lung tissue extracts. B, Concentration of PK10453 after inhalation exposure (pINH), measured in plasma and lung tissue extracts.
Figure 5
Figure 5
A, Effect of PK10453 on right ventricular (RV) systolic pressure in the rat monocrotaline (MCT) model. B, Effect of PK10453 on RV hypertrophy in the rat MCT model. The (RV + IVS)/LV weight ratio ((right ventricle + interventricular septum)/left ventricle) was compared between the groups (V: 0.787 ± 0.04; D2: 0.651 ± 0.04; D4: 0.525 ± 0.02; D8: 0.489 ± 0.02; C: 0.511 ± 0.02). Treatment groups in A, B: V (n = 6): vehicle; D2 (n = 6), D4 (n = 6), D8 (n = 5): 2-, 4-, or 8-minute exposure 3 times/day for 2 weeks; C (n = 3): normal controls. C, RV systolic pressure in the rat MCT model: comparison of PK10453 to imatinib. D, Lumen/media ratio in MCT rat model comparison of PK10453 and imatinib to vehicle: vehicle (V, n = 4): 0.55 ± 0.1; PK10453 (D8, n = 12): 0.94 ± 0.08; imatinib (I8, n = 5): 0.99 ± 0.07. In all plots, a section sign (§) indicates P < 0.05, a pound sign indicates P < 0.01, and an asterisk indicates P < 0.001.
Figure 6
Figure 6
Telemetry study in the rat monocrotaline plus pneumonectomy (MCT+PN) model. Pulmonary artery (PA) systolic pressure was measured over time in ambulatory rats. Top, PK10453; V: vehicle (n = 5); D: 4-minute exposure to PK10453 3 times/day (n = 6). Pound sign (#) indicates P < 0.01; section sign (§) indicates P < 0.05. Bottom, imatinib; V: vehicle; I: imatinib (P not significant).
Figure 7
Figure 7
Hemodynamic and morphometric analyses in the rat monocrotaline plus pneumonectomy (MCT+PN) model. A, Right ventricular (RV) systolic pressure: 75.7 ± 7.1 mmHG for V (n = 9), 40.4 ± 2.7 mmHg for D4 (n = 10), 43 ± 3.0 mmHg for D8 (n = 8); asterisks indicate P < 0.001 for V versus D4 and V versus D8. B, RV hypertrophy was decreased by treatment with PK10453. The weight ratio of (right ventricle + interventricular septum) to left ventricle ((RV + IVS)/LV) is shown; n = 11 for V, n = 13 for D4, and n = 7 for D8; asterisk indicates P < 0.001 for D4 versus V, and section sign (§) indicates P < 0.05 for D8 versus V. C, In the rat MCT+PN model, the lumen area/media area ratio was greater in the D8 (n = 5) treatment group than in the D4 (n = 6) and V (n = 6) groups; the asterisk indicates P < 0.0001 for D8 versus V and D8 versus D4. D, Occlusion analysis was performed on the same animal samples used for the lumen/media ratio analysis. This analysis showed a significant decrease in grade 2 (>50% occlusive) lesions in the D8 group; a pound sign (#) indicates P < 0.01. Treatment groups: V: vehicle only; D4: 4-minute PK10453 treatments 3 times/day for 2 weeks; D8: 8-minute PK10453 treatments 3 times/day for 2 weeks.
Figure 8
Figure 8
Effect of PK10453 on neointimal lesions in the rat monocrotaline plus pneumonectomy model. A, Hematoxylin and eosin (H&E) stain, vehicle-treated animal. B, H&E stain, PK10453-treated (8-minute exposure 3 times/week [D8]) animal. C, Phospho-PDGFRβ stain, vehicle-treated animal. D, Phospho-PDGFRβ stain, D8 animal. 40× objective. PDGFR: platelet-derived growth factor receptor.
Figure 9
Figure 9
Immunohistochemistry for alpha-smooth muscle actin (αSMC), trichrome, and von Willenbrand factor (vWF) stains showed a mixed population of endothelial and myofibroblast-like cells comprising the neointimal and proliferative lesions in pulmonary arterioles in grade 0–2 lesions. Grade 0 lesions were characterized by early intraluminal endothelial cell proliferation and the presence of vascular smooth muscle cells in the media (A, αSMC; D, trichrome; G, vWF). Grade 1–2 lesions had extensive intraluminal myofibroblast-like cells, some endothelial cells, and partial fibrosis of the medial layer (B, αSMC; E, trichrome; H, vWF). Advanced grade 2 lesions were characterized by extensive intraluminal myofibroblast-like and endothelial cell proliferation and complete fibrotic replacement of medial layer (C, αSMC; F, trichrome; I, vWF). Long arrows point to the intraluminal space with proliferative lesions, and short arrows point to the medial layer of the pulmonary arterioles. All photomicrographs were taken from a vehicle-treated animal (monocrotaline plus pneumonectomy model); 40× objective.
Figure 10
Figure 10
Platelet-derived growth factor receptor (PDGFR) signaling in the rat monocrotaline plus pneumonectomy model. A, PDGF AA in a pulmonary arteriole; B, PDGF BB; C, total PDGFRα; D, total PDGFRβ; E, phospho-PDGFRα; F, phospho-PDGFRβ. Signal intensity was greater for PDGF BB, PDGFRβ, and especially phospho-PDGFRβ than for PDGF AA, PDGFRα, and phospho-PDGFRα. The phospho-PDGFRβ signal was intense in a cobblestone pattern in neointimal proliferative and perivascular lesions. Signal intensity was relatively low in the vessel media layer. Arrows points to the vessel lumen containing proliferative lesions. All slides are from the vehicle-treated group, 40× objective.
Figure 11
Figure 11
Comparison of phospho-PDGFRα and phospho-PDGFRβ in larger pulmonary arterioles (rat monocrotaline plus pneumonectomy model). Immunohistochemistry for phospho-PDGFRα demonstrated signal in the media. Arrows in A and B point to a smooth muscle cell positive for phosho-PDGFRα (A, 20× objective; B, 40× objective). In contrast, there was very little signal in the media for phospho-PDGFRβ (C, 20× objective; D, 40× objective). Signal for phospho-PDGFRβ was noted in perivascular cells (upper left corner of C and D) and endothelial cells. PDGFR: platelet-derived growth factor receptor.
Figure 12
Figure 12
AD, NanoPro immunoassays for the monocrotaline plus pneumonectomy model: A, pAKT(Thr308) and total AKT, vehicle-treated animals; B, pAKT(Thr308) and total AKT, PK10453-treated animals; C, pAKT(Ser473) and total AKT, vehicle-treated animals; D, pAKT(Ser473) and total AKT, PK10453-treated animals. E, The pAKT(Thr308)/AKT ratio in lung extracts was not significantly different between the groups. F, The pAKT(Ser473)/AKT ratio in lung extracts was lower in the D8 group than in the V group (n = 5 for V and D8; n = 4 for D4); section sign (§) indicates P < 0.05 for D8 versus V. pAKT: phosphorylated AKT. Treatment groups in E, F: V: vehicle only; D4: 4-minute PK10453 treatments 3 times/day for 2 weeks; D8: 8-minute PK10453 treatments 3 times/day for 2 weeks.
Figure 13
Figure 13
A, B, Examples of NanoPro immunoassay lumogram for pSTAT3 and STAT3 in MCT+PN (monocrotaline plus pneumonectomy) rats (A, vehicle treated; B, PK10453 treated). C, PK10453 treatment decreased pSTAT3/STAT3 in the lungs of rats in the MCT+PN model. pSTAT3: phosphorylated signal transducer and activator of transcription 3. Treatment groups: V: vehicle only; D4: 4-minute PK10453 treatments 3 times/day for 2 weeks; D8: 8-minute PK10453 treatments 3 times/day for 2 weeks, n = 4 for each group. Asterisk indicates P < 0.01 for D4 versus V; section sign (§) indicates P < 0.05 for D8 versus V.
Figure 14
Figure 14
AD, NanoPro immunoassay lumograms for phospho-ERK1/2 and total ERK1/2 in MCT+PN (monocrotaline plus pneumonectomy) rats: A, phospho-ERK1/2 in a vehicle-treated animal; B, phospho-ERK1/2 in a PK10453-treated animal; C, total ERK1/2, vehicle-treated animal; D, total ERK1/2, PK10453-treated animal. E, F, PK10453 decreased ppERK1/ERK1 (E) and pERK1/ERK1 (F) in the lung; asterisk indicates P < 0.001 for D8 versus V; section sign (§) indicates P < 0.05 for D4 versus V. G, H, No significant effect on ppERK2/ERK2 (G) or pERK2/ERK2 (H) was found. Treatment groups in EH: V: vehicle only; D4: 4-minute PK10453 treatments 3 times/day for 2 weeks; D8: 8-minute PK10453 treatments 3 times/day for 2 weeks (n = 4 each group). In all panels, an initial “p” stands for “monophosphorylated, and “pp” stands for “diphosphorylated”; ERK1/2: extracellular signal-regulated kinase 1/2.

Similar articles

Cited by

References

    1. Perros F, Montani D, Dorfmüller P, Durand-Gasselin I, Tcherakian C, Le Pavec J, Mazmanian M, et al. Platelet-derived growth factor expression and function in idiopathic pulmonary arterial hypertension. Am J Respir Crit Care Med 2008;178:81–88. - PubMed
    1. Schermuly RT, Dony E, Ghofrani HA, Pullamsetti S, Savai R, Roth M, Sydykov A, et al. Reversal of experimental pulmonary hypertension by PDGF inhibition. J Clin Invest 2005;115:2811–2821. - PMC - PubMed
    1. Ghofrani HA, Morrell NW, Hoeper MM, Olschewski H, Peacock AJ, Barst RJ, Shapiro S, et al. Imatinib in pulmonary arterial hypertension patients with inadequate response to established therapy. Am J Respir Crit Care Med 2010;182:1171–1177. - PMC - PubMed
    1. Ghofrani HA, Seeger W, Grimminger F. Imatinib for the treatment of pulmonary arterial hypertension. N Engl J Med 2005;353:1412–1413. - PubMed
    1. Hoeper MM, Barst RJ, Bourge RC, Feldman J, Frost AE, Galiè N, Gómez-Sánchez MA, et al. Imatinib mesylate as add-on therapy for pulmonary arterial hypertension: results of the randomized IMPRES study. Circulation 2013;127:1128–1138. - PubMed