

Enhanced or reduced fetal growth induced by embryo transfer into smaller or larger breeds alters post-natal growth and metabolism in pre-weaning horses
- PMID: 25006665
- PMCID: PMC4090198
- DOI: 10.1371/journal.pone.0102044
Enhanced or reduced fetal growth induced by embryo transfer into smaller or larger breeds alters post-natal growth and metabolism in pre-weaning horses
Abstract
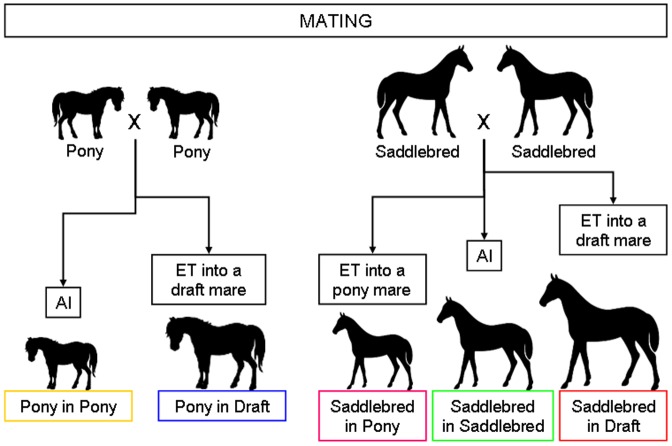
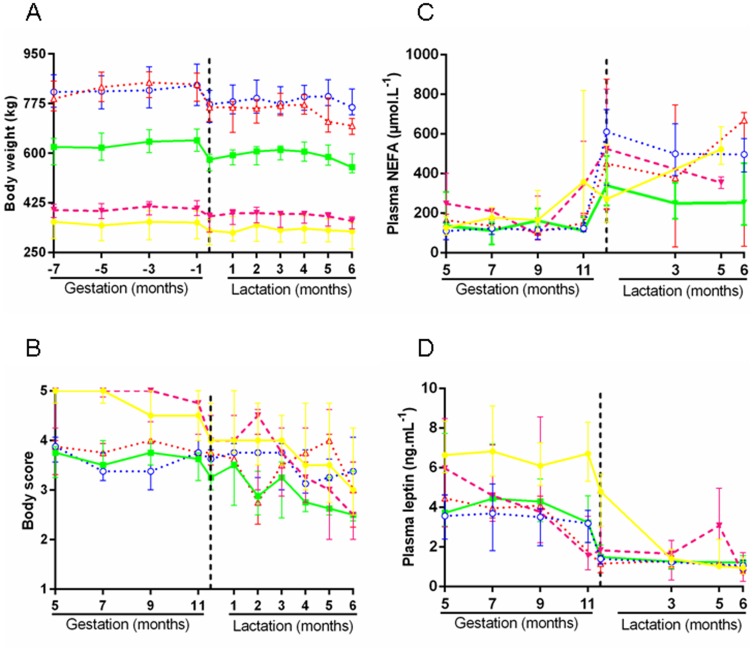
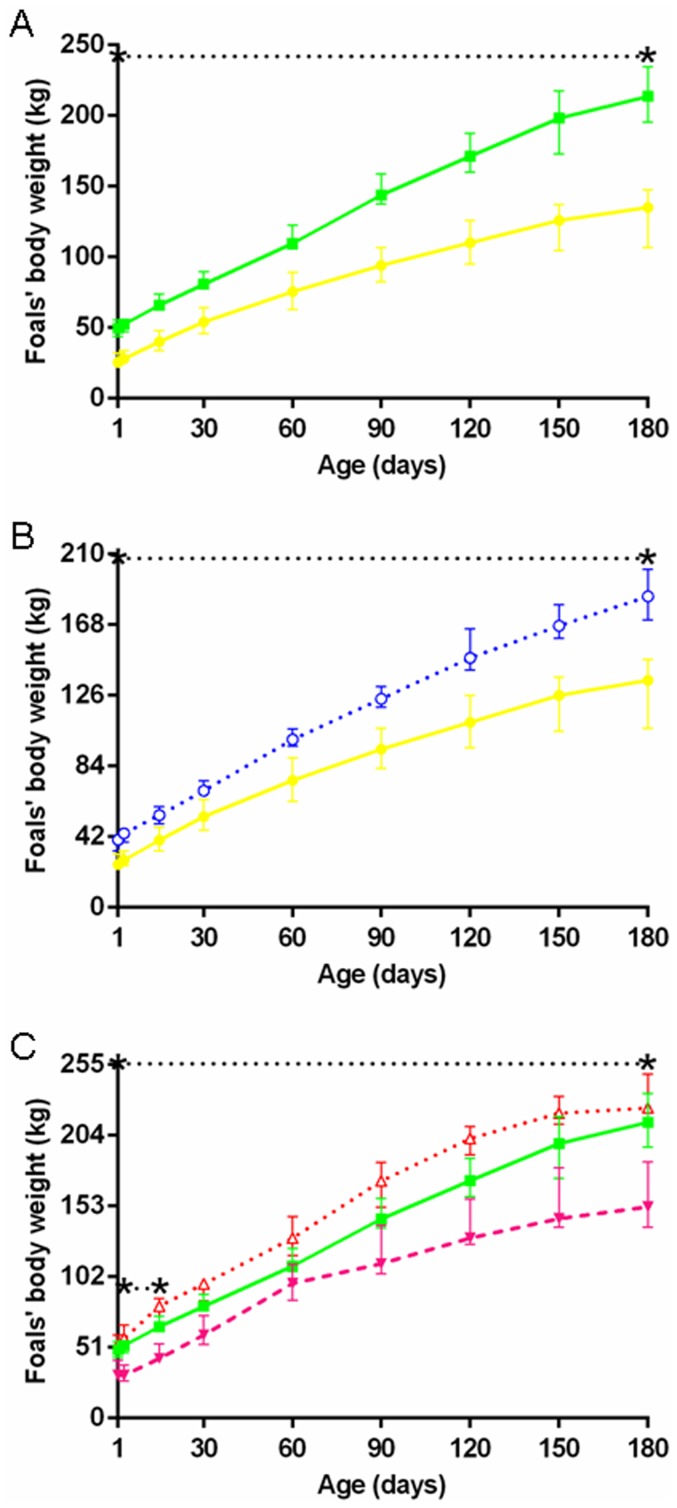
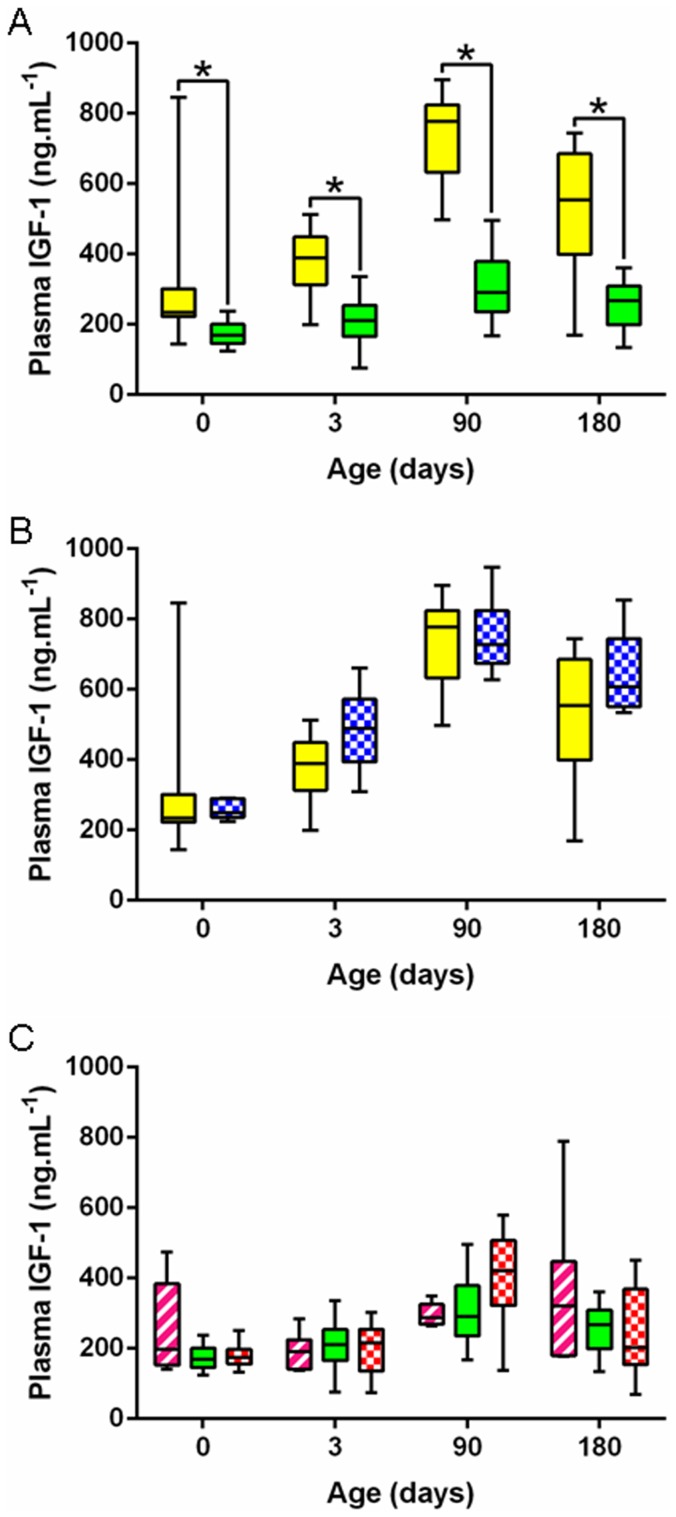
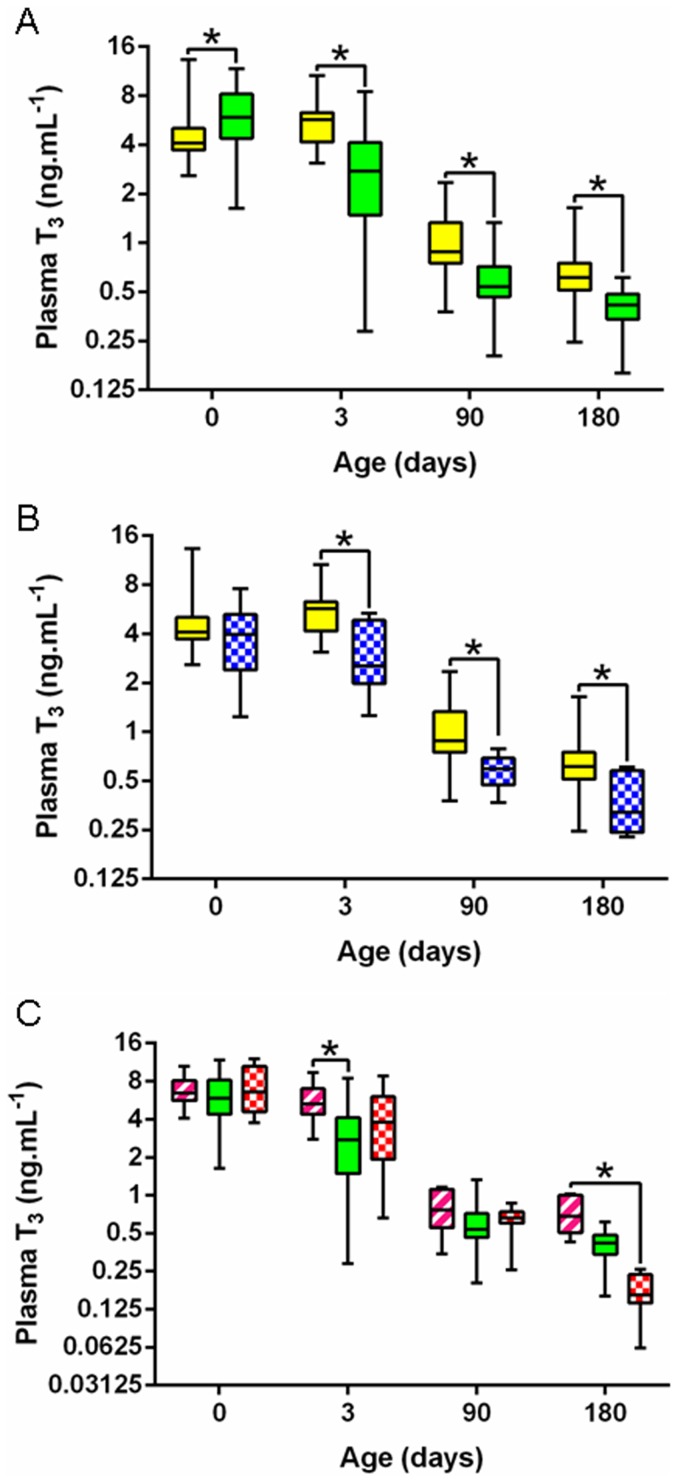
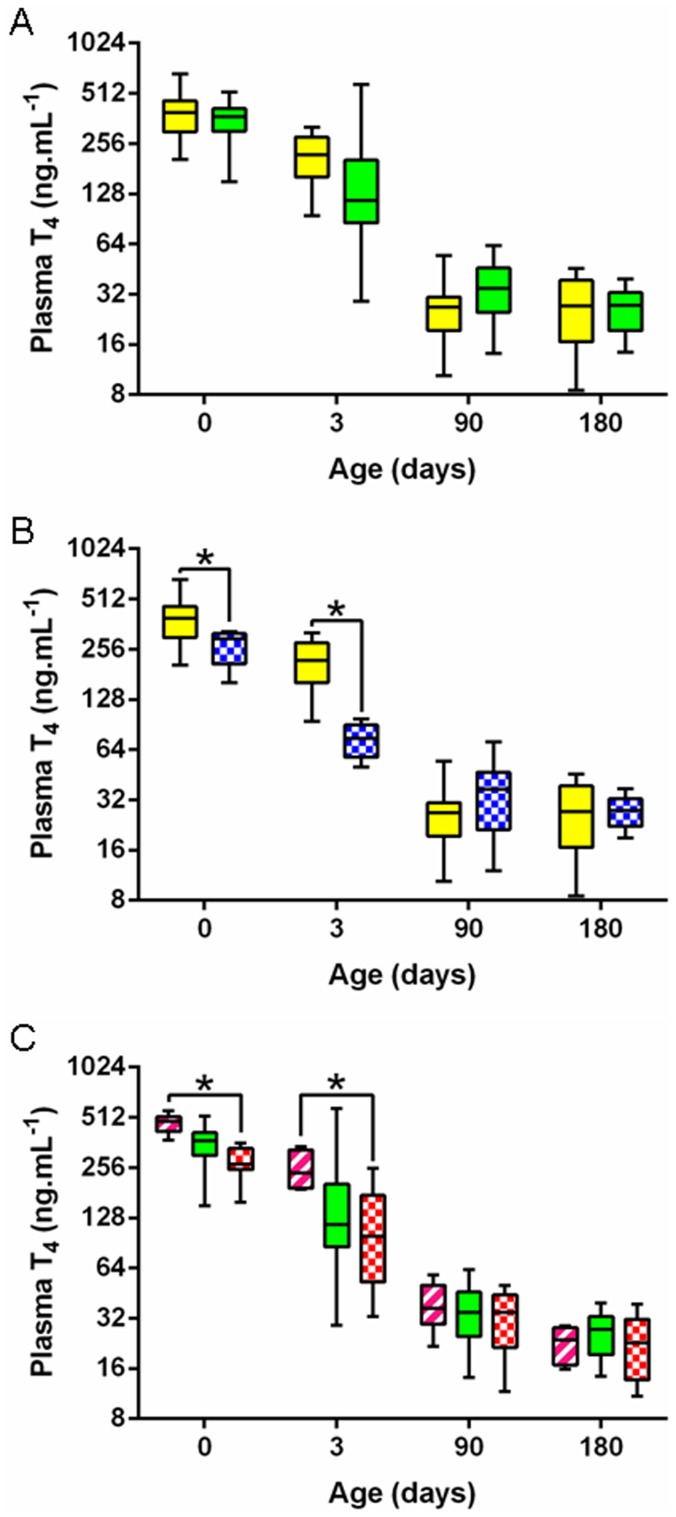
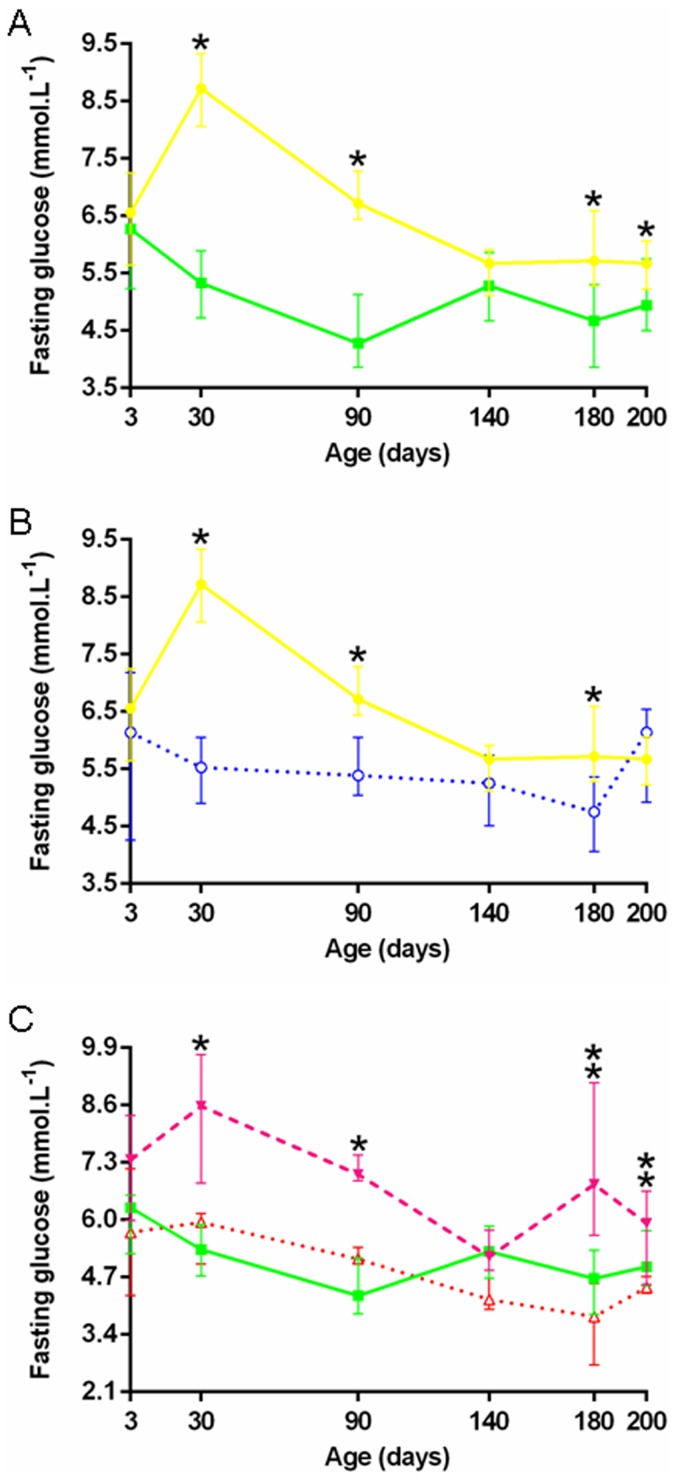
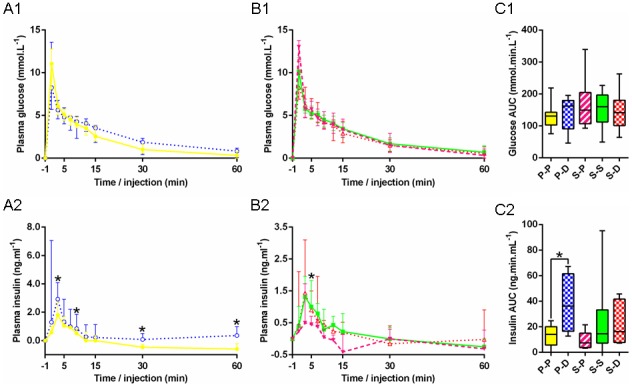
In equids, placentation is diffuse and nutrient supply to the fetus is determined by uterine size. This correlates with maternal size and affects intra-uterine development and subsequent post-natal growth, as well as insulin sensitivity in the newborn. Long-term effects remain to be described. In this study, fetal growth was enhanced or restricted through ET using pony (P), saddlebred (S) and draft (D) horses. Control P-P (n = 21) and S-S (n = 28) pregnancies were obtained by AI. Enhanced and restricted pregnancies were obtained by transferring P or S embryos into D mares (P-D, n = 6 and S-D, n = 8) or S embryos into P mares (S-P, n = 6), respectively. Control and experimental foals were raised by their dams and recipient mothers, respectively. Weight gain, growth hormones and glucose homeostasis were investigated in the foals from birth to weaning. Fetal growth was enhanced in P-D and these foals remained consistently heavier, with reduced T3 concentrations until weaning compared to P-P. P-D had lower fasting glucose from days 30 to 200 and higher insulin secretion than P-P after IVGTT on day 3. Euglycemic clamps in the immediate post-weaning period revealed no difference in insulin sensitivity between P-D and P-P. Fetal growth was restricted in S-P and these foals remained consistently lighter until weaning compared to S-D, with elevated T3 concentrations in the newborn compared to S-S. S-P exhibited higher fasting glycemia than S-S and S-D from days 30 to 200. They had higher maximum increment in plasma glucose than S-D after IVGTT on day 3 and clamps on day 200 demonstrated higher insulin sensitivity compared to S-D. Neither the restricted nor the enhanced fetal environment affected IGF-1 concentrations. Thus, enhanced and restricted fetal and post-natal environments had combined effects that persisted until weaning. They induced different adaptive responses in post-natal glucose metabolism: an early insulin-resistance was induced in enhanced P-D, while S-P developed increased insulin sensitivity.
Conflict of interest statement
Figures
Similar articles
-
Effects of moderate amounts of barley in late pregnancy on growth, glucose metabolism and osteoarticular status of pre-weaning horses.PLoS One. 2015 Apr 13;10(4):e0122596. doi: 10.1371/journal.pone.0122596. eCollection 2015. PLoS One. 2015. PMID: 25875166 Free PMC article.
-
Placental alterations in structure and function in intra-uterine growth-retarded horses.Equine Vet J. 2018 May;50(3):405-414. doi: 10.1111/evj.12761. Epub 2017 Nov 6. Equine Vet J. 2018. PMID: 28963763
-
Effects of manipulating intrauterine growth on post natal adrenocortical development and other parameters of maturity in neonatal foals.Equine Vet J. 2004 Nov;36(7):616-21. doi: 10.2746/0425164044864598. Equine Vet J. 2004. PMID: 15581327
-
Postnatal insulin secretion and sensitivity after manipulation of fetal growth by embryo transfer in the horse.J Endocrinol. 2004 Jun;181(3):459-67. doi: 10.1677/joe.0.1810459. J Endocrinol. 2004. PMID: 15171694
-
HORSE SPECIES SYMPOSIUM: Nutritional programming and the impact on mare and foal performance.J Anim Sci. 2015 Jul;93(7):3261-7. doi: 10.2527/jas.2015-9057. J Anim Sci. 2015. PMID: 26439994 Review.
Cited by
-
Maternal Nutrition during Pregnancy Affects Testicular and Bone Development, Glucose Metabolism and Response to Overnutrition in Weaned Horses Up to Two Years.PLoS One. 2017 Jan 12;12(1):e0169295. doi: 10.1371/journal.pone.0169295. eCollection 2017. PLoS One. 2017. PMID: 28081146 Free PMC article.
-
Obesity during Pregnancy in the Horse: Effect on Term Placental Structure and Gene Expression, as Well as Colostrum and Milk Fatty Acid Concentration.Vet Sci. 2023 Dec 4;10(12):691. doi: 10.3390/vetsci10120691. Vet Sci. 2023. PMID: 38133242 Free PMC article.
-
Lab partners: oocytes, embryos and company. A personal view on aspects of oocyte maturation and the development of monozygotic twins.Anim Reprod. 2023 Jul 24;20(2):e20230049. doi: 10.1590/1984-3143-AR2023-0049. eCollection 2023. Anim Reprod. 2023. PMID: 37547564 Free PMC article.
-
The effects of obesity and insulin dysregulation on mare reproduction, pregnancy, and foal health: a review.Front Vet Sci. 2023 Apr 20;10:1180622. doi: 10.3389/fvets.2023.1180622. eCollection 2023. Front Vet Sci. 2023. PMID: 37152686 Free PMC article. Review.
-
Effects of moderate amounts of barley in late pregnancy on growth, glucose metabolism and osteoarticular status of pre-weaning horses.PLoS One. 2015 Apr 13;10(4):e0122596. doi: 10.1371/journal.pone.0122596. eCollection 2015. PLoS One. 2015. PMID: 25875166 Free PMC article.
References
-
- Barker DJ, Winter PD, Osmond C, Margetts B, Simmonds SJ (1989) Weight in infancy and death from ischaemic heart disease. The Lancet 2: 577–580. - PubMed
-
- Barker DJ, Gluckman PD, Godfrey KM, Harding JE, Owens JA, et al. (1993) Fetal nutrition and cardiovascular disease in adult life. Lancet 341: 938–941. - PubMed
-
- Barker DJ, Hales CN, Fall CH, Osmond C, Phipps K, et al. (1993) Type 2 (non-insulin-dependent) diabetes mellitus, hypertension and hyperlipidaemia (syndrome X): relation to reduced fetal growth. Diabetologia 36: 62–67. - PubMed
-
- Ravelli ACJ, van der Meulen JHP, Michels RPJ, Osmond C, Barker DJP, et al. (1998) Glucose tolerance in adults after prenatal exposure to famine. The Lancet 351: 173–177. - PubMed
-
- Ravelli AC, van Der Meulen JH, Osmond C, Barker DJ, Bleker OP (1999) Obesity at the age of 50 y in men and women exposed to famine prenatally. Am J Clin Nutr 70: 811–816. - PubMed
Publication types
MeSH terms
Substances
LinkOut - more resources
Full Text Sources
Other Literature Sources
Medical
Miscellaneous
