. 2014 Dec;273(3):675-85.
doi: 10.1148/radiol.14132722. Epub 2014 Jul 7.

Digital breast tomosynthesis: observer performance of clustered microcalcification detection on breast phantom images acquired with an experimental system using variable scan angles, angular increments, and number of projection views

Affiliations

Digital breast tomosynthesis: observer performance of clustered microcalcification detection on breast phantom images acquired with an experimental system using variable scan angles, angular increments, and number of projection views

Heang-Ping Chan et al. Radiology. 2014 Dec.

Abstract

Purpose: To investigate the dependence of microcalcification cluster detectability on tomographic scan angle, angular increment, and number of projection views acquired at digital breast tomosynthesis ( DBT digital breast tomosynthesis ).

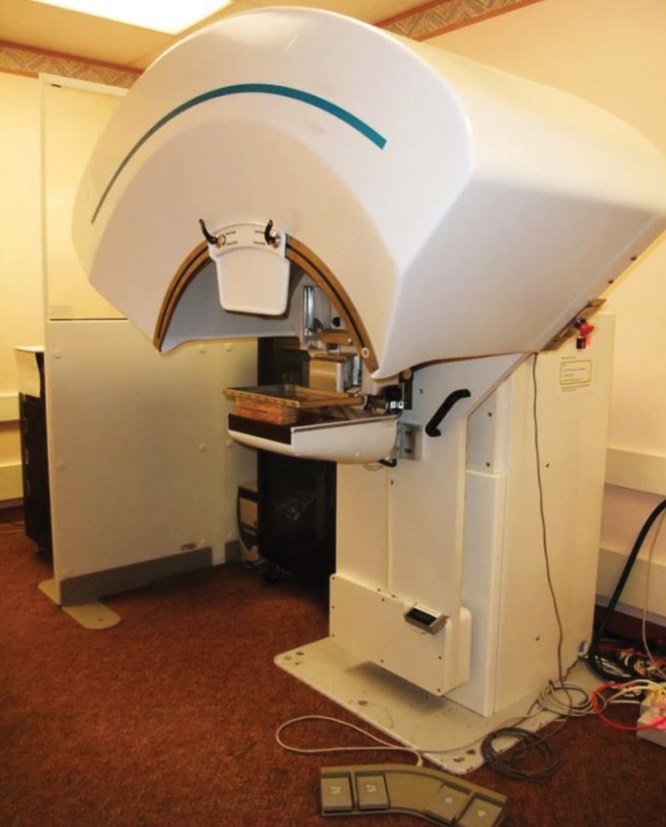
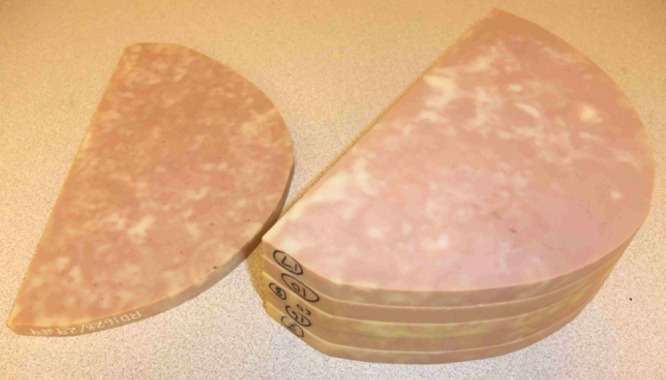
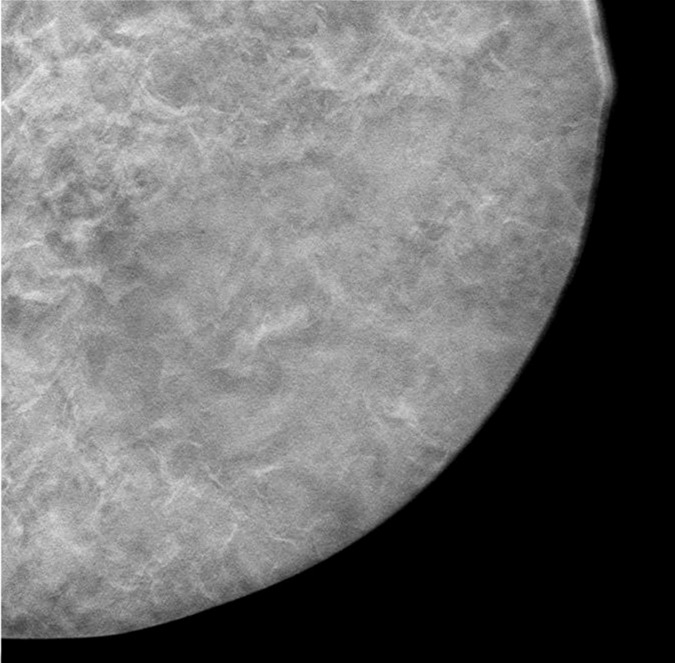
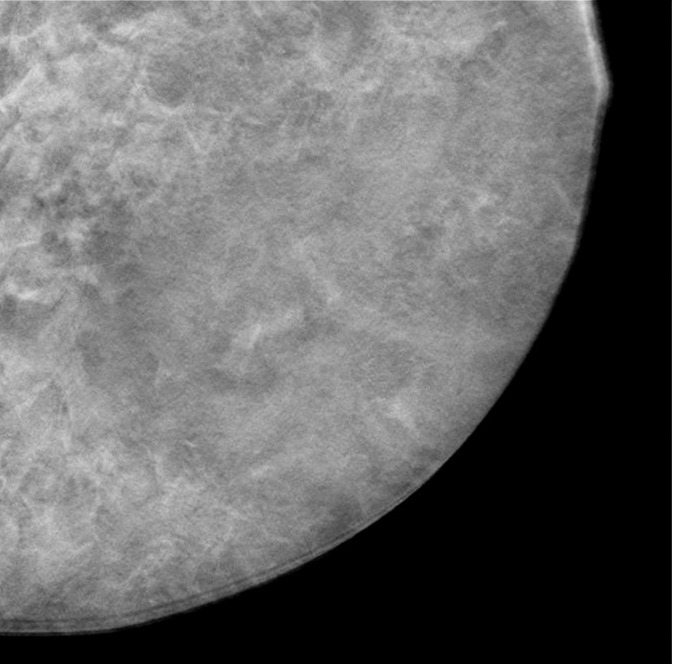
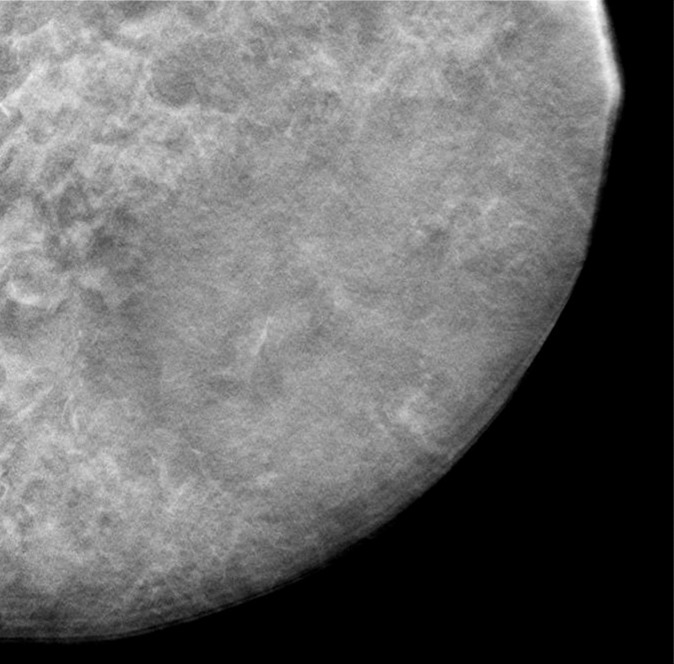
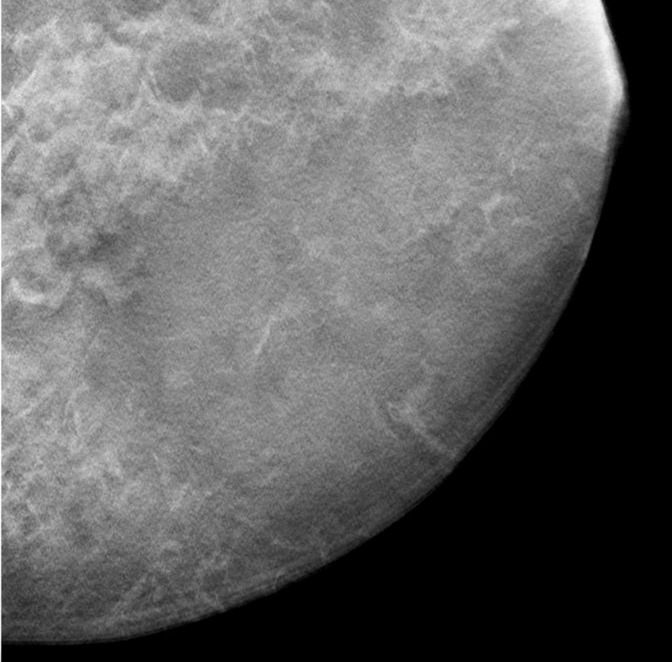
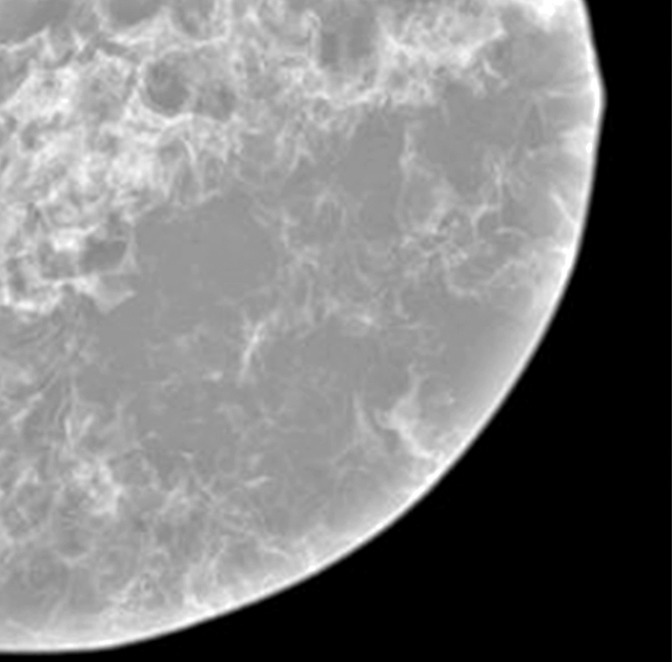
Materials and methods: A prototype DBT digital breast tomosynthesis system operated in step-and-shoot mode was used to image breast phantoms. Four 5-cm-thick phantoms embedded with 81 simulated microcalcification clusters of three speck sizes (subtle, medium, and obvious) were imaged by using a rhodium target and rhodium filter with 29 kV, 50 mAs, and seven acquisition protocols. Fixed angular increments were used in four protocols (denoted as scan angle, angular increment, and number of projection views, respectively: 16°, 1°, and 17; 24°, 3°, and nine; 30°, 3°, and 11; and 60°, 3°, and 21), and variable increments were used in three (40°, variable, and 13; 40°, variable, and 15; and 60°, variable, and 21). The reconstructed DBT digital breast tomosynthesis images were interpreted by six radiologists who located the microcalcification clusters and rated their conspicuity.

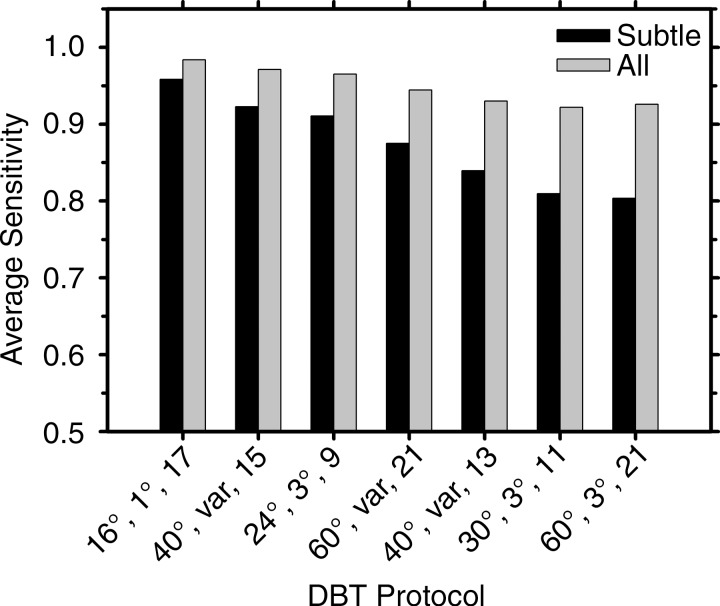
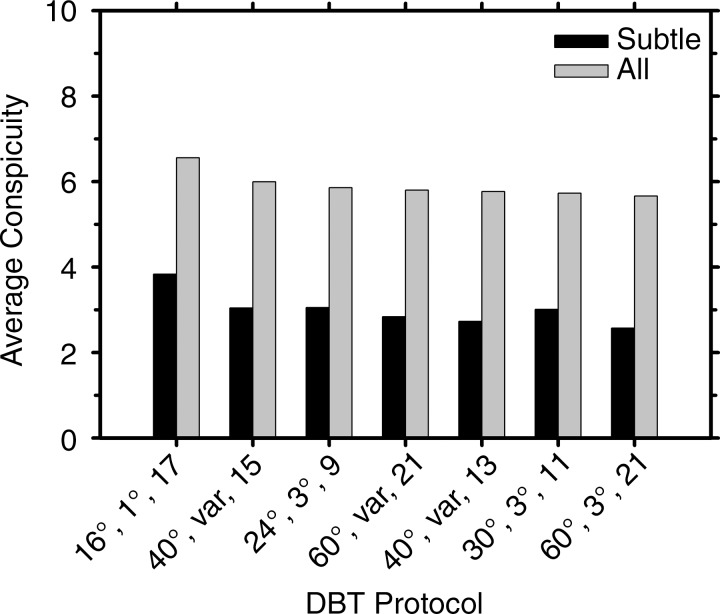
Results: The mean sensitivity for detection of subtle clusters ranged from 80% (22.5 of 28) to 96% (26.8 of 28) for the seven DBT digital breast tomosynthesis protocols; the highest sensitivity was achieved with the 16°, 1°, and 17 protocol (96%), but the difference was significant only for the 60°, 3°, and 21 protocol (80%, P < .002) and did not reach significance for the other five protocols (P = .01-.15). The mean sensitivity for detection of medium and obvious clusters ranged from 97% (28.2 of 29) to 100% (24 of 24), but the differences fell short of significance (P = .08 to >.99). The conspicuity of subtle and medium clusters with the 16°, 1°, and 17 protocol was rated higher than those with other protocols; the differences were significant for subtle clusters with the 24°, 3°, and nine protocol and for medium clusters with 24°, 3°, and nine; 30°, 3°, and 11; 60°, 3° and 21; and 60°, variable, and 21 protocols (P < .002).

Conclusion: With imaging that did not include x-ray source motion or patient motion during acquisition of the projection views, narrow-angle DBT digital breast tomosynthesis provided higher sensitivity and conspicuity than wide-angle DBT digital breast tomosynthesis for subtle microcalcification clusters.


Figures

Figure 1:
Figure 1:
Photograph shows the prototype DBT system used in this study. The phantom is shown under the compression paddle.
Figure 2:
Figure 2:
Photograph shows six slabs of 1-cm-thick breast-shape heterogeneous breast-tissue–mimicking material (CIRS) used to construct breast phantoms. Four different 5-cm-thick phantoms were formed by using five of the six slabs arranged in different orders and orientations.
Figure 3a:
Figure 3a:
(a–d) DBT sections from a 5-cm-thick breast phantom imaged with four of the DBT scan protocols: 16°, 1°, and 17; 24°, 3°, and nine; 40°, variable, and 13; and 60°, 3°, and 21, respectively. (e) A two-dimensional projection x-ray image is shown of the 1-cm-thick slab that intersected the sections in a–d. If there is no interplane blurring, the dense tissue distribution in a–d should be similar to or even slightly cleaner than that in e, which is a superimposition of all overlapping structures inside the 10-mm-thick slab. Images a–d show that the larger the scan angle, the more similar the dense tissue distribution on the DBT sections is to that on the two-dimensional image. The additional dense tissue structures seen on the DBT sections resulted from interplane blurring from the other slabs sandwiching this slab.
Figure 3b:
Figure 3b:
(a–d) DBT sections from a 5-cm-thick breast phantom imaged with four of the DBT scan protocols: 16°, 1°, and 17; 24°, 3°, and nine; 40°, variable, and 13; and 60°, 3°, and 21, respectively. (e) A two-dimensional projection x-ray image is shown of the 1-cm-thick slab that intersected the sections in a–d. If there is no interplane blurring, the dense tissue distribution in a–d should be similar to or even slightly cleaner than that in e, which is a superimposition of all overlapping structures inside the 10-mm-thick slab. Images a–d show that the larger the scan angle, the more similar the dense tissue distribution on the DBT sections is to that on the two-dimensional image. The additional dense tissue structures seen on the DBT sections resulted from interplane blurring from the other slabs sandwiching this slab.
Figure 3c:
Figure 3c:
(a–d) DBT sections from a 5-cm-thick breast phantom imaged with four of the DBT scan protocols: 16°, 1°, and 17; 24°, 3°, and nine; 40°, variable, and 13; and 60°, 3°, and 21, respectively. (e) A two-dimensional projection x-ray image is shown of the 1-cm-thick slab that intersected the sections in a–d. If there is no interplane blurring, the dense tissue distribution in a–d should be similar to or even slightly cleaner than that in e, which is a superimposition of all overlapping structures inside the 10-mm-thick slab. Images a–d show that the larger the scan angle, the more similar the dense tissue distribution on the DBT sections is to that on the two-dimensional image. The additional dense tissue structures seen on the DBT sections resulted from interplane blurring from the other slabs sandwiching this slab.
Figure 3d:
Figure 3d:
(a–d) DBT sections from a 5-cm-thick breast phantom imaged with four of the DBT scan protocols: 16°, 1°, and 17; 24°, 3°, and nine; 40°, variable, and 13; and 60°, 3°, and 21, respectively. (e) A two-dimensional projection x-ray image is shown of the 1-cm-thick slab that intersected the sections in a–d. If there is no interplane blurring, the dense tissue distribution in a–d should be similar to or even slightly cleaner than that in e, which is a superimposition of all overlapping structures inside the 10-mm-thick slab. Images a–d show that the larger the scan angle, the more similar the dense tissue distribution on the DBT sections is to that on the two-dimensional image. The additional dense tissue structures seen on the DBT sections resulted from interplane blurring from the other slabs sandwiching this slab.
Figure 3e:
Figure 3e:
(a–d) DBT sections from a 5-cm-thick breast phantom imaged with four of the DBT scan protocols: 16°, 1°, and 17; 24°, 3°, and nine; 40°, variable, and 13; and 60°, 3°, and 21, respectively. (e) A two-dimensional projection x-ray image is shown of the 1-cm-thick slab that intersected the sections in a–d. If there is no interplane blurring, the dense tissue distribution in a–d should be similar to or even slightly cleaner than that in e, which is a superimposition of all overlapping structures inside the 10-mm-thick slab. Images a–d show that the larger the scan angle, the more similar the dense tissue distribution on the DBT sections is to that on the two-dimensional image. The additional dense tissue structures seen on the DBT sections resulted from interplane blurring from the other slabs sandwiching this slab.
Figure 4:
Figure 4:
Graph shows mean sensitivities for detection of the subtle clusters and for all clusters, averaged over the six radiologists, for the seven DBT protocols. The labels of the abscissa indicate the parameters of the DBT protocols denoted in the following order: tomographic angle, angular increment, and number of projections.
Figure 5:
Figure 5:
Graph shows mean conspicuity ratings for the subtle clusters and for all clusters, averaged over the six radiologists, for the seven DBT protocols. The labels of the abscissa indicate the parameters of the DBT protocols denoted in the following order: tomographic angle, angular increment, and number of projections.
Figure 6:
Figure 6:
A–L, Images demonstrate examples of the clusters of the three speck size ranges, imaged with four different DBT protocols. Top row: subtle cluster (speck size range, 0.15–0.18 mm); middle row: medium cluster (speck size range, 0.18–0.25 mm); and bottom row: obvious cluster (speck size range, 0.25–0.30 mm). Protocols were as follows: left column, 16°, 1°, and 17; second column, 24°, 3°, and nine; third column, 40°, variable, and 13; and fourth column, 60°, 3°, and 21. Each cluster is shown in a region of interest with an area of 2 × 2 cm on the reconstructed DBT section where the cluster is in best focus.

Comment in

Similar articles

Cited by

References

    1. Niklason LT, Christian BT, Niklason LE, et al. . Digital tomosynthesis in breast imaging. Radiology 1997;205(2):399–406. - PubMed
    1. Poplack SP, Tosteson TD, Kogel CA, Nagy HM. Digital breast tomosynthesis: initial experience in 98 women with abnormal digital screening mammography. AJR Am J Roentgenol 2007;189(3):616–623. - PubMed
    1. Gur D, Abrams GS, Chough DM, et al. . Digital breast tomosynthesis: observer performance study. AJR Am J Roentgenol 2009;193(2):586–591. - PubMed
    1. Rafferty EA, Park JM, Philpotts LE, et al. . Assessing radiologist performance using combined digital mammography and breast tomosynthesis compared with digital mammography alone: results of a multicenter, multireader trial. Radiology 2013;266(1):104–113. - PMC - PubMed
    1. Skaane P, Bandos AI, Gullien R, et al. . Comparison of digital mammography alone and digital mammography plus tomosynthesis in a population-based screening program. Radiology 2013;267(1):47–56. - PubMed

Publication types

MeSH terms

LinkOut - more resources