Opinion dynamics with confirmation bias
- PMID: 25007078
- PMCID: PMC4090078
- DOI: 10.1371/journal.pone.0099557
Opinion dynamics with confirmation bias
Abstract
Background: Confirmation bias is the tendency to acquire or evaluate new information in a way that is consistent with one's preexisting beliefs. It is omnipresent in psychology, economics, and even scientific practices. Prior theoretical research of this phenomenon has mainly focused on its economic implications possibly missing its potential connections with broader notions of cognitive science.
Methodology/principal findings: We formulate a (non-Bayesian) model for revising subjective probabilistic opinion of a confirmationally-biased agent in the light of a persuasive opinion. The revision rule ensures that the agent does not react to persuasion that is either far from his current opinion or coincides with it. We demonstrate that the model accounts for the basic phenomenology of the social judgment theory, and allows to study various phenomena such as cognitive dissonance and boomerang effect. The model also displays the order of presentation effect-when consecutively exposed to two opinions, the preference is given to the last opinion (recency) or the first opinion (primacy) -and relates recency to confirmation bias. Finally, we study the model in the case of repeated persuasion and analyze its convergence properties.
Conclusions: The standard Bayesian approach to probabilistic opinion revision is inadequate for describing the observed phenomenology of persuasion process. The simple non-Bayesian model proposed here does agree with this phenomenology and is capable of reproducing a spectrum of effects observed in psychology: primacy-recency phenomenon, boomerang effect and cognitive dissonance. We point out several limitations of the model that should motivate its future development.
Conflict of interest statement
Figures

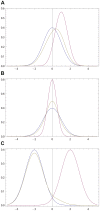
 is described by Gaussian probability density p(x) (blue curve) centered at zero; see (17). The opinion of
  amounts to Gaussian probability density q(x) (purple curve) centered at a positive value. For all three figures continuous density f(x) (
 ) were approximated by 100 points
  ,
,  . The resulting opinion
  of
of  is given by (16) with
  (olive curve). (a) The opinion of
  moves towards that of
  ;
;  ,
,  ,
,  ,
,  . (b) The maximally probable opinion of
  is reinforced;
  ,
,  ,
,  ,
,  . (c) The change of the opinion of
  is relatively small provided that the Gaussian densities overlap only in the region of non-commitment; cf. (18), (19). Whenever the densities overlap only within the rejection range the difference between p(x) and
  is not visible by eyes. For example, if p(x) and q(x) are Gaussian with, respectively,
  ,
,  ,
,  , the Hellinger distance (see (30) for definition)
  is close to maximally far, while the opinion change is small:
  .
.
 given by (28) with b = 1. Purple curve: the opinion of
  described by (28) with
  . Olive curve: the resulting opinion of
  obtained via (16) with
  .
.
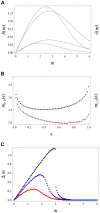
 between the old and new opinion of
  (blue curves); see (30) for the definition. For comparison we also include the total variance distance
  (purple curves); see (33). These two distances are plotted versus the discrepancy
  . The initial opinion of the agent
  is Gaussian with
  and
and  ; see (17). The opinion of
  is Gaussian with
  and
and  . Thus m quantifies the initial distance between the opinions of
  and
and  . The final opinion
  is given by (13). Different curves correspond to different
  . Blue curves:
  for
for  (upper curve) and
  (lower curve). Purple curves:
  for
for  (upper curve) and
  (lower curve). The maximum of h(m) (
 ) is reached at
  (
( ). (b)
  (
( ) is the point where h(m) (
 ) achieves its maximum as a function of m. Blues points:
  versus
  for same parameters as in (a).
  grows both for
  and
and  , e.g.
  ,
,  ,
,  ,
,  . Purple points:
  versus
  for same parameters as in (a). (c) The difference of the anchors (maximally probable values)
  versus
  for the initial opinions of
  and
and  given by (17) under
  ,
,  ,
,  and
and  . The final opinion
  of
of  (and its maximally probable value
  ) if found from (13) under
  (black points),
  (blue points) and
  (red points).
 is described by Gaussian probability density p(x) with
  and
and  ; see (17). Purple (resp. olive) curve: the initial opinion of
  (resp.
  ) are given by (17) with
  (resp.
  ) and
) and  (resp.
  ). Green curve: the resulting opinion of
  after interacting first with
  and then with
  . Both interactions use
  . The final opinion of
  is inclined to the most recent opinion (that of
  ) both with respect to its maximally probable value and distance. The final opinion of
  has a larger width than the initial one.
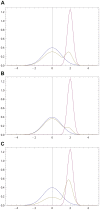
 (resp.
  ) described by probability density p(x) (resp. q(x)). Olive curve: the final opinion
  of
of  as given by (16) with
  . Here p(x) and q(x) are defined by (17) with
  ,
,  ,
,  ,
,  . The final opinion develops two peaks of comparable height (cognitive dissonance). (b) Avoiding the cognitive dissonance due to a larger
  : the second peak is much smaller (other parameters are those of (a)). (c) Avoiding the cognitive dissonance due to a smaller
  : the first peak is much smaller (other parameters are those of (a)).
 (resp.
  ) described by probability density p(x) (resp. q(x)). Olive curve: the final opinion
  of
of  given by (16) with
  . Here p(x) and q(x) are given by (17) with
  and
and  . The anchor (maximally probable opinion) of
  not only moves away from the anchor of
  ; but it is also enhanced: the (biggest) peak of
  is larger than that of p(x). The second (smaller) peak of
  arises because the initial probability of
  located to the right from the anchor
  of
of  , moves away from
  ;
;  gets a local minimum close to
  .
.
 (boomerang regime). Now the final opinion of
  is inclined to the first opinion (that of
  ) with respect to the distance. The initial maximally probable opinion of
  is still maximally probable. Moreover, its probability has increased and the width around it has decreased. The final opinion has 3 peaks.
 given by (50, 51) versus
  .
.
 (resp.
  ) described by probability density p(x) (resp. q(x)) as given by (17) with
  ,
,  ,
,  . Olive curve: the opinion of
  after 50 iterations (52) with
  .
.Similar articles
-
Collective opinion formation model under Bayesian updating and confirmation bias.Phys Rev E Stat Nonlin Soft Matter Phys. 2013 Jun;87(6):062123. doi: 10.1103/PhysRevE.87.062123. Epub 2013 Jun 18. Phys Rev E Stat Nonlin Soft Matter Phys. 2013. PMID: 23848643
-
[Cognitive explanations of auditory verbal hallucinations in schizophrenia: An inventory of the scientific literature].Encephale. 2020 Jun;46(3):217-221. doi: 10.1016/j.encep.2019.11.010. Epub 2020 Mar 7. Encephale. 2020. PMID: 32156419 Review. French.
-
The Undecided Have the Key: Interaction-Driven Opinion Dynamics in a Three State Model.PLoS One. 2015 Oct 5;10(10):e0139572. doi: 10.1371/journal.pone.0139572. eCollection 2015. PLoS One. 2015. PMID: 26436421 Free PMC article.
-
Motivated resistance and openness to persuasion in the presence or absence of prior information.J Pers Soc Psychol. 1993 Nov;65(5):861-76. doi: 10.1037//0022-3514.65.5.861. J Pers Soc Psychol. 1993. PMID: 8246114
-
A practitioner's guide to persuasion: an overview of 15 selected persuasion theories, models and frameworks.Patient Educ Couns. 2009 Mar;74(3):309-17. doi: 10.1016/j.pec.2008.12.003. Epub 2009 Jan 10. Patient Educ Couns. 2009. PMID: 19136229 Review.
Cited by
-
Emergence of metapopulations and echo chambers in mobile agents.Sci Rep. 2016 Aug 30;6:31834. doi: 10.1038/srep31834. Sci Rep. 2016. PMID: 27572928 Free PMC article.
-
Bounded Confidence under Preferential Flip: A Coupled Dynamics of Structural Balance and Opinions.PLoS One. 2016 Oct 7;11(10):e0164323. doi: 10.1371/journal.pone.0164323. eCollection 2016. PLoS One. 2016. PMID: 27716815 Free PMC article.
-
Cadaver Dissection Experience for First-Time Dissectors: a Hypothetical Three-Pronged Approach for Student Preparation.Med Sci Educ. 2023 Nov 29;34(1):257-269. doi: 10.1007/s40670-023-01950-5. eCollection 2024 Feb. Med Sci Educ. 2023. PMID: 38510414 Free PMC article. Review.
-
COVID-19: The Pseudo-Environment and the Need for a Paradigm Change.Germs. 2021 Dec 29;11(4):468-477. doi: 10.18683/germs.2021.1283. eCollection 2021 Dec. Germs. 2021. PMID: 35096665 Free PMC article. No abstract available.
-
Update of Diagnosis and Targeted Therapy for ALK+ Inflammation Myofibroblastic Tumor.Curr Treat Options Oncol. 2023 Dec;24(12):1683-1702. doi: 10.1007/s11864-023-01144-6. Epub 2023 Nov 8. Curr Treat Options Oncol. 2023. PMID: 37938503 Free PMC article. Review.
References
-
- Abelson RP (1986) Beliefs are like possessions. Journal for the Theory of Social Behaviour 16: 223–250.
-
- Akerlof G, Dickens WT (1982) The economic consequences of cognitive dissonance. Amer. Econ. Rev. 72: 307–319.
-
- Alchourrón CE, Gärdenfors G, Makinsin D (1985) On the logic of theory change. J. Symb. Logic 50: 510–530.
-
- Allahverdyan AE, Galstyan A (2011) Le Chatelier principle in replicator dynamics. Physical Review E 84: 041117. - PubMed
-
- Allakhverdov VM, Gershkovich VA (2010) Does consciousness exist? in what sense? Integrative Psychological and Behavioral Science 44: 340–347. - PubMed
Publication types
MeSH terms
LinkOut - more resources
Full Text Sources
Other Literature Sources

