. 2014 Jul 9;9(7):e100887.
doi: 10.1371/journal.pone.0100887. eCollection 2014.

Large scale analysis of phenotype-pathway relationships based on GWAS results

Affiliations

Large scale analysis of phenotype-pathway relationships based on GWAS results

Aharon Brodie et al. PLoS One. .

Abstract

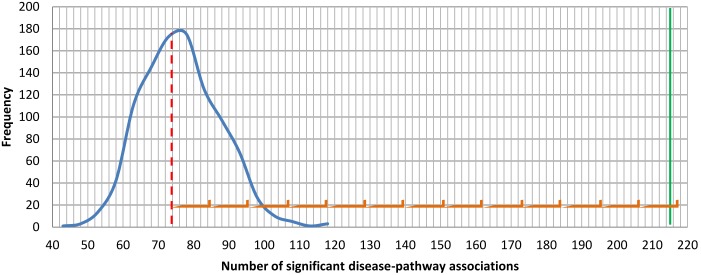
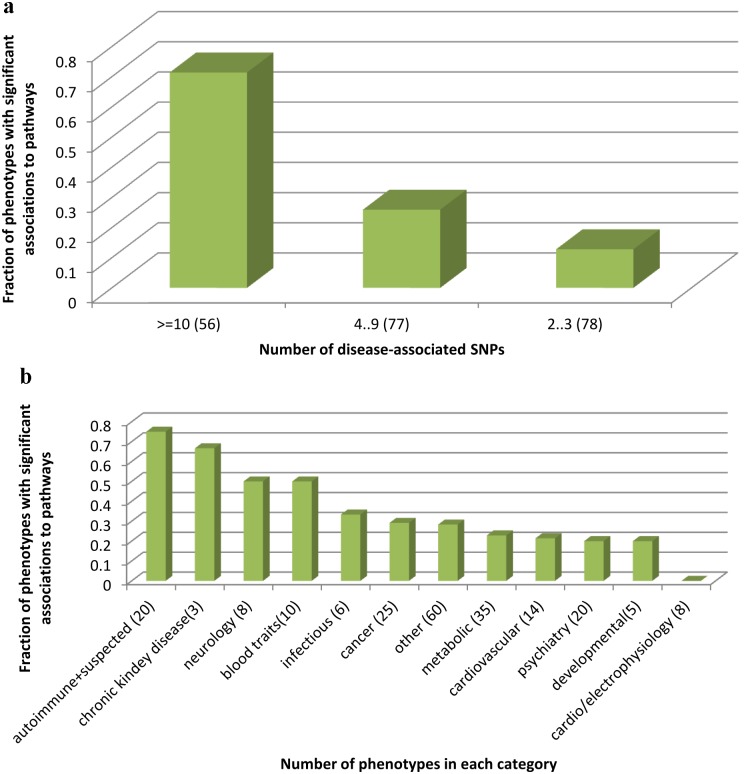
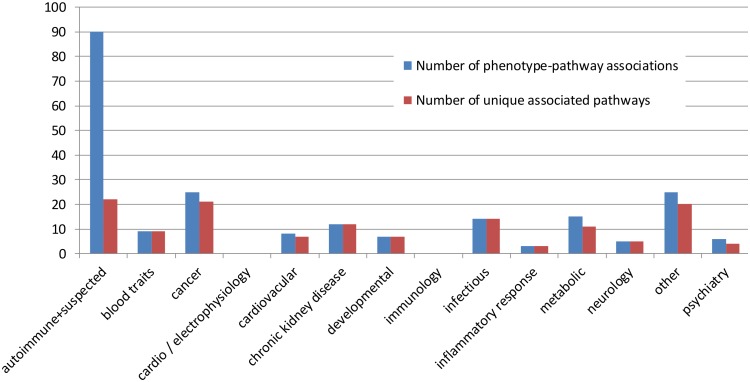
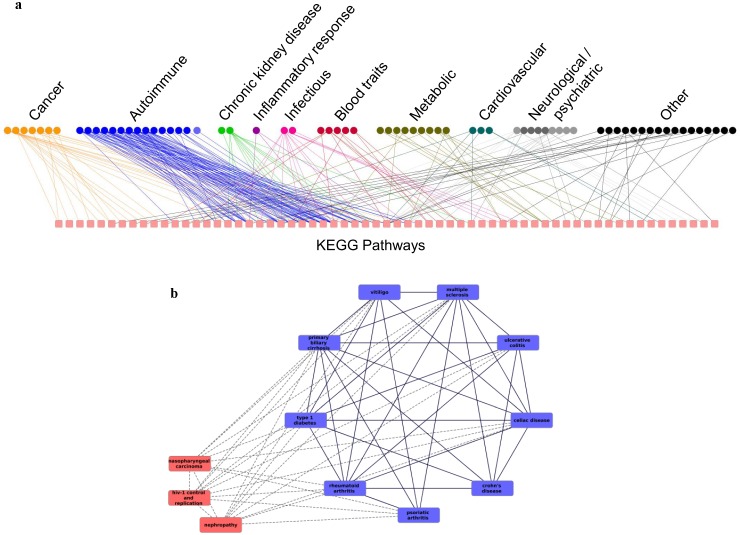
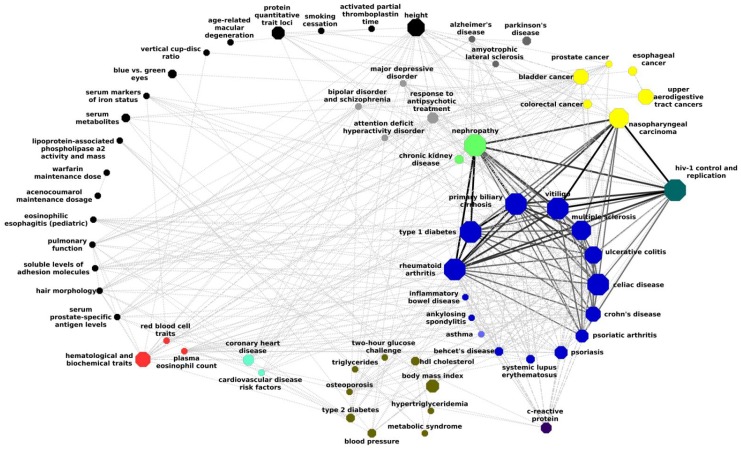
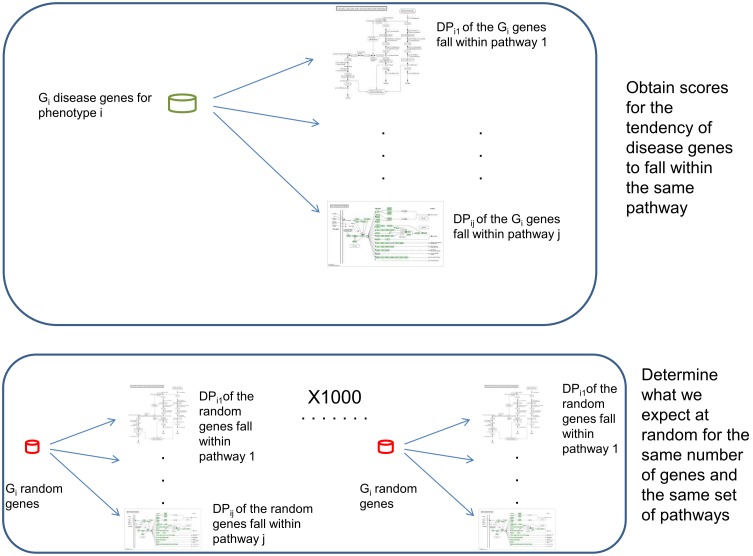
The widely used pathway-based approach for interpreting Genome Wide Association Studies (GWAS), assumes that since function is executed through the interactions of multiple genes, different perturbations of the same pathway would result in a similar phenotype. This assumption, however, was not systemically assessed on a large scale. To determine whether SNPs associated with a given complex phenotype affect the same pathways more than expected by chance, we analyzed 368 phenotypes that were studied in >5000 GWAS. We found 216 significant phenotype-pathway associations between 70 of the phenotypes we analyzed and known pathways. We also report 391 strong phenotype-phenotype associations between phenotypes that are affected by the same pathways. While some of these associations confirm previously reported connections, others are new and could shed light on the molecular basis of these diseases. Our findings confirm that phenotype-associated SNPs cluster into pathways much more than expected by chance. However, this is true for <20% (70/368) of the phenotypes. Different types of phenotypes show markedly different tendencies: Virtually all autoimmune phenotypes show strong clustering of SNPs into pathways, while most cancers and metabolic conditions, and all electrophysiological phenotypes, could not be significantly associated with any pathway despite being significantly associated with a large number of SNPs. While this may be due to missing data, it may also suggest that these phenotypes could result only from perturbations of specific genes and not from other perturbations of the same pathway. Further analysis of pathway-associated versus gene-associated phenotypes is, therefore, needed in order to understand disease etiology and in order to promote better drug target selection.


Conflict of interest statement

Competing Interests: This study was funded, in part, by Microsoft Research. The authors confirm that this does not alter their adherence to all the PLOS ONE policies on sharing data and materials, as detailed online in the guide for authors.

Figures

Figure 1
Figure 1. Number of significant phenotype-pathway associations.
Curve depicts the distribution of significant phenotype-pathway associations through 1,000 instances of multiple testing runs. X-axis represents the number of phenotype-pathway associations, while the Y-axis represents the frequency. The solid line depicts the real number of phenotype-pathway associations (216), while the dashed line depicts the median of all multiple testing runs (74 phenotype-pathway associations). Any value above the dotted line is significant (0.05). The observed number of phenotype-pathway associations is 12.7 standard deviations above the mean.
Figure 2
Figure 2. Tendency of different classes of phenotypes to have their SNPs cluster into pathway.
X-axis presents phenotypes grouped by categories, while Y-axis represents what fraction of the conditions in this category had at least one significant association with pathways. A. Conditions are grouped according to the number of disease SNPs they have (that is SNPs that are significantly associated with the phenotype). Phenotypes for which GWAS found more phenotype SNPs are more likely to be significantly associated with pathways. B. Phenotypes are grouped according to types. Autoimmune diseases have a high tendency to cluster to pathways, while other categories, such as psychiatry and metabolic related phenotypes, much less so.
Figure 3
Figure 3. Correlations between number of patients, number of genes and number of pathways.
The correlations between the number of individuals in GWAS studies, the number of genes that were found to be significantly associated with the phenotype and the number of pathways significantly associated with the phenotype. A. Weak correlation between size of case-control studies and number of pathways significantly associated with phenotypes (Pearson correlation = 0.28). B. Correlation between number of phenotype-gene associations and size of case-control studies (Pearson correlation = 0.59). C. Correlation between number of phenotype-gene associations and number of significant phenotype-pathway associations (Pearson correlation = 0.58).
Figure 4
Figure 4. Number of associations and number of unique pathways for different classes of phenotypes.
On the Y-axis is the number of pathways and on the X-axis are the classes of phenotypes. In most classes of phenotypes the number of associations found between the phenotypes and pathways is virtually identical to the number of unique pathways associated with the phenotypes in that class. Autoimmune diseases, however, have 90 associations with only 22 pathways.
Figure 5
Figure 5. Network representations of phenotype-pathway and phenotype-phenotype associations.
A. Each node on the top row of this bipartite graph represents a phenotype. Each square on the bottom row represents a pathway. Autoimmune diseases tend to associate with the same pathways while other classes of phenotypes associate with different pathways B. Nodes represent phenotypes. An edge indicates that both phenotypes are significantly associated with at least 3 common pathways. Blue nodes are autoimmune phenotypes while red nodes are non-autoimmune. Solid lined links are between two autoimmune phenotypes while dotted lines show links to other phenotypes.
Figure 6
Figure 6. Large scale network representation of phenotype-phenotype associations.
This network was created by all 391 phenotype-phenotype associations based on significantly associated phenotype-pathway associations of the entire GWAS dataset.
Figure 7
Figure 7. The procedure for assessing significance of phenotype-pathway associations.
For phenotype i and we counted how many of the genes associated with it fall within each of 198 KEGG pathways. A pathway was said to be significantly associated with a phenotype if this number was significantly higher than expected by chance. To determine what is expected by chance, we randomly sampled the same number of genes 1,000 times.

Similar articles

Cited by

References

    1. Peng G, Luo L, Siu H, Zhu Y, Hu P, et al. (2010) Gene and pathway-based second-wave analysis of genome-wide association studies. European journal of human genetics: EJHG 18: 111–117. - PMC - PubMed
    1. Fridley BL, Jenkins GD, Biernacka JM (2010) Self-Contained Gene-Set Analysis of Expression Data: An Evaluation of Existing and Novel Methods. PLOS ONE 5. - PMC - PubMed
    1. Subramanian A, Tamayo P, Mootha VK, Mukherjee S, Ebert BL, et al. (2005) Gene set enrichment analysis: a knowledge-based approach for interpreting genome-wide expression profiles. Proc Natl Acad Sci U S A 102: 15545–15550. - PMC - PubMed
    1. Hindorff LA, Sethupathy P, Junkins HA, Ramos EM, Mehta JP, et al. (2009) Potential etiologic and functional implications of genome-wide association loci. Proc Natl Acad Sci U S A 106: 9362–9367. - PMC - PubMed
    1. Naeem H, Zimmer R, Tavakkolkhah P, Kuffner R (2012) Rigorous assessment of gene set enrichment tests. Bioinformatics. England. 1480–1486. - PubMed

Publication types

LinkOut - more resources