

Transpinal and transcortical stimulation alter corticospinal excitability and increase spinal output
- PMID: 25007330
- PMCID: PMC4090164
- DOI: 10.1371/journal.pone.0102313
Transpinal and transcortical stimulation alter corticospinal excitability and increase spinal output
Abstract
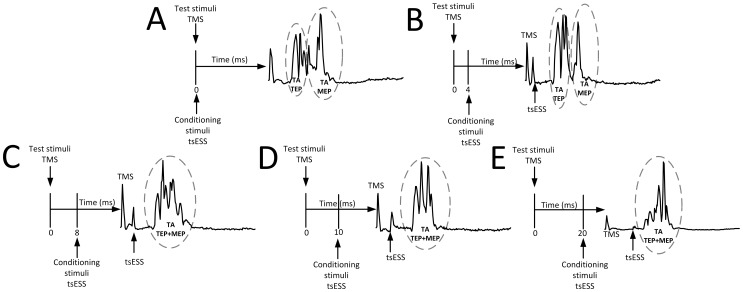
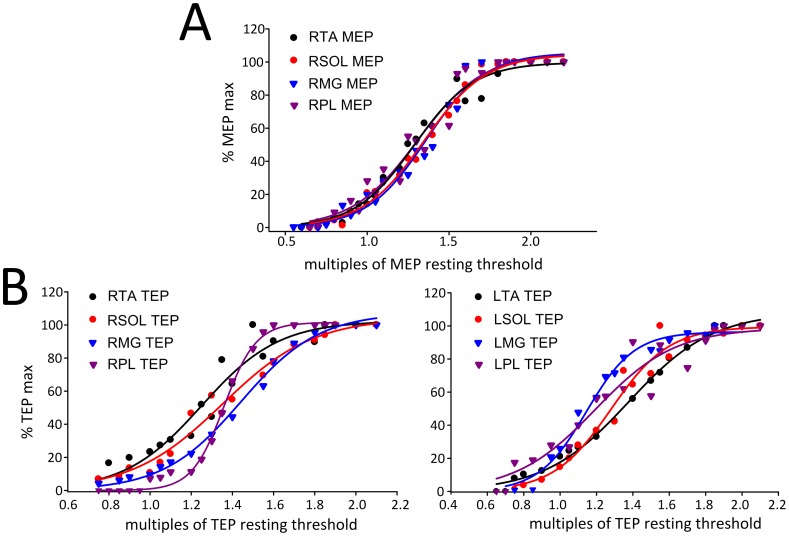
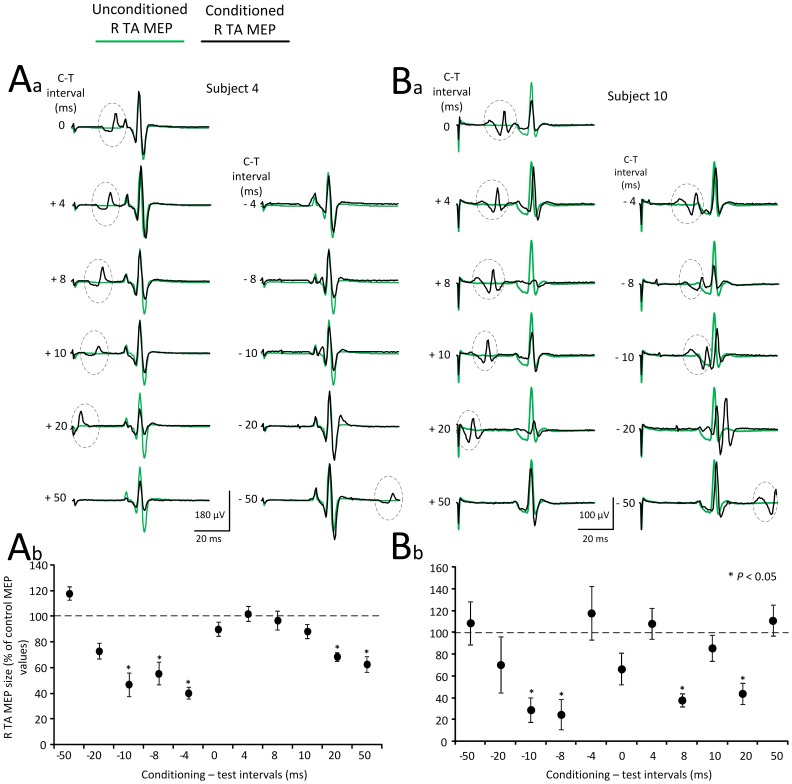
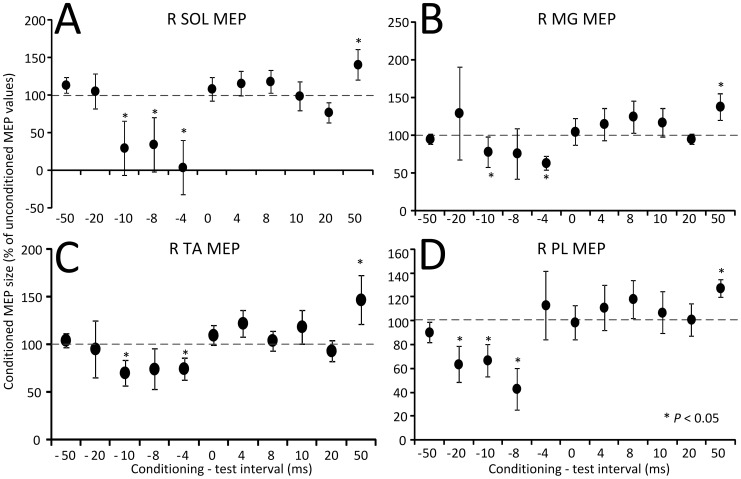
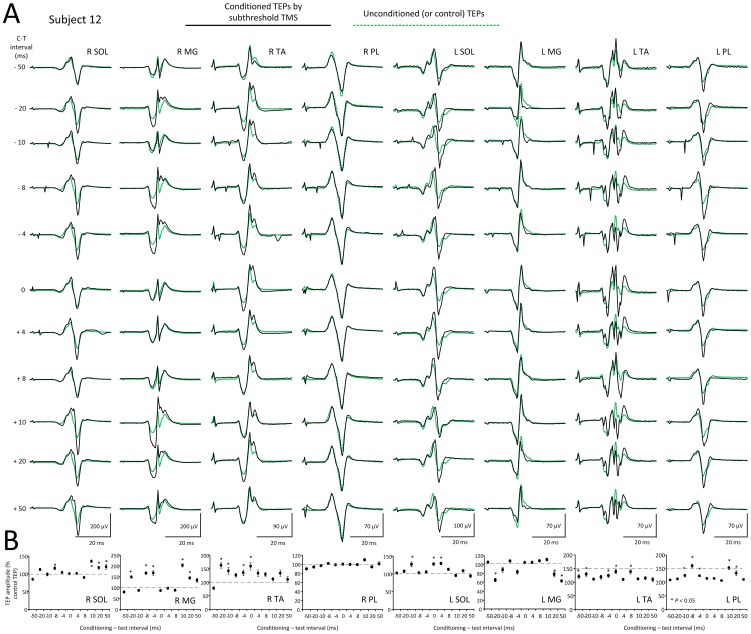
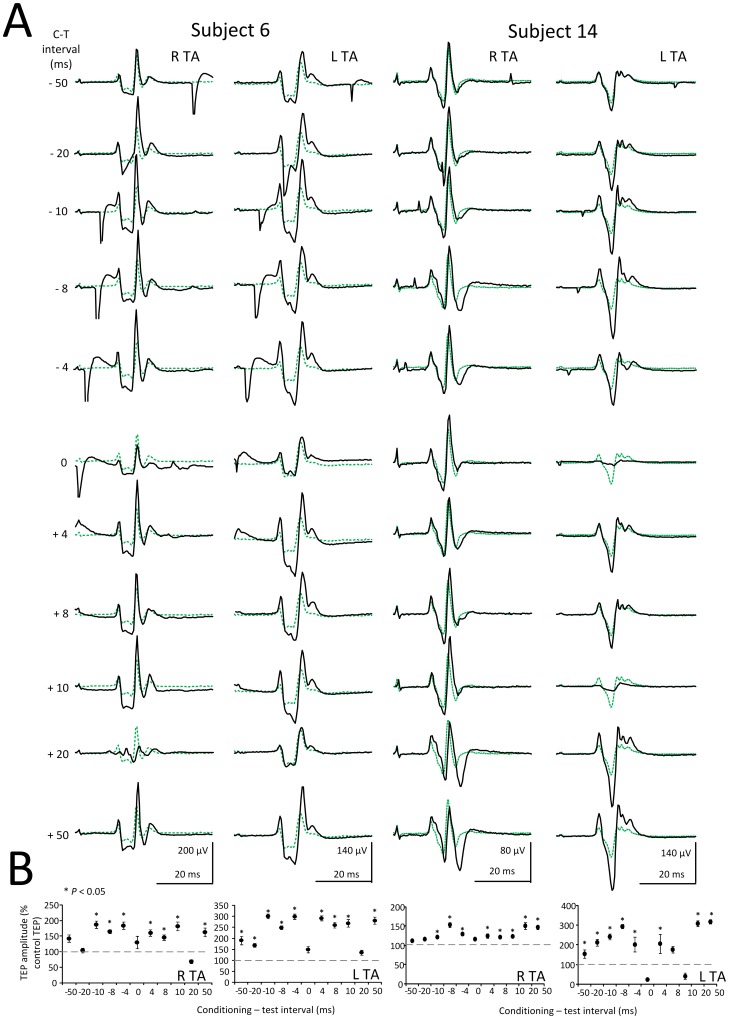
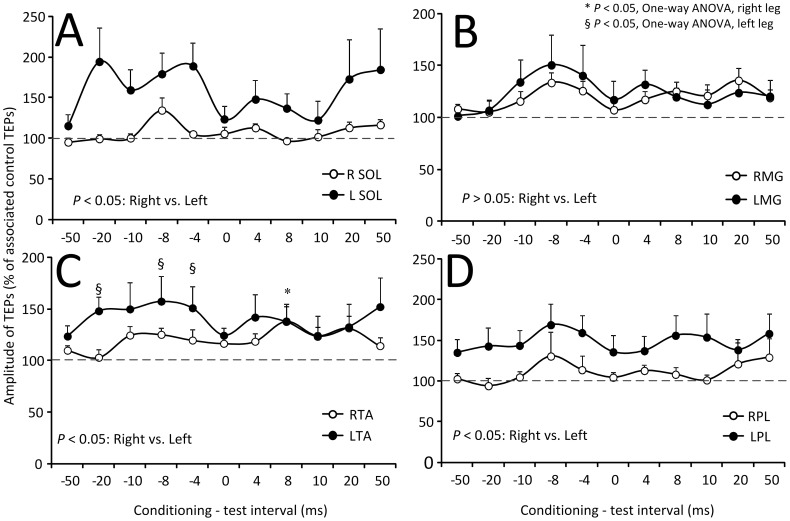
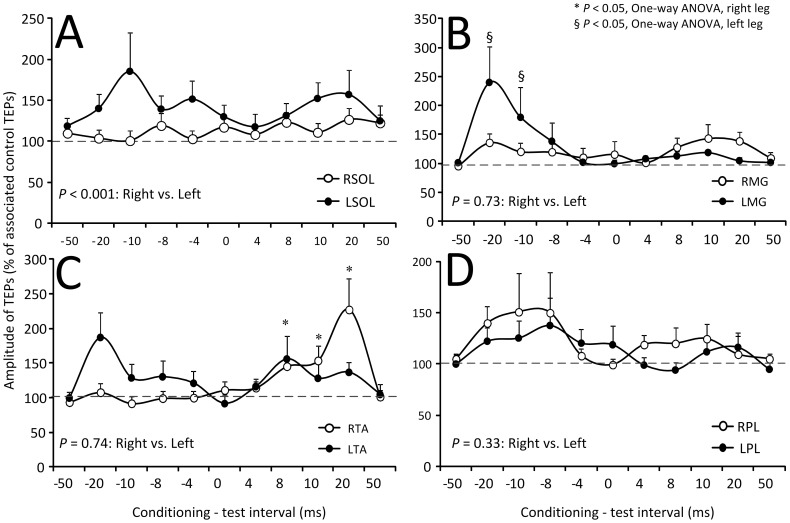
The objective of this study was to assess changes in corticospinal excitability and spinal output following noninvasive transpinal and transcortical stimulation in humans. The size of the motor evoked potentials (MEPs), induced by transcranial magnetic stimulation (TMS) and recorded from the right plantar flexor and extensor muscles, was assessed following transcutaneous electric stimulation of the spine (tsESS) over the thoracolumbar region at conditioning-test (C-T) intervals that ranged from negative 50 to positive 50 ms. The size of the transpinal evoked potentials (TEPs), induced by tsESS and recorded from the right and left plantar flexor and extensor muscles, was assessed following TMS over the left primary motor cortex at 0.7 and at 1.1× MEP resting threshold at C-T intervals that ranged from negative 50 to positive 50 ms. The recruitment curves of MEPs and TEPs had a similar shape, and statistically significant differences between the sigmoid function parameters of MEPs and TEPs were not found. Anodal tsESS resulted in early MEP depression followed by long-latency MEP facilitation of both ankle plantar flexors and extensors. TEPs of ankle plantar flexors and extensors were increased regardless TMS intensity level. Subthreshold and suprathreshold TMS induced short-latency TEP facilitation that was larger in the TEPs ipsilateral to TMS. Noninvasive transpinal stimulation affected ipsilateral and contralateral actions of corticospinal neurons, while corticocortical and corticospinal descending volleys increased TEPs in both limbs. Transpinal and transcortical stimulation is a noninvasive neuromodulation method that alters corticospinal excitability and increases motor output of multiple spinal segments in humans.
Conflict of interest statement
Figures
Similar articles
-
Cervicothoracic multisegmental transpinal evoked potentials in humans.PLoS One. 2013 Oct 7;8(10):e76940. doi: 10.1371/journal.pone.0076940. eCollection 2013. PLoS One. 2013. PMID: 24282479 Free PMC article.
-
Transspinal constant-current long-lasting stimulation: a new method to induce cortical and corticospinal plasticity.J Neurophysiol. 2015 Sep;114(3):1486-99. doi: 10.1152/jn.00449.2015. Epub 2015 Jun 24. J Neurophysiol. 2015. PMID: 26108955 Free PMC article.
-
Convergence of flexor reflex and corticospinal inputs on tibialis anterior network in humans.Clin Neurophysiol. 2016 Jan;127(1):706-715. doi: 10.1016/j.clinph.2015.06.011. Epub 2015 Jun 18. Clin Neurophysiol. 2016. PMID: 26122072
-
Transcranial magnetic stimulation and electrical stimulation techniques used to measure the excitability of distinct neuronal populations that influence motor output in people with persistent musculoskeletal conditions: A scoping review and narrative synthesis of evidence.J Electromyogr Kinesiol. 2025 Jun;82:103011. doi: 10.1016/j.jelekin.2025.103011. Epub 2025 Apr 22. J Electromyogr Kinesiol. 2025. PMID: 40286533
-
Disrupted Ankle Control and Spasticity in Persons With Spinal Cord Injury: The Association Between Neurophysiologic Measures and Function. A Scoping Review.Front Neurol. 2020 Mar 11;11:166. doi: 10.3389/fneur.2020.00166. eCollection 2020. Front Neurol. 2020. PMID: 32218765 Free PMC article.
Cited by
-
Distinguishing reflex from non-reflex responses elicited by transcutaneous spinal stimulation targeting the lumbosacral cord in healthy individuals.Exp Brain Res. 2024 Apr;242(4):959-970. doi: 10.1007/s00221-024-06790-2. Epub 2024 Feb 28. Exp Brain Res. 2024. PMID: 38416179 Free PMC article.
-
Multi-session transcutaneous spinal cord stimulation prevents chloride homeostasis imbalance and the development of hyperreflexia after spinal cord injury in rat.Exp Neurol. 2024 Jun;376:114754. doi: 10.1016/j.expneurol.2024.114754. Epub 2024 Mar 16. Exp Neurol. 2024. PMID: 38493983 Free PMC article.
-
Synergistic effects of transcutaneous spinal stimulation and neuromuscular electrical stimulation on lower limb force production: Time to deliver.PLoS One. 2024 Aug 30;19(8):e0296613. doi: 10.1371/journal.pone.0296613. eCollection 2024. PLoS One. 2024. PMID: 39213293 Free PMC article.
-
Remodeling Brain Activity by Repetitive Cervicothoracic Transspinal Stimulation after Human Spinal Cord Injury.Front Neurol. 2017 Feb 20;8:50. doi: 10.3389/fneur.2017.00050. eCollection 2017. Front Neurol. 2017. PMID: 28265259 Free PMC article.
-
Optimal sigmoid function models for analysis of transspinal evoked potential recruitment curves recorded from different muscles.PLoS One. 2025 Jan 22;20(1):e0317218. doi: 10.1371/journal.pone.0317218. eCollection 2025. PLoS One. 2025. PMID: 39841641 Free PMC article.
References
-
- Lemon RN (2008) Descending pathways in motor control. Annu Rev Neurosci 31: 195–218. - PubMed
-
- Knikou M (2008) The H-reflex as a probe: Pathways and pitfalls. J Neurosci Methods 171: 1–12. - PubMed
-
- Knikou M (2010) Neural control of locomotion and training-induced plasticity after spinal and cerebral lesions. Clin Neurophysiol 121: 1655–1668. - PubMed
MeSH terms
LinkOut - more resources
Full Text Sources
Other Literature Sources
Medical
