

COPD exacerbation severity and frequency is associated with impaired macrophage efferocytosis of eosinophils
- PMID: 25007795
- PMCID: PMC4115214
- DOI: 10.1186/1471-2466-14-112
COPD exacerbation severity and frequency is associated with impaired macrophage efferocytosis of eosinophils
Abstract
Background: Eosinophilic airway inflammation is observed in 10-30% of COPD subjects. Whether increased eosinophils or impairment in their clearance by macrophages is associated with the severity and frequency of exacerbations is unknown.
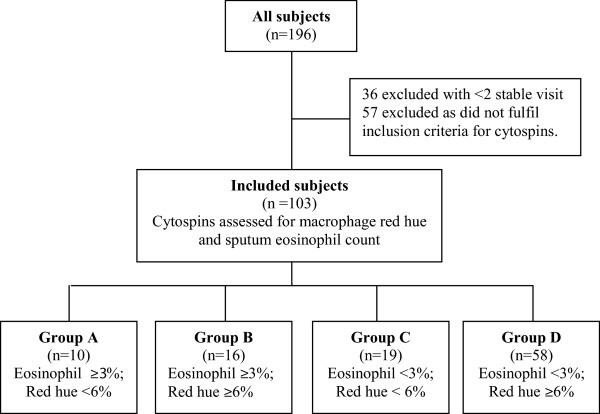
Methods: We categorised 103 COPD subjects into 4 groups determined by the upper limit of normal for their cytoplasmic macrophage red hue (<6%), an indirect measure of macrophage efferocytosis of eosinophils, and area under the curve sputum eosinophil count (≥ 3%/year). Eosinophil efferocytosis by monocyte-derived macrophages was studied in 17 COPD subjects and 8 normal controls.
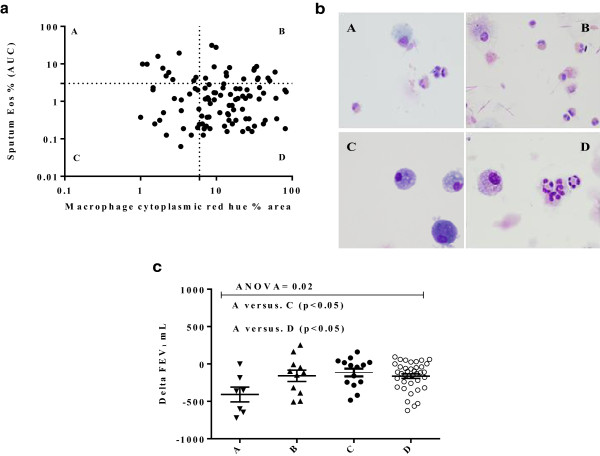
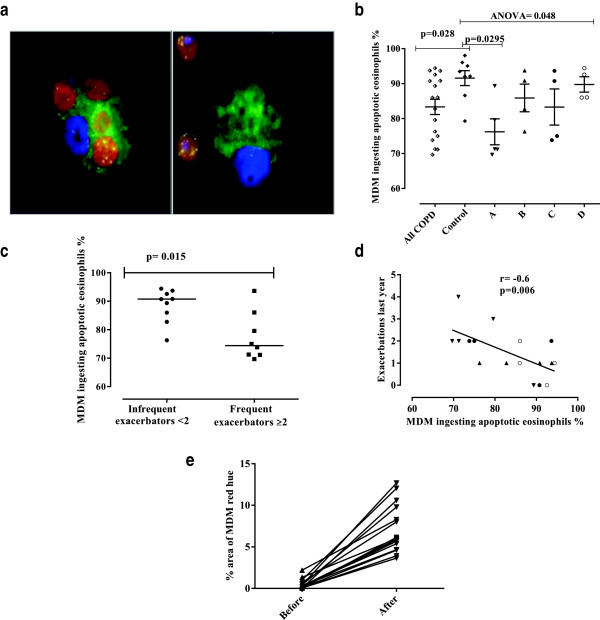
Results: There were no differences in baseline lung function, health status or exacerbation frequency between the groups: A-low red hue, high sputum eosinophils (n=10), B-high red hue, high sputum eosinophils (n=16), C-low red hue, low sputum eosinophils (n=19) and D- high red hue, low sputum eosinophils (n=58). Positive bacterial culture was lower in groups A (10%) and B (6%) compared to C (44%) and D (21%) (p=0.01). The fall in FEV1 from stable to exacerbation was greatest in group A (ΔFEV1 [95 % CI] -0.41 L [-0.65 to -0.17]) versus group B (-0.16 L [-0.32 to -0.011]), C (-0.11 L [-0.23 to -0.002]) and D (-0.16 L [-0.22 to -0.10]; p=0.02). Macrophage efferocytosis of eosinophils was impaired in COPD versus controls (86 [75 to 92]% versus 93 [88 to 96]%; p=0.028); was most marked in group A (71 [70 to 84]%; p=0.0295) and was inversely correlated with exacerbation frequency (r=-0.63; p=0.006).
Conclusions: Macrophage efferocytosis of eosinophils is impaired in COPD and is related to the severity and frequency of COPD exacerbations.
Figures
References
-
- Eltboli O, Brightling CE. Eosinophils as diagnostic tools in chronic lung disease. Expert Rev Respir Med. 2013;7(1):33–42. - PubMed
-
- Barker BL, Brightling CE. Phenotyping the heterogeneity of chronic obstructive pulmonary disease. ClinSci (Lond) 2013;124(6):371–387. - PubMed
-
- Brightling CE, Monteiro W, Ward R, Parker D, Morgan MD, Wardlaw AJ, Pavord ID. Sputum eosinophilia and short-term response to prednisolone in chronic obstructive pulmonary disease: a randomised controlled trial. Lancet. 2000;356(9240):1480–1485. - PubMed
-
- Woolley KL, Gibson PG, Carty K, Wilson AJ, Twaddell SH, Woolley MJ. Eosinophil apoptosis and the resolution of airway inflammation in asthma. Am J Respir Crit Care Med. 1996;154(1):237–243. - PubMed
Publication types
MeSH terms
Grants and funding
LinkOut - more resources
Full Text Sources
Other Literature Sources
Medical
Molecular Biology Databases
