. 2014 Jul 9;15(1):581.
doi: 10.1186/1471-2164-15-581.

Genome and transcriptome sequencing identifies breeding targets in the orphan crop tef (Eragrostis tef)

Affiliations

Genome and transcriptome sequencing identifies breeding targets in the orphan crop tef (Eragrostis tef)

Gina Cannarozzi et al. BMC Genomics. .

Abstract

Background: Tef (Eragrostis tef), an indigenous cereal critical to food security in the Horn of Africa, is rich in minerals and protein, resistant to many biotic and abiotic stresses and safe for diabetics as well as sufferers of immune reactions to wheat gluten. We present the genome of tef, the first species in the grass subfamily Chloridoideae and the first allotetraploid assembled de novo. We sequenced the tef genome for marker-assisted breeding, to shed light on the molecular mechanisms conferring tef's desirable nutritional and agronomic properties, and to make its genome publicly available as a community resource.

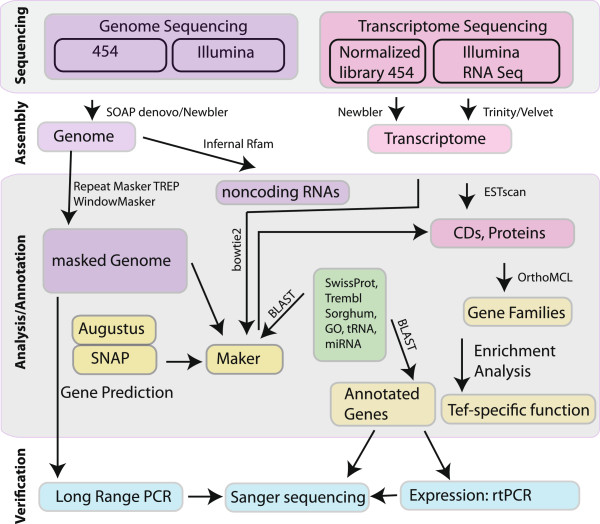
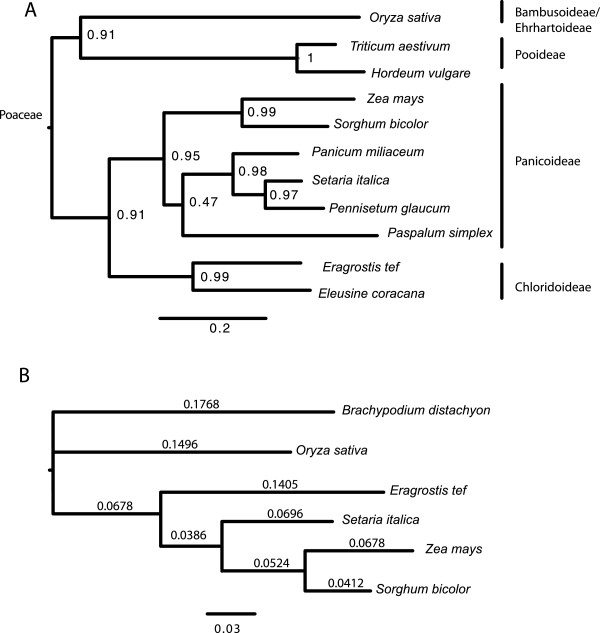
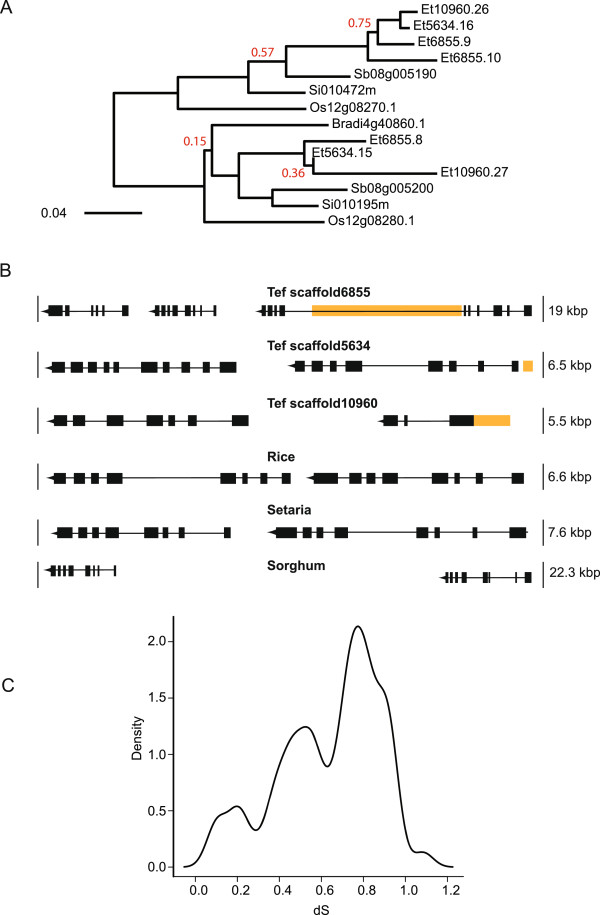
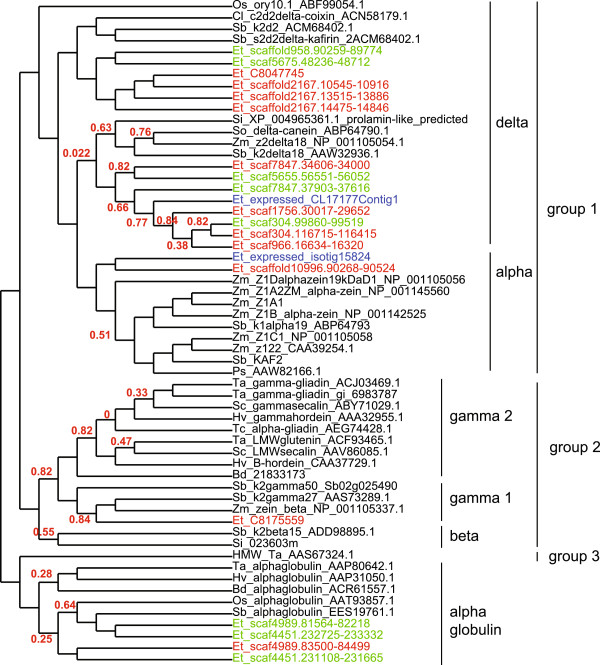
Results: The draft genome contains 672 Mbp representing 87% of the genome size estimated from flow cytometry. We also sequenced two transcriptomes, one from a normalized RNA library and another from unnormalized RNASeq data. The normalized RNA library revealed around 38000 transcripts that were then annotated by the SwissProt group. The CoGe comparative genomics platform was used to compare the tef genome to other genomes, notably sorghum. Scaffolds comprising approximately half of the genome size were ordered by syntenic alignment to sorghum producing tef pseudo-chromosomes, which were sorted into A and B genomes as well as compared to the genetic map of tef. The draft genome was used to identify novel SSR markers, investigate target genes for abiotic stress resistance studies, and understand the evolution of the prolamin family of proteins that are responsible for the immune response to gluten.

Conclusions: It is highly plausible that breeding targets previously identified in other cereal crops will also be valuable breeding targets in tef. The draft genome and transcriptome will be of great use for identifying these targets for genetic improvement of this orphan crop that is vital for feeding 50 million people in the Horn of Africa.


Figures

Figure 1
Figure 1
Overview of the tef sequencing project. Both the genome and transcriptome of tef were sequenced, annotated, analyzed and verified. The genome was assembled using SOAPdenovo and was then analyzed for transposable elements using WindowMasker, RepeatMasker and TREP. Non-coding RNAs were found with Infernal with the Rfam dataset and genes were predicted using the evidence combiner, Maker. One normalized transcriptome library was produced using 454 pyrosequencing, assembled using Newbler and the genes predicted using ESTscan. Another transcriptome was produced using RNASeq data collected from tef seedlings subjected to various moisture regimes. The sequences were assembled using both Trinity and Oases/Velvet and the coding regions predicted using ESTscan.
Figure 2
Figure 2
Phylogenetic tree for selected cereals from the grass (Poaceae) family including tef ( Eragrostis tef ). A) Partial sequences of the WAXY gene from barley (Hordeum vulgare, X07931), bread wheat (Triticum aestivum, KF861808), finger millet (Eleusine coracana, AY508652), foxtail millet (Setaria italica, AB089143), maize (Zea mays, EU041692), Paspalum simplex (AF318770), pearl millet (Pennisetum glaucum, AF488414), proso millet (Panicum miliaceum, GU199268), rice (Oryza sativa, FJ235770.1), sorghum (Sorghum bicolor, EF089839), and tef (Eragrostis tef, AY136939) were obtained from the NCBI database. The maximum likelihood tree was inferred using PhyML and the default model of HKY85 + G. The scale bar reflects evolutionary distance, measured in units of substitution per nucleotide site. Branch support was inferred using the Shimodaira–Hasegawa-like (SH) aLRT provided by PhyML. B) Phylogenetic Tree of the Complete Grass Genomes. Protein supergenes with an aligned length of 260398 amino acids and constructed from orthologous sequences were used to infer a maximum-likelihood tree using PhyML with the WAG substitution matrix and a gamma model with four classes and an alpha parameter value estimated to be 0.489. Branch lengths reflect the estimated number of amino acid substitutions per site. ML bootstrap values were all 100%.
Figure 3
Figure 3
Comparison of tef to other grasses. A) Syntenic dotplot between tef scaffolds (x-axis) and sorghum chromosomes (y-axis) produced by CoGe. Scaffolds of tef have been ordered and oriented based on synteny to sorghum (minimum of 3 syntenic genes, see: http://goo.gl/ECKmA9) and joined to create a pseudo-assembly. Each dots represents a syntenic gene pair between tef and sorghum. For each sorghum position, two tef scaffolds, one from the A genome and one from the B genome, are expected. The sinusoidal shape is a result of very few tef scaffolds aligning to the gene-poor centromeric regions of sorghum. B) Tef pseudo-chromosomes were then sorted into tef A and tef B pseudo-chromosomes. A dot plot of the 1A and 1B pseudo-chromosomes shows the correspondence between the A and B pseudo-chromosomes. C) The distributions of pairwise synonymous substitutions per synonymous site estimated between tef and other genomes. The corresponding dates can be found in Additional file 5: Table S13. D) Histogram of synonymous rate values (Ks) for all syntenic gene-pairs within the tef and within the maize genomes. The dates estimated from modes of the peaks using a molecular clock rate of 6.5 × 10⁻⁹ substitutions per synonymous site per year can be found in Additional file 5: Table S13.
Figure 4
Figure 4
Relationship between tef genetic map and tef pseudo-chromosomes. The 30 linkage groups from the genetic map of Zeid et al. are depicted in yellow with labels corresponding to the location of their CNLT SSR markers. The ten tef pseudo-chromosomes are colored in various colors with colored lines connecting the physical location of each CNLT marker on the tef pseudo-chromosomes to its location on the genetic map. Lines depicting mapping of genetic markers to tef pseudo-chromosomes are shown with the color of the pseudo-chromosome with the most overlap. The linkage groups of the genetic map have been ordered to minimize overlap of the connections and thus indicate which of the 30 linkage groups are homeologous. A translocation between sorghum and tef can be seen between linkage group 3 and tef pseudo-chromosomes 3 and 9. The units of the tef pseudo-chromosomes are Mbp.
Figure 5
Figure 5
SAL1 gene in tef and other grasses. A) The SAL1 gene duplicated before the divergence of the grasses and has also undergone several recent duplications in one branch of the phylogenetic tree. The ML tree was constructed using the WAG protein substitution model implemented in PhyML (version 3.0). Branch support was inferred using the conservative and non-parametric Shimodaira–Hasegawa-like (SH) aLRT provided by PhyML. Only branch support values less than 0.85 are shown. Abbreviations: Et: Eragrostis tef; Sb: Sorghum bicolor; Os: Oryza sativa; Bradi: Brachypodium distachyon; Si: Setaria italica. B) Comparison of orthologous syntenic genomic regions between tef, sorghum, and setaria. The SAL1 gene appears on three scaffolds in the tef genome, twice as tandem duplicates and once as a tandem triplicate and is found as a tandem duplicate in rice, setaria and sorghum. Orange blocks indicate unsequenced regions created from the scaffolding. C) Distribution of Ks values for all pairwise comparisons of SAL1 gene family members.
Figure 6
Figure 6
Phylogenetic tree of prolamins in grasses. The protein sequences included in the analysis follow those of Xu and Messing [74] with the addition of tef sequences from this work. The repeat regions were edited out of all sequences which were then aligned using MAFFT. The ML tree was constructed using the WAG protein substitution model implemented in PhyML (version 3.0). The gamma shape parameter was fit to 2.845 and the proportion of invariant sites was estimated to be 0. Branch support was inferred using the conservative and non-parametric Shimodaira–Hasegawa-like (SH) aLRT provided by PhyML. Only branch support values less than 0.85 are shown. The tree is represented here by a cladogram so there are no meaningful branch lengths. Expressed tef sequences are in blue, tef sequences with a lesion (frame shift or stop codon in the coding region) are green and the remaining tef sequences are red. The grasses included are: Bd: Brachypodium distachyon; Cl: Coix lacryma; Et: Eragrostis tef; Hv: Hordeum vulgare; Os: Oryza sativa; Ps: Panicum sumatrense; Sb: Sorghum bicolor; Sc: Secale cereale; Si: Setaria italica; So: Saccharum officinarum; Ta: Triticum aestivum; Tc: Triticum compactum; Zm: Zea mays.

References

    1. Agricultural Sample Survey for 2012/13. Ethiopia: Statistical Bulletin Addis Ababa; 2013.
    1. Umeta M, West CE, Fufa H. Content of zinc, iron, calcium and their absorption inhibitors in foods commonly consumed in Ethiopia. J Food Compos Anal. 2005;18(8):803–817. doi: 10.1016/j.jfca.2004.09.008. - DOI
    1. Eragrain [http://www.eragrain.com/pdf/Consumer%20brochure%205-2012%20no%20address%...]
    1. Alaunyte I, Stojceska V, Plunkett A, Ainsworth P, Derbyshire E. Improving the quality of nutrient-rich Teff (Eragrostis tef) breads by combination of enzymes in straight dough and sourdough breadmaking. J Cereal Sci. 2012;55(1):22–30. doi: 10.1016/j.jcs.2011.09.005. - DOI
    1. Tye-Din JA, Stewart JA, Dromey JA, Beissbarth T, van Heel DA, Tatham A, Henderson K, Mannering SI, Gianfrani C, Jewell DP, Hill AV, McCluskey J, Rossjohn J, Anderson RP. Comprehensive, quantitative mapping of T cell epitopes in gluten in celiac disease. Sci Transl Med. 2010;2(41):41ra51. - PubMed

Publication types

MeSH terms

LinkOut - more resources