. 2014 Sep 1;307(5):F539-50.
doi: 10.1152/ajprenal.00510.2013. Epub 2014 Jul 9.

Antagonism of the prostaglandin E2 EP1 receptor in MDCK cells increases growth through activation of Akt and the epidermal growth factor receptor

Affiliations

Antagonism of the prostaglandin E2 EP1 receptor in MDCK cells increases growth through activation of Akt and the epidermal growth factor receptor

Mary Taub et al. Am J Physiol Renal Physiol. .

Abstract

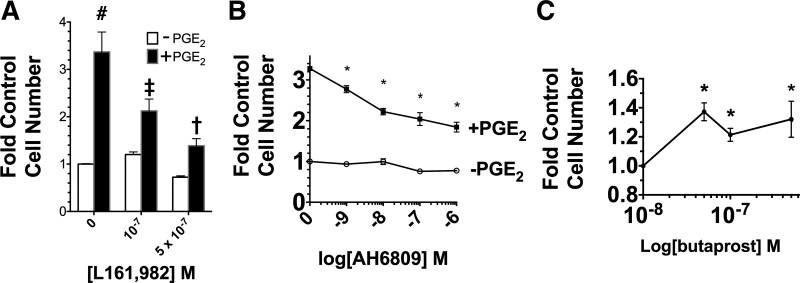
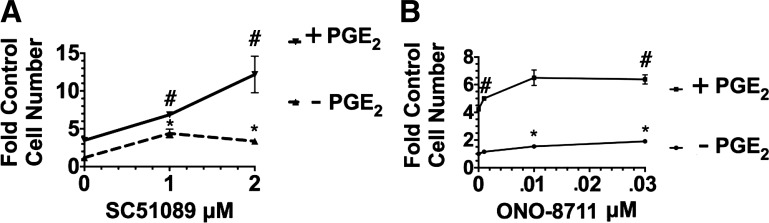
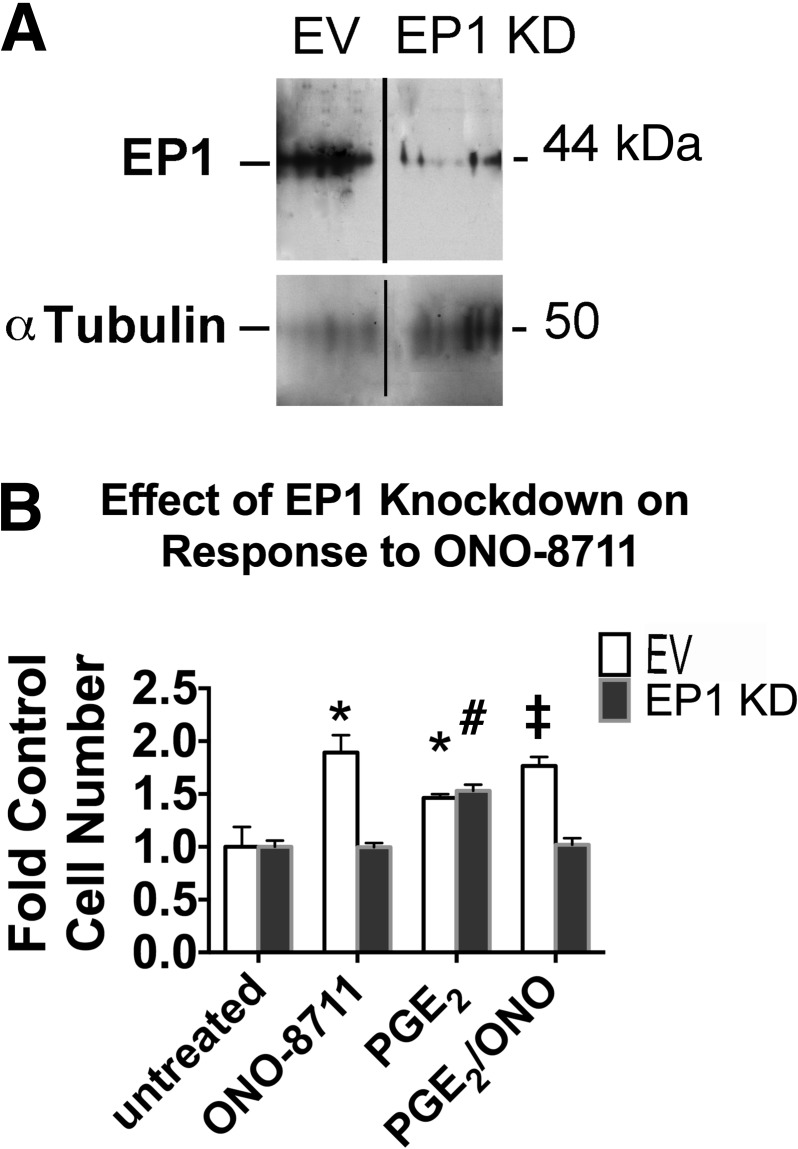
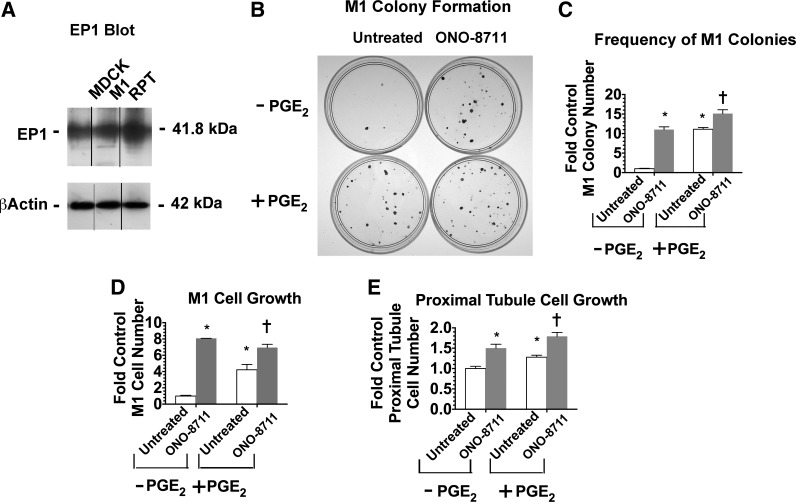
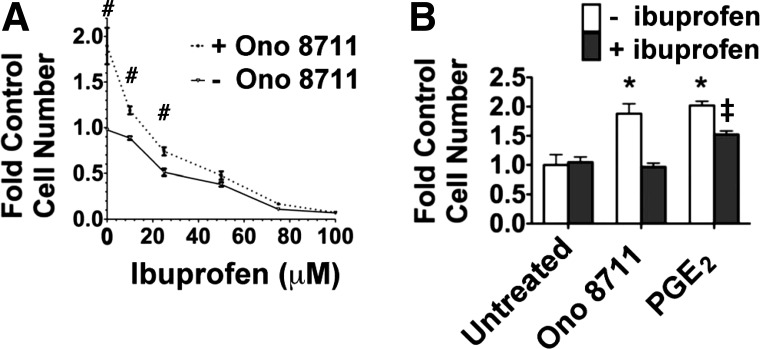
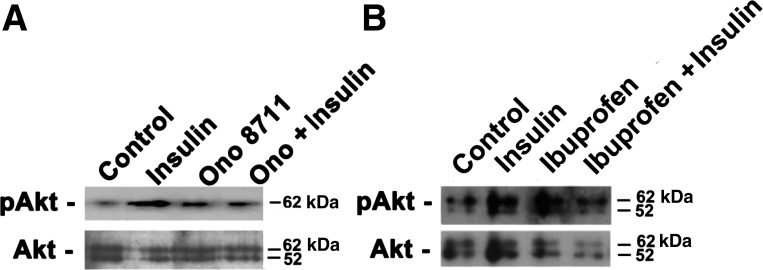
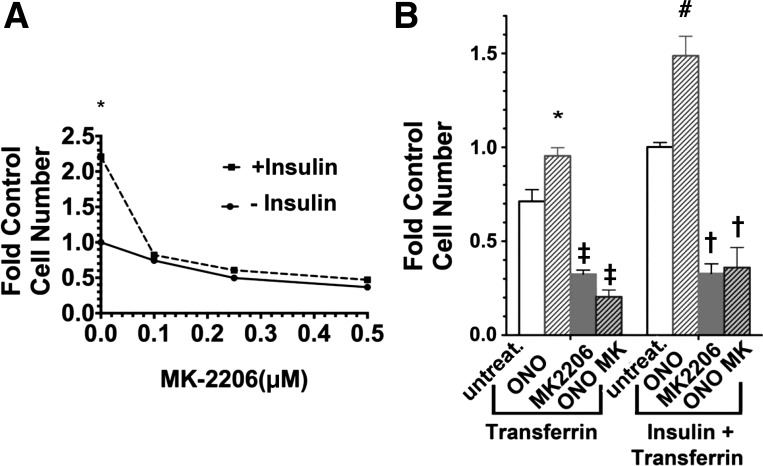
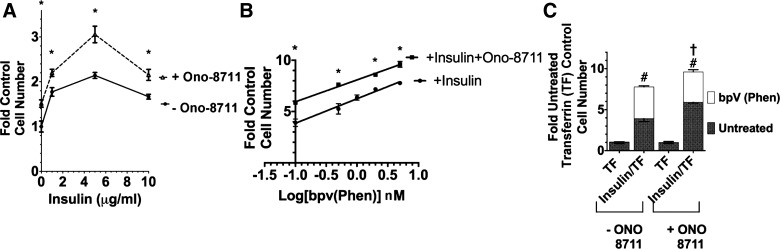
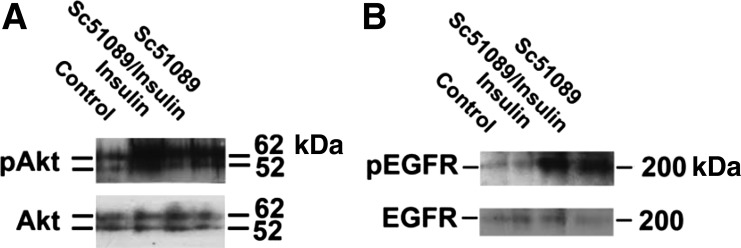
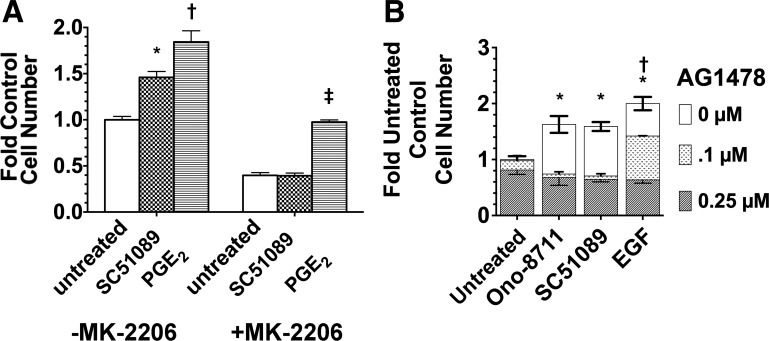
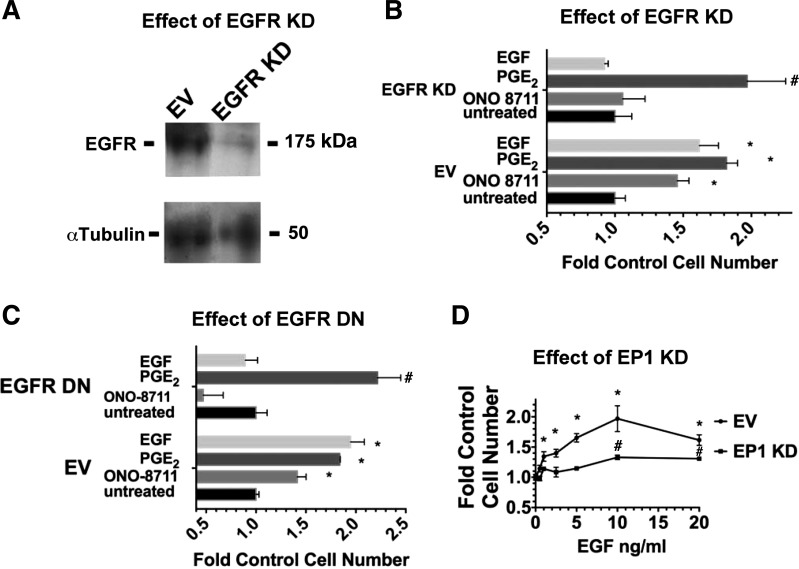
The actions of prostaglandin E2 (PGE2) in the kidney are mediated by G protein-coupled E-prostanoid (EP) receptors, which affect renal growth and function. This report examines the role of EP receptors in mediating the effects of PGE2 on Madin-Darby canine kidney (MDCK) cell growth. The results indicate that activation of Gs-coupled EP2 and EP4 by PGE2 results in increased growth, while EP1 activation is growth inhibitory. Indeed, two EP1 antagonists (ONO-8711 and SC51089) stimulate, rather than inhibit, MDCK cell growth, an effect that is lost following an EP1 knockdown. Similar observations were made with M1 collecting duct and rabbit kidney proximal tubule cells. ONO-8711 even stimulates growth in the absence of exogenous PGE2, an effect that is prevented by ibuprofen (indicating a dependence upon endogenous PGE2). The involvement of Akt was indicated by the observation that 1) ONO-8711 and SC51089 increase Akt phosphorylation, and 2) MK2206, an Akt inhibitor, prevents the increased growth caused by ONO-8711. The involvement of the EGF receptor (EGFR) was indicated by 1) the increased phosphorylation of the EGFR caused by SC51089 and 2) the loss of the growth-stimulatory effect of ONO-8711 and SC51089 caused by the EGFR kinase inhibitor AG1478. The growth-stimulatory effect of ONO-8711 was lost following an EGFR knockdown, and transduction of MDCK cells with a dominant negative EGFR. These results support the hypothesis that 1) signaling via the EP1 receptor involves Akt as well as the EGFR, and 2), EP1 receptor pharmacology may be employed to prevent the aberrant growth associated with a number of renal diseases.

Keywords: EP receptors; kidney epithelial cell growth; prostaglandin E2.


Figures

Fig. 1.
Fig. 1.
Role of EP2 and EP4 in mediating the growth response to PGE2. A: effect of EP4 antagonist L161, 982 (0, 0.1, 0.5 µM) on growth in the presence or absence of 70 nM PGE2. The control is the value obtained with 0 L161, 982-PGE2. #P < 0.05 relative to control. ‡P < 0.05 relative to cultures grown without PGE2 but in the presence of 10−7 M L161,982. †P < 0.05 relative to cultures grown without PGE2, but in the presence of 5 × 10⁻⁷ M L161, 982. B: effect of EP2 antagonist AH6809 (0–10−6 M) on growth in the presence and absence of 70 nM PGE2. The control is the cell number obtained without both PGE2 and AH6809. *P < 0.05 relative to the cell number obtained without PGE2 at the same AH6809 concentration. C: effect of EP2 agonist butaprost (0–10−6 M) on growth. The cells in the cultures were counted after 6 days. Values are the averages ± SE of triplicate determinations. *P < 0.05 relative to the control number obtained in the absence of butaprost.
Fig. 2.
Fig. 2.
Effect of EP1 antagonist SC5108 on Madin-Darby canine kidney (MDCK) cell growth. A: effect of SC51089 (0,1, and 2 μM) on growth in the presence and absence of 70 nM PGE2. B: effect of ONO-8711 (0–30 nM) on MDCK cell growth in the presence and absence of 70 nM PGE2. The cells in the cultures were counted after 10 days. Values are the averages ± SE of triplicate determinations relative to the control value, i.e., the cell number obtained in the absence of both PGE2 and EP1 antagonist. In A and B, #P < 0.05 relative to the value obtained in the presence of PGE2 but in the absence of EP1 antagonist. *P < 0.05 relative to the control value (obtained in the absence of PGE2).
Fig. 3.
Fig. 3.
Effect of EP1 knockdown (KD). A: Western blot showing EP1 protein in MDCK cells transduced with either pLKO (empty vector; EV) or pLKO.1 with EP1 shRNA (EP1 KD), as well as the level of α-tubulin (a loading control). Lanes have been rearranged to show the 2 cell types as adjacent. B: effect of an EP1 KD on the growth response to ONO-8711. The effect of 30 μM ONO-8711, 70 nM PGE2 as well as 30 nM ONO-8711 and 70 nM PGE2 in combination on growth was examined in MDCK cells transduced either with a lentivirus containing the EV, pLKO.1, or with lentivirus containing EP1 short hairpin (sh) RNA (EP1 KD). *P < 0.05 relative to the EV control (i.e., untreated). ‡P < 0.05 relative to the value obtained with PGE2 in MDCK cells transduced with the EV. #P < 0.05 relative to the control value (i.e., untreated) obtained with MDCK cells expressing EP1 shRNA (EP1 KD).
Fig. 4.
Fig. 4.
Effect of ONO-8711 on the growth of mouse M1 collecting duct cells and rabbit kidney proximal tubule cells. A: expression of EP1 receptor in MDCK, M1, and primary rabbit renal proximal tubule (RPT) cells. The expression of the EP1 receptor is shown in a Western blot of MDCK cells, M1 mouse collecting duct cells, and primary rabbit RPT cells. Bands have been rearranged to show the 3 cell types as adjacent. β-Actin is shown as a loading control. B: colony formation by mouse M1 collecting duct cells. M1 collecting duct cells were plated at a low density (250 cells/dish) either in control medium (supplemented with insulin and transferrin) or in control medium further supplemented with 30 nM ONO-8711, 70 nM PGE2, or 30 nM ONO-8711 and 70 nM PGE2 in combination. Subsequently, colony formation by mouse M1 collecting duct cells was visualized by crystal violet staining, as described in materials and methods. C: effect of ONO-8711 on the frequency of colony formation by mouse M1 collecting duct cells. The number of colonies was determined in M1 cell cultures maintained as described above. D: effect of ONO-8711 on M1 cell growth. M1 cell growth was examined (vs. untreated cultures) both in the presence of 70 nM PGE2, and in the control condition (i.e., in the absence of PGE2). E: effect of ONO-8711 on proximal tubule cell growth. Proximal tubule cell growth was examined under the conditions described in above. Values are averages ± SE of triplicate determinations. *P < 0.05 relative to the untreated control. †P < 0.05 relative to untreated cultures maintained with PGE2.
Fig. 5.
Fig. 5.
Effect of ibuprofen on the growth response to ONO-8711. A: effect of increasing concentrations of ibuprofen (0–100 μM) on growth in the presence and absence of 30 nM ONO-8711. The cells were counted after 8 days in culture. #P < 0.05 relative to the control value (i.e., the value obtained in the absence of both ONO 8711 and ibuprofen). B: effect of ONO-8711 and 70 nM PGE2 on growth, either in the presence or the absence of 100 μM ibuprofen. The cells were counted after 5 days in culture. Values are the averages ± SE of triplicate determinations. *P < 0.05 relative to the control value (i.e., the value obtained with untreated cells grown in the absence of ibuprofen). ‡P < 0.05 relative to the value obtained with untreated cells grown in the presence of ibuprofen.
Fig. 6.
Fig. 6.
Effect of insulin, ONO-8711, and ibuprofen on Akt phosphorylation. A: the level of pAkt was examined by Western analysis following a 30-min incubation with either control (transferrin alone), 5 μg/ml insulin, 30 nM ONO-8711, or 5 μg/ml insulin and 30 nM ONO-8711 in combination. The level of Akt was also determined. B: effect of no treatment (control; 5 μg/ml transferrin alone), 5 μg/ml insulin, 50 μM ibuprofen, or 5 μg/ml insulin and ibuprofen in combination on the level of pAkt and Akt was similarly determined.
Fig. 7.
Fig. 7.
Dependence of the growth-stimulatory effect of insulin and ONO-8711 upon MK-2206. A: effect of MK-2206 on MDCK cell growth was studied in both the presence and absence of 1 μg/ml insulin. The control value is the average cell number obtained in the absence of both insulin and MK-2206. *P < 0.05 for the value obtained in the presence of insulin relative to the value at the same MK-2206 concentration in the absence of insulin. B: effect of either 0 nM ONO-8711 (untreat), 30 nM ONO-8711 (ONO), 0.5 μM MK2206, or 0.5 μM MK2206+30 nM ONO-8711 (ONO MK) was examined in medium supplemented with 5 μg/ml transferrin, or in medium supplemented with 5 μg/insulin+5 μg/ml transferrin. The control value is the average cell number obtained with insulin and transferrin alone. With respect to the stimulatory effect of ONO-8711 observed in B, *P < 0.05 relative to the value obtained with untreated cultures grown with transferrin alone and #P < 0.05 relative to the value obtained with untreated cultures grown with insulin+transferrin, With respect to the inhibitory effects of MK2206, ‡P < 0.05 relative to the value obtained with untreated cultures maintained with transferrin alone and †P < 0.05 relative to the value obtained with untreated cultures grown with insulin+transferrin alone.
Fig. 8.
Fig. 8.
Dependence of the growth-stimulatory effect of ONO-8711 upon insulin and PTEN. A: influence of insulin (0–10 μg/ml) on growth in the presence of either 0 or 30 nM ONO-8711. The control value is the average cell number in the absence of both insulin and ONO-8711. *P < 0.05 relative to the value at the same insulin concentration in the absence of ONO-8711. B: effect of 0–7.5 nM bpV(phen) on MDCK cell growth in the presence and absence of 30 nM ONO-8711. The effect of pbV(phen) was examined between 0.1 and 10 μM. Values are relative to the control value (i.e., the cell number obtained in the presence of insulin and transferrin alone). The best fit line to the data was obtained by linear regression analysis. *P < 0.05 relative to the value obtained in the absence of ONO-8711 at the same bpv(phen) concentration. C: dependence of the effect of 7.5 nM bpv(phen) upon insulin. The effect of bpv(phen), open bars, was examined (vs. untreated MDCK cells, filled bars) either in 1) medium supplemented with 5 μg/ml transferrin alone (TF) or 2) medium supplemented with both 5 μg/ml insulin and 5 μg/ml transferrin (insulin/TF). The effect of 30 nM ONO-8711 was also examined in each of these latter 2 culture conditions. Values were compared with the control value obtained in untreated MDCK cells grown with transferrin alone and in the absence of ONO-8711. #P < 0.05 in the presence of bpv(phen) relative to the value obtained with insulin and transferrin in the absence of ONO-8711. †P < 0.05 relative to the value obtained with insulin and transferrin in the presence of ONO-8711.
Fig. 9.
Fig. 9.
Effect of insulin and SC51089 on the phosphorylation of Akt and the EGF receptor (EGFR). MDCK cells were incubated for 30 min with either no further supplement (i.e., control, 5 μg/ml transferrin alone), 5 μg/ml insulin, 5 μg/ml insulin and 2 μg/ml SC51089 in combination, or 2 μM SC51089. Level of pAkt and Akt (A) pEGFR and EGFR (B) in the samples was examined by Western blot analysis.
Fig. 10.
Fig. 10.
Effect of Akt inhibitor MK-2206 and EGFR inhibitor AG1478 on the growth response to EGFR antagonists. A: effect of 2 μM SC51089 and 70 nM PGE2 on growth, relative to untreated MDCK cell cultures, was examined both in the presence of 0.5 μM MK-2206 and in the absence of MK-2206 (control). *P < 0.05 relative to the values in untreated cultures lacking MK-2206 (i.e., the control value). †P < 0.05 relative to the value in cultures with SC51089, but lacking MK-2206. ‡P < 0.05 relative to untreated MK-2206. B: effect of AG1478. The influence of 0, 0.1, and 0.25 μM AG1478 on MDCK cell growth was examined in the untreated condition (i.e., in medium supplemented with insulin and transferrin), as well as in culture medium further supplemented with either 30 nM Ono-8711, 2 μM SC51089, or 5 ng/ml EGF. Average values in each condition were compared with the control value (i.e., the average cell number obtained in the untreated condition lacking AG1478). *P < 0.05 relative to control lacking AG1478. †P < 0.05 in the presence of 0.1 μM AG1478 relative to the untreated control.
Fig. 11.
Fig. 11.
Genetic studies indicating the involvement of the EGFR and the EP1 receptor in the growth response to ONO-8711, and EGF, respectively. A: effect of an EGFR KD on expression of the EGFR. A Western blot shows expression of the EGFR in MDCK cells transduced with lentiviral pLKO.1 (EV), or with EGFR shRNA. α-Tubulin is shown as a loading control. B: effect of an EGFR KD on growth. The effect of 30 nM ONO-8711, 70 nM PGE2, and 5 ng/ml EGF on growth was examined both in MDCK cells transduced with lentivirus containing either the EV (pLKO.1) or pLKO.1 with shRNA against the EGFR. The control value was the average cell number in untreated cultures for each cell type. C: effect of dominant negative (DN) EGFR on growth. The effect of 30 μM ONO-8711, 70 nM PGE2, and 5 ng/ml EGF on growth was examined (vs. untreated controls) in MDCK cells selected for expression of either a dominant negative EGFR or pcDNA3 (EV). The control value was the average cell number in untreated cultures for each cell type. D: effect of EP1 KD on the growth response to EGF. The effect of EGF (0- 20 ng/ml) on growth was examined in MDCK cells transduced with lentivirus containing either the EV (pLKO.1) or pLKO.1 with shRNA against the EP1 receptor. The control value was the average cell number obtained in untreated cultures (in the absence of EGF) for each cell type. In B, C and D, MDCK cell cultures were counted after 6 days in culture. Values are averages ± SE of triplicate determinations. *P < 0.05 relative to the control value of MDCK cells transduced with EV. #P < 0.05 relative to the control value of MDCK cells transduced with either lentiviral EGFR shRNA, EGFR DN, or EP1 shRNA.

Similar articles

Cited by

References

    1. Alessi DR. Discovery of PDK1, one of the missing links in insulin signal transduction. Colworth Medal Lecture. Biochem Soc Trans 29: 1–14, 2001 - PubMed
    1. Aoudjit L, Potapov A, Takano T. Prostaglandin E2 promotes cell survival of glomerular epithelial cells via the EP4 receptor. Am J Physiol Renal Physiol 290: F1534–F1542, 2006 - PubMed
    1. Bartlett CS, Boyd KL, Harris RC, Zent R, Breyer RM. EP1 disruption attenuates end-organ damage in a mouse model of hypertension. Hypertension 60: 1184–1191, 2012 - PMC - PubMed
    1. Belibi FA, Edelstein CL. Novel targets for the treatment of autosomal dominant polycystic kidney disease. Expert Opin Investig Drugs 19: 315–328, 2010 - PMC - PubMed
    1. Bonvalet JP, Pradelles P, Farman N. Segmental synthesis and actions of prostaglandins along the nephron. Am J Physiol Renal Fluid Electrolyte Physiol 253: F377–F387, 1987 - PubMed

Publication types

MeSH terms

LinkOut - more resources