. 2014 Dec 1;23(23):6332-44.
doi: 10.1093/hmg/ddu351. Epub 2014 Jul 9.

Loss of MITF expression during human embryonic stem cell differentiation disrupts retinal pigment epithelium development and optic vesicle cell proliferation

Affiliations

Loss of MITF expression during human embryonic stem cell differentiation disrupts retinal pigment epithelium development and optic vesicle cell proliferation

Elizabeth E Capowski et al. Hum Mol Genet. .

Abstract

Microphthalmia-associated transcription factor (MITF) is a master regulator of pigmented cell survival and differentiation with direct transcriptional links to cell cycle, apoptosis and pigmentation. In mouse, Mitf is expressed early and uniformly in optic vesicle (OV) cells as they evaginate from the developing neural tube, and null Mitf mutations result in microphthalmia and pigmentation defects. However, homozygous mutations in MITF have not been identified in humans; therefore, little is known about its role in human retinogenesis. We used a human embryonic stem cell (hESC) model that recapitulates numerous aspects of retinal development, including OV specification and formation of retinal pigment epithelium (RPE) and neural retina progenitor cells (NRPCs), to investigate the earliest roles of MITF. During hESC differentiation toward a retinal lineage, a subset of MITF isoforms was expressed in a sequence and tissue distribution similar to that observed in mice. In addition, we found that promoters for the MITF-A, -D and -H isoforms were directly targeted by Visual Systems Homeobox 2 (VSX2), a transcription factor involved in patterning the OV toward a NRPC fate. We then manipulated MITF RNA and protein levels at early developmental stages and observed decreased expression of eye field transcription factors, reduced early OV cell proliferation and disrupted RPE maturation. This work provides a foundation for investigating MITF and other highly complex, multi-purposed transcription factors in a dynamic human developmental model system.


Figures

Figure 1.
Figure 1.
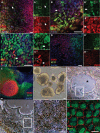
Expression of MITF during early retinal differentiation in hESCs. (A) Immunocytochemistry (ICC) for PAX6 (red) and MITF (green) in adherent hESC cultures differentiated for 13 days. The open and closed arrows mark representative PAX6+/MITF+ and PAX6+/MITF cells, respectively. ICC for each of these markers is shown separately in A′ (MITF) and A″ (PAX6). (B) ICC for OTX2 (red) and MITF (green) in d13 adherent cultures. The open and closed arrows mark representative OTX2+/MITF+ and OTX2+/MITF cells, respectively. ICC for each of these markers is shown separately in B′ (MITF) and B″ (OTX2). (CE) ICC for VSX2 (red) and MITF (green) in (C) d15, (D) d18 and (E) d20 adherent cultures. The open and closed arrows in C mark representative VSX2+/MITF+ and VSX2+/MITF cells, respectively. ICC for each of these markers is shown separately in C′ and D′ (MITF) and C″ and D″ (VSX2). Note that VSX2 and MITF expression becomes mutually exclusive over this time period. (F) Light microscopic image of hESC-OVs collected at d20 after being lifted from adherent cultures by gentle trituration. (GI) Light microscopic images at sequentially higher magnifications showing differentiating RPE at d40 within the adherent skirt of cells left behind after lifting the central OV colony. The asterisk marks the former position of the OV colony. The boxes outline the area magnified in the subsequent panel. (J) ICC image of ZO-1 (red) and MITF (green) in RPE passaged from skirts surrounding former hESC-OV colonies. Scale bars for A–D, J = 20 µm; scale bars for E–I = 50 µm. Nuclei are counterstained with 4′,6-diamidino-2-phenylindole (DAPI) (blue).
Figure 2.
Figure 2.
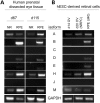
MITF isoforms show differential expression during human retinal development and hESC differentiation. RT-PCR for MITF isoforms from (A) neural retina (NR) or RPE dissected from d67 or d115 prenatal eyes, or (B) hESC-derived retinal cells (d14 adherent OV cells, d20 lifted OVs containing NRPCs or d40 RPE).
Figure 3.
Figure 3.
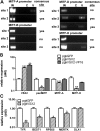
VSX2 directly binds isoform-specific MITF promoter regions and represses MITF expression. (A) PCR analyses following ChIP with either VSX2 primary antibody (V) or isotype control antibody (C). PCR was performed using primers flanking selected 500 bp promoter regions from four MITF isoforms. The presence or absence of a predicted VSX2 binding site within each selected promoter region is indicated to the right of each image (note that not all predicted sites were bound by VSX2). The location of the pre-selected promoter regions respective to the translational start site of each MITF isoform is shown in Supplementary Material, Figure S3. IN: input DNA. (B) RT-qPCR for VSX2, panMITF, MITF-A and MITF-H from d40 adherent cultures transduced at d15 with lenti-pgkVSX2 (hatched bars), lenti-pgkVSX2-VP16 (solid bars) or control lenti-pgkGFP (open bars). (C) RT-qPCR for RPE markers (TYR, BEST1, RPE65, MERTK) and a forebrain marker (DLX1) in d40 adherent cultures transduced at d15 with lenti-pgkVSX2 (hatched bars) or control lenti-pgkGFP (open bars). *P ≤ 0.04, **P ≤ 0.01, ***P ≤ 0.0005.
Figure 4.
Figure 4.
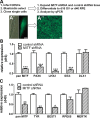
Lenti-shRNA-mediated MITF knock down selectively decreases expression of early OV and RPE genes. (A) Schematic depicting the method used to generate and analyze clonal shRNA-expressing hESC lines following lentiviral infection. Live cell fluorescence images of a representative GFP+ hESC colony before (A′) and after (A″) selection and expansion. (B and C) RT-qPCR analyses showing (B) early OV and forebrain gene expression levels at d16 and (C) RPE gene expression levels at d40 in adherent MITF shRNA-expressing hESC cultures (hatched bars) relative to non-targeted shRNA control hESC cultures (open bars). Note that only RPE genes that are known direct targets of MITF (TYR and BEST1) were reduced. Scale bars = 50 µm. *P < 0.04, **P < 0.004, ***P ≤ 0.0006.
Figure 5.
Figure 5.
Expression levels of early OV and RPE genes are reduced in MITF−/− mutant hESCs relative to MITF+/+ isogenic control hESCs. (A and B) Immunocytochemistry for (A) PAX6 (green) and OTX2 (red) and (B) MITF (green) and OTX2 (red) in d13 adherent MITF−/− hESCs. (C) ICC for MITF (green) and VSX2 (red) in d18 adherent MITF−/− hESCs. Nuclei were counterstained with DAPI (blue). (D) RT-PCR for selected MITF isoforms from d16 MITF+/+ and MITF−/− hESC cultures. (E) RT-qPCR analysis showing expression levels of early OV and forebrain genes in MITF−/− hESCs (hatched bars) relative to MITF+/+ hESCs (open bars) at d16 of differentiation. (F) RT-PCR for selected MITF isoforms from d40 MITF+/+ and MITF−/− hESC cultures. (G) RT-qPCR analysis showing expression levels of RPE genes in MITF−/− hESCs (hatched bars) relative to MITF+/+ hESCs (open bars) at d40 of differentiation. Note that all RPE genes tested were reduced in the MITF−/− cultures. *P ≤ 0.02, **P < 0.003, ***P ≤ 0.0006. Scale bars = 20 µm.
Figure 6.
Figure 6.
RPE is produced in MITF−/− hESCs but develops abnormally. (A) Western analysis for MITF and ACTIN protein in d60 second passage MITF+/+ and MITF−/− hESC-RPE. (B) Photograph of cell pellets from matched, second passage d60 MITF+/+ and MITF−/− hESC-RPE grown in parallel. (C and D) Light microscopic images of d60 second passage RPE from MITF+/+ (C) or MITF−/− (D) hESC cultures. (EH) ICC images from d60 second passage RPE from MITF+/+ (E and G) or MITF−/− (F and H) hESC cultures, showing MITF (green) and ZO-1 (red) (E and F) or PAX6 (green) and ZO-1 (red) (G and H) expression. Scale bars for C and D = 50 μm. Scale bars for E–H = 20 µm.
Figure 7.
Figure 7.
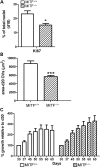
Elimination of MITF protein expression decreases early OV cell proliferation and initial OV size, but does not affect subsequent OV growth. (A) Percentage of OV cells from d18 MITF+/+ (open bar) or MITF−/− (hatched bar) hESC cultures expressing the proliferation marker Ki67. (B) Graph showing the mean area ± S.E.M. of isolated d20 OVs from three independently differentiated, paired cultures of MITF+/+ (open bar) or MITF−/− (hatched bar) hESCs. (C) Pooled data plotted as percentage increase in OV size over time, relative to d30 OVs from MITF+/+ (open bars) or MITF−/− (hatched bars) hESC lines (n = 15 for each group). *P < 0.02, ***P < 0.0001.

Similar articles

Cited by

References

    1. Zuber M., Gestri G., Viczian A., Barsacchi G., Harris W. Specification of the vertebrate eye by a network of eye field transcription factors. Development. 2003;130:5155–5167. - PubMed
    1. Fuhrman S. Eye morphogenesis and patterning of the optic vesicle. Curr. Top. Dev. Biol. 2010;93:61–84. - PMC - PubMed
    1. Fuhrman S., Zou C., Levine E. Retinal pigment epithelium development, plasticity and tissue homeostasis. Exp. Eye Res. 2013 doi:10.1016/j.exer.2013.09.003. - DOI - PMC - PubMed
    1. Nguyen M., Arnheiter H. Signaling and transcriptional regulation in early mammalian eye development: a link between FGF and MITF. Development. 2000;127:3581–3591. - PubMed
    1. Bora N., Conway S., Liang H., Smith S. Transient overexpression of the Microphthalmia gene in the eyes of Microphthalmia vitiligo mutant mice. Dev. Dyn. 1998;213:283–292. - PubMed

Publication types

MeSH terms