. 2014 Dec;63(12):4275-90.
doi: 10.2337/db14-0809. Epub 2014 Jul 9.

Hyperhomocysteinemia potentiates hyperglycemia-induced inflammatory monocyte differentiation and atherosclerosis

Affiliations

Hyperhomocysteinemia potentiates hyperglycemia-induced inflammatory monocyte differentiation and atherosclerosis

Pu Fang et al. Diabetes. 2014 Dec.

Abstract

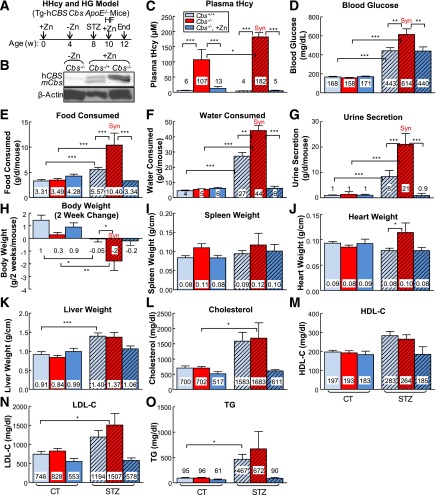
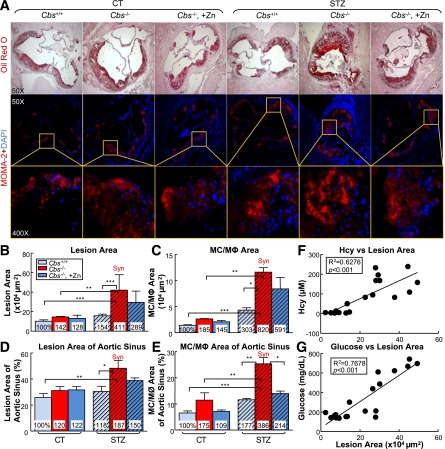
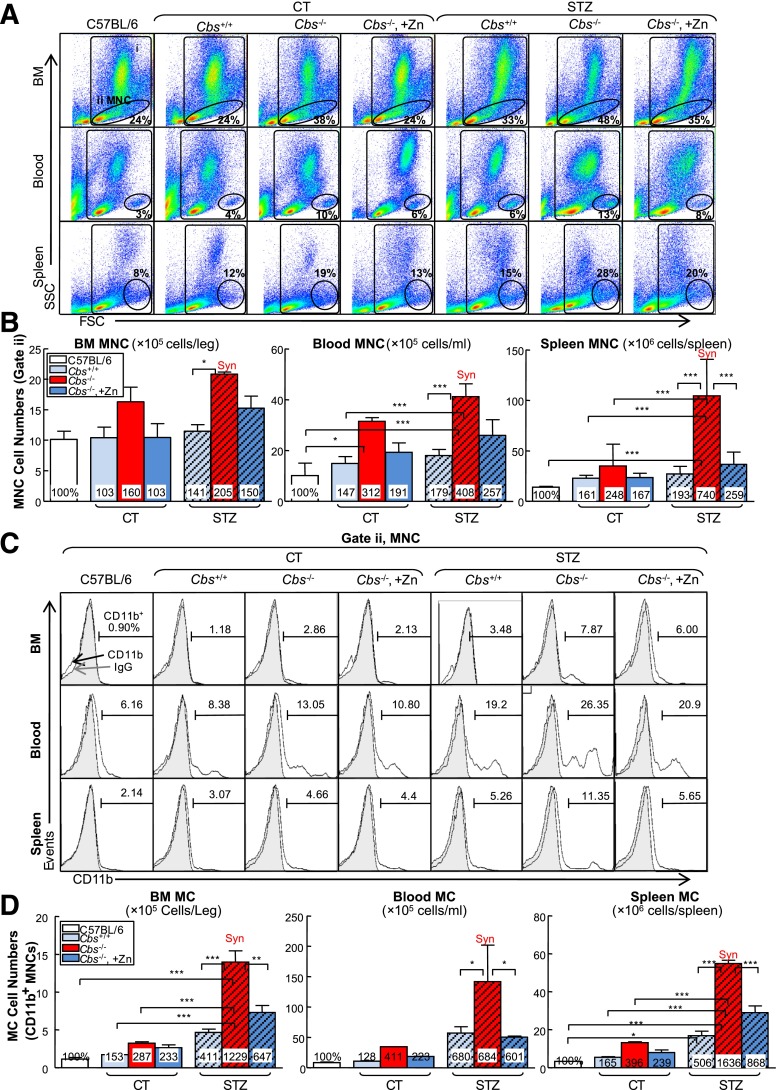
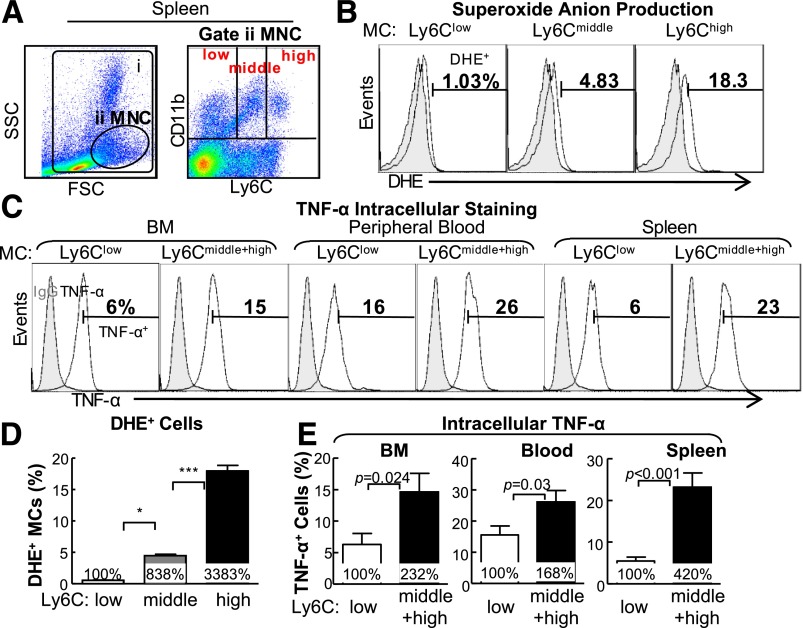
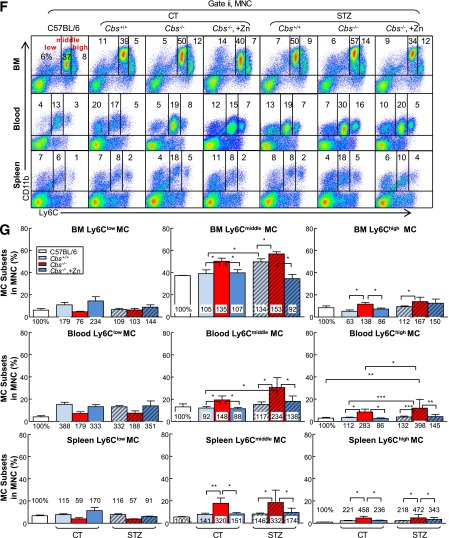
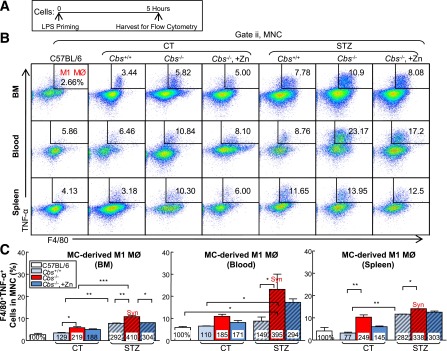
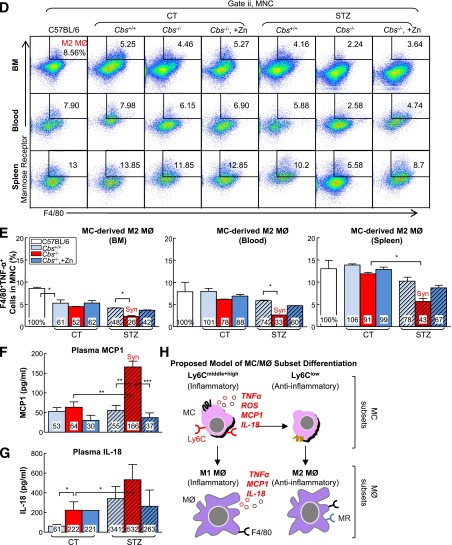
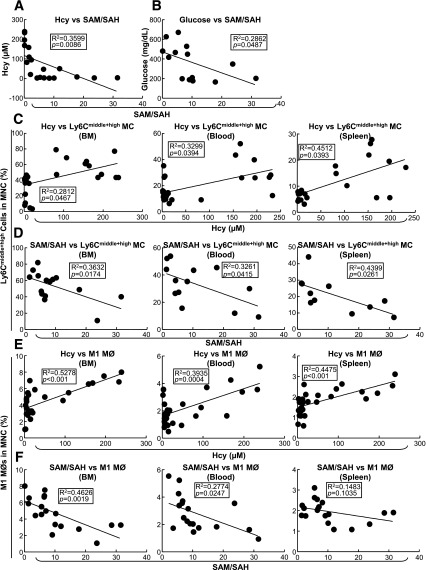
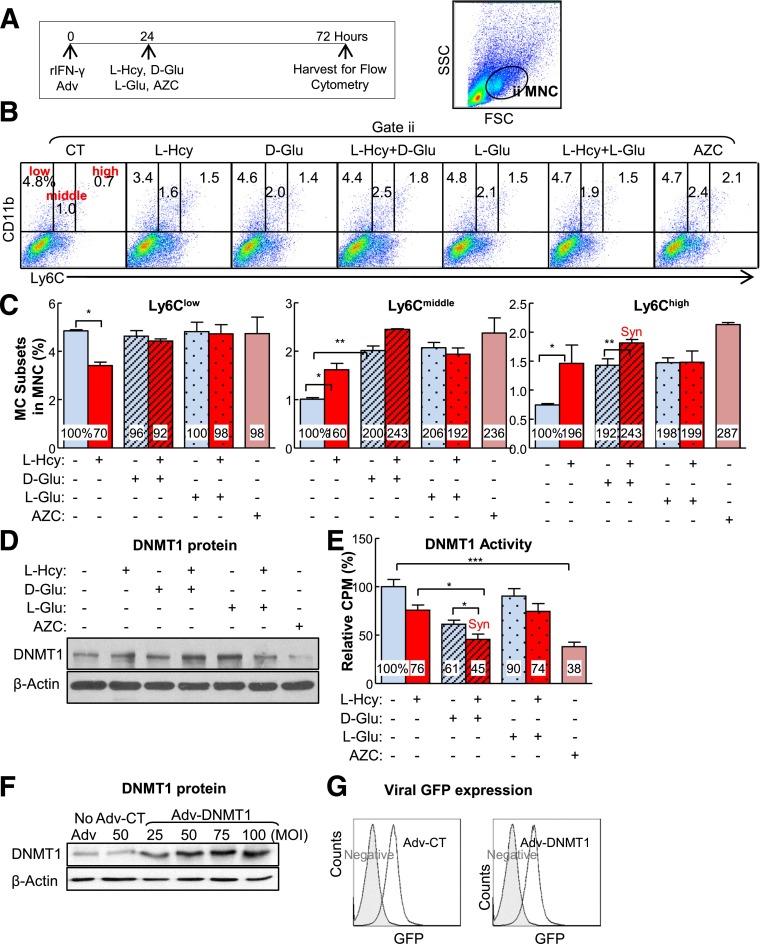
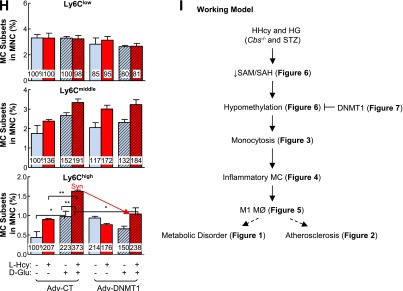
Hyperhomocysteinemia (HHcy) is associated with increased diabetic cardiovascular diseases. However, the role of HHcy in atherogenesis associated with hyperglycemia (HG) remains unknown. To examine the role and mechanisms by which HHcy accelerates HG-induced atherosclerosis, we established an atherosclerosis-susceptible HHcy and HG mouse model. HHcy was established in mice deficient in cystathionine β-synthase (Cbs) in which the homocysteine (Hcy) level could be lowered by inducing transgenic human CBS (Tg-hCBS) using Zn supplementation. HG was induced by streptozotocin injection. Atherosclerosis was induced by crossing Tg-hCBS Cbs mice with apolipoprotein E-deficient (ApoE(-/-)) mice and feeding them a high-fat diet for 2 weeks. We demonstrated that HHcy and HG accelerated atherosclerosis and increased lesion monocytes (MCs) and macrophages (MØs) and further increased inflammatory MC and MØ levels in peripheral tissues. Furthermore, Hcy-lowering reversed circulating mononuclear cells, MC, and inflammatory MC and MC-derived MØ levels. In addition, inflammatory MC correlated positively with plasma Hcy levels and negatively with plasma s-adenosylmethionine-to-s-adenosylhomocysteine ratios. Finally, l-Hcy and d-glucose promoted inflammatory MC differentiation in primary mouse splenocytes, which was reversed by adenoviral DNA methyltransferase-1. HHcy and HG, individually and synergistically, accelerated atherosclerosis and inflammatory MC and MØ differentiation, at least in part, via DNA hypomethylation.


Figures

Figure 1
Figure 1
HHcy and HG exacerbate metabolism and increase heart weights in mice. A: HHcy and HG mouse model. Tg-hCBS Cbs ApoE−/− mice were supplied with drinking water containing Zn that was withdrawn at 4 weeks of age to shut down hCBS expression and cause HHcy. At 8 weeks of age, mice received intraperitoneal sodium nitrate (vehicle CT) or STZ (50 mg/kg body weight) daily for 5 days to induce HG. At 10 weeks of age, mice with confirmed HG were switched to a high-fat diet for 2 weeks and killed. B: Zn-induced Tg-hCBS protein expression. Tg-hCBS Cbs ApoE−/− mice were fed drinking water containing Zn to induce Tg-hCBS gene expression until 4 weeks old. Protein was extracted from the liver and examined for Tg-hCBS protein expression. C: Plasma total Hcy (tHcy) levels. Blood was collected when mice were killed, and tHcy levels were measured. D: Blood Glu levels. Tg-hCBS Cbs−/− ApoE−/− mice treated with STZ showed the highest blood Glu level. To evaluate mouse metabolism status, all of the Tg-hCBS Cbs ApoE−/− mice were monitored for food intake (E), water intake (F), urine secretion (G), and body weight (H) changes after 24 h accommodation in the metabolic cages (Harvard Apparatus, Holliston, MA). Body weight loss, food intake, water consumption, and urine secretion were increased in HHcy and HG mice compared with HG-alone mice. Water intake and urine secretion were significantly increased in HHcy and HG mice. The trend of an increase in stool in HHcy and HG mice was observed but did not reach statistical significance. Weights of spleen (I), heart (J), and liver (K) relative to tibia length were measured when mice were killed. The trend of an increase in spleen weight in HHcy and HG mice was observed but did not reach statistical significance. Heart weights were increased in HHcy and HG mice. Liver weights were increased in HG alone and in HHcy and HG mice. Plasma cholesterol (L), HDL-C (M), LDL-C (N), and TG (O) in Tg-hCBS Cbs ApoE−/− mice. Plain bars represent CT mice. Diagonal bars represent mice on STZ. Measurements are expressed as means ± SD. One-way ANOVA with post hoc Bonferroni was used for analysis (n = 5–16). *P < 0.05, **P < 0.01, and ***P < 0.001. Syn, synergy.
Figure 2
Figure 2
HHcy and HG increase atherosclerotic lesion size and increase MC and MØ accumulation in the aortic root of mice. Tg-hCBS Cbs ApoE−/− mice received intraperitoneal sodium nitrate (vehicle CT) or STZ (50 mg/kg body weight) daily for 5 days at 8 weeks old. STZ caused the mice to develop HG (blood Glu ≥300 mg/dL). At 10 weeks old, all mice were switched to a high-fat diet for another 2 weeks and killed. Hearts were isolated from Tg-hCBS Cbs ApoE−/− mice. Cryostat sections (10 µm) were collected and stained with Oil Red O (lipids, red), counterstained with hematoxylin (nuclear, blue), or immunostained with MOMA-2 (MC and MØ marker, red) and counterstained with DAPI (nuclear, blue). Images were acquired by Axioskop 2 plus (Zeiss, Stuttgart, Germany). A: Photomicrographs of mouse aortic sinus cross-sections. Merge shows the accumulation of MC and MØ in the lesion. Quantitative analysis of lesion area (B), MC/MØ area (C), lesion area of the aortic sinuses (D), and MC/MØ area of the aortic sinuses (E). Atherosclerotic lesion areas are defined as the intimal region between the lumen and the internal elastic lumina (IEL). The areas of the lesions were measured with Image-Pro Plus 6.0 software. F: Correlation analysis was performed between plasma Hcy levels and atherosclerotic lesion area from all groups. One data dot represents data from a single mouse. G: Correlation analysis was performed between blood Glu and atherosclerotic lesion area from all groups. Note that atherosclerotic lesion areas and MC and MØ areas were increased in HHcy and HG mice. Plain bars represent CT mice. Diagonal bars represent mice on STZ. Measurements are expressed as means ± SD. One-way ANOVA with post hoc Bonferroni was used for analysis (n = 5–15). *P < 0.05, **P < 0.01, and ***P < 0.001. Syn, synergy; tHcy, total homocysteine.
Figure 3
Figure 3
HHcy and HG synergistically increase MNCs and monocytosis in BM, peripheral blood, and spleen of mice. Tg-hCBS Cbs ApoE−/− mice received intraperitoneal sodium nitrate (vehicle CT) or STZ (50 mg/kg body weight) daily for 5 days at 8 weeks old. STZ caused the mice to develop HG (blood Glu ≥300 mg/dL). At 10 weeks old, all mice were switched to a high-fat diet for 2 weeks and killed. BM, peripheral blood, and spleen cells were isolated, stained with anti-CD11b mouse antibody, and analyzed by flow cytometry. A: Representative MNC and MC dot plots depict nucleated cells (gate i) and MNCs (gate ii). B: Quantitative analyses of total MNC in BM, peripheral blood, and spleen are shown in bar graphs. C: Representative histograms depict MC identified as CD11b+ MNC. D: Quantitative analyses of MC in BM, peripheral blood, and spleen are shown in bar graphs. Note that MNCs and MCs were increased in HHcy and HG mice. Measurements are expressed as means ± SD. One-way ANOVA with post hoc Bonferroni was used for analysis (n = 8–16). *P < 0.05, **P < 0.01, and ***P < 0.001. FSC, forward scatter; IgG, mouse CD11b IgG isotype antibody control; SSC, side scatter; Syn, synergy.
Figure 4
Figure 4
HHcy and HG induce inflammatory MC subsets in BM, peripheral blood, and spleen of mice. Tg-hCBS Cbs ApoE−/− mice received intraperitoneal sodium nitrate (vehicle CT) or STZ (50 mg/kg body weight) for 5 consecutive days at 8 weeks old. STZ caused the mice to develop HG (blood Glu ≥300 mg/dL). At 10 weeks old, all mice were switched to a high-fat diet for an additional 2 weeks and killed. BM, peripheral blood, and spleen cells were isolated, stained with anti-CD11b and anti-Ly6C mouse antibodies, and analyzed by flow cytometry. A: Representative nucleated cells, MNC, and MC subset dot plots depict nucleated cells (gate i) and MNCs (gate ii). MNCs are further divided into three subsets: CD11b+Ly6Clow, CD11b+Ly6Cmiddle, and CD11b+Ly6Chigh. B: Superoxide anion levels of different MC subsets were examined by flow cytometry with a free radical sensor, dihydroethidium (DHE). Ly6Chigh MCs, Ly6Cmiddle MCs, and Ly6Clow MCs have the highest, second highest, and lowest levels of superoxide anion, respectively. C: Cells from BM, peripheral blood, and spleen were treated with lipopolysaccharide (0.1 μg/mL) and a Golgi blocker, brefeldin A (1 μL/mL), for 5 h and then stained with antibody against mouse TNF-α and analyzed by flow cytometry. Note that Ly6Cmiddle+high MCs have larger TNF-α+ cell populations than Ly6Clow MCs. D: Quantitative analysis of DHE+ cells in Ly6Clow, Ly6Cmiddle, and Ly6Chigh from spleen. E: Quantitative analyses of TNF-α+ cells in Ly6Clow and Ly6Cmiddle+high from BM, peripheral blood, and spleen are shown in bar graphs. CD11b+Ly6Cmiddle+high MCs have higher TNF-α+ cell percentage. F: Representative MC subset dot plots depict MC subsets in different mouse groups. G: Quantitative analyses of MC subsets in BM, peripheral blood, and spleen are shown in bar graphs. Note that CD11b+Ly6Cmiddle and/or CD11b+Ly6Chigh MC subsets were increased in HHcy and HG mice. Values represent means ± SD. Independent t test (E) or one-way ANOVA (D and G) were used for analysis (n = 8–16). *P < 0.05, **P < 0.01, and ***P < 0.001. FSC, forward scatter; IgG, TNF-α IgG isotype antibody control; SSC, side scatter; Syn, synergy.
Figure 4
Figure 4
HHcy and HG induce inflammatory MC subsets in BM, peripheral blood, and spleen of mice. Tg-hCBS Cbs ApoE−/− mice received intraperitoneal sodium nitrate (vehicle CT) or STZ (50 mg/kg body weight) for 5 consecutive days at 8 weeks old. STZ caused the mice to develop HG (blood Glu ≥300 mg/dL). At 10 weeks old, all mice were switched to a high-fat diet for an additional 2 weeks and killed. BM, peripheral blood, and spleen cells were isolated, stained with anti-CD11b and anti-Ly6C mouse antibodies, and analyzed by flow cytometry. A: Representative nucleated cells, MNC, and MC subset dot plots depict nucleated cells (gate i) and MNCs (gate ii). MNCs are further divided into three subsets: CD11b+Ly6Clow, CD11b+Ly6Cmiddle, and CD11b+Ly6Chigh. B: Superoxide anion levels of different MC subsets were examined by flow cytometry with a free radical sensor, dihydroethidium (DHE). Ly6Chigh MCs, Ly6Cmiddle MCs, and Ly6Clow MCs have the highest, second highest, and lowest levels of superoxide anion, respectively. C: Cells from BM, peripheral blood, and spleen were treated with lipopolysaccharide (0.1 μg/mL) and a Golgi blocker, brefeldin A (1 μL/mL), for 5 h and then stained with antibody against mouse TNF-α and analyzed by flow cytometry. Note that Ly6Cmiddle+high MCs have larger TNF-α+ cell populations than Ly6Clow MCs. D: Quantitative analysis of DHE+ cells in Ly6Clow, Ly6Cmiddle, and Ly6Chigh from spleen. E: Quantitative analyses of TNF-α+ cells in Ly6Clow and Ly6Cmiddle+high from BM, peripheral blood, and spleen are shown in bar graphs. CD11b+Ly6Cmiddle+high MCs have higher TNF-α+ cell percentage. F: Representative MC subset dot plots depict MC subsets in different mouse groups. G: Quantitative analyses of MC subsets in BM, peripheral blood, and spleen are shown in bar graphs. Note that CD11b+Ly6Cmiddle and/or CD11b+Ly6Chigh MC subsets were increased in HHcy and HG mice. Values represent means ± SD. Independent t test (E) or one-way ANOVA (D and G) were used for analysis (n = 8–16). *P < 0.05, **P < 0.01, and ***P < 0.001. FSC, forward scatter; IgG, TNF-α IgG isotype antibody control; SSC, side scatter; Syn, synergy.
Figure 5
Figure 5
HHcy and HG increase M1 MØ and decrease M2 MØ in BM, peripheral blood and spleen of mice. A: Schematic design describing the experimental strategies. Tg-hCBS Cbs ApoE−/− mice received intraperitoneal sodium nitrate (vehicle CT) or STZ (50 mg/kg body weight) daily for 5 days at 8 weeks old. STZ caused the mice to develop HG (blood Glu ≥300 mg/dL). At 10 weeks old, all mice were switched to a high-fat diet for 2 weeks and killed. Cells from mouse BM, peripheral blood, and spleen were incubated with lipopolysaccharide (LPS; 0.1 μg/mL) for 5 h. Suspended cells were stained with mouse antibodies against F4/80 (MØ marker), TNF-α (proinflammatory MØ marker), mannose receptor (anti-inflammatory MØ marker), and assayed by flow cytometry. Two cellular populations, M1 MØ (F4/80+TNF-α+) and M2 MØ (F4/80+MR+), were analyzed separately. B and C: Representative dot plots and quantification of cell suspensions depicting M1 MØ. D and E: Representative dot plots and quantification of M2 MØ in BM, peripheral blood, and spleen. Note that M1 MØs were increased in HHcy and HG mice, whereas M2 MØs were decreased in HHcy and HG mice. The level of MCP-1 (F) and IL-18 (G) in plasma by Luminex and ELISA, respectively. H: Mouse MC and MØ subset differentiation and functions. In the steady state, Ly6Chigh MC differentiate into Ly6Clow MC in the circulation. Ly6Clow MC patrol and are recruited into normal tissues and become M2 MØ. Ly6Chigh MC have a high antimicrobial capability due to their potent capacity of producing reactive oxygen species (ROS) and proinflammatory cytokines. During vascular inflammation, Ly6Chigh MC invade the vessel and polarize to inflammatory M1 MØ, which are characterized by secretion of proinflammatory cytokines. Plain bars represent CT mice. Diagonal bars represent mice on STZ. Values represent means ± SD. One-way ANOVA with post hoc Bonferroni was used for analysis (n = 5–8). *P < 0.05, **P < 0.01, and ***P < 0.001. Syn, synergy.
Figure 5
Figure 5
HHcy and HG increase M1 MØ and decrease M2 MØ in BM, peripheral blood and spleen of mice. A: Schematic design describing the experimental strategies. Tg-hCBS Cbs ApoE−/− mice received intraperitoneal sodium nitrate (vehicle CT) or STZ (50 mg/kg body weight) daily for 5 days at 8 weeks old. STZ caused the mice to develop HG (blood Glu ≥300 mg/dL). At 10 weeks old, all mice were switched to a high-fat diet for 2 weeks and killed. Cells from mouse BM, peripheral blood, and spleen were incubated with lipopolysaccharide (LPS; 0.1 μg/mL) for 5 h. Suspended cells were stained with mouse antibodies against F4/80 (MØ marker), TNF-α (proinflammatory MØ marker), mannose receptor (anti-inflammatory MØ marker), and assayed by flow cytometry. Two cellular populations, M1 MØ (F4/80+TNF-α+) and M2 MØ (F4/80+MR+), were analyzed separately. B and C: Representative dot plots and quantification of cell suspensions depicting M1 MØ. D and E: Representative dot plots and quantification of M2 MØ in BM, peripheral blood, and spleen. Note that M1 MØs were increased in HHcy and HG mice, whereas M2 MØs were decreased in HHcy and HG mice. The level of MCP-1 (F) and IL-18 (G) in plasma by Luminex and ELISA, respectively. H: Mouse MC and MØ subset differentiation and functions. In the steady state, Ly6Chigh MC differentiate into Ly6Clow MC in the circulation. Ly6Clow MC patrol and are recruited into normal tissues and become M2 MØ. Ly6Chigh MC have a high antimicrobial capability due to their potent capacity of producing reactive oxygen species (ROS) and proinflammatory cytokines. During vascular inflammation, Ly6Chigh MC invade the vessel and polarize to inflammatory M1 MØ, which are characterized by secretion of proinflammatory cytokines. Plain bars represent CT mice. Diagonal bars represent mice on STZ. Values represent means ± SD. One-way ANOVA with post hoc Bonferroni was used for analysis (n = 5–8). *P < 0.05, **P < 0.01, and ***P < 0.001. Syn, synergy.
Figure 6
Figure 6
Inflammatory MC and MØ subset populations are positively correlated with plasma Hcy concentrations and negatively correlated with plasma SAM-to-SAH ratios in Tg-hCBS Cbs ApoE−/− mice. Tg-hCBS Cbs ApoE−/− mice received intraperitoneal sodium nitrate (vehicle CT) or STZ (50 mg/kg body weight) daily for 5 days at 8 weeks old. STZ caused the mice to develop HG (blood Glu ≥300 mg/dL). At 10 weeks old, all mice were switched to a high-fat diet for 2 weeks. Fasting Glu levels were measured by HemoCue Glucose 201 (HemoCue Ab, Angelholm, Sweden) before mice were killed. Blood was collected when the mice were killed, and the supernatant was kept at −80°C immediately after centrifugation. Hcy, SAM, and SAH levels were measured by high-performance liquid chromatography (Dr. Teodoro Bottiglieri, Baylor University, Waco, TX). MC subsets were measured as described in Fig 3. A: Correlation between SAM-to-SAH and Hcy. Linear regression analysis was performed between plasma SAM-to-SAH ratios and Hcy. B: Correlation between plasma SAM-to-SAH ratios and Glu were assessed with linear regression analysis. C: Correlations between plasma Hcy levels and Ly6Cmiddle+high MC percentages in mouse BM, peripheral blood, and spleen. Each data point represents one mouse. D: Correlations between plasma SAM-to-SAH ratios and Ly6Cmiddle+high MC percentages in mouse BM, peripheral blood, and spleen. Each data point represents one mouse. Note that SAM-to-SAH ratios were negatively correlated with CD11b+Ly6Cmiddle+high cell percentages in all three tissues. E: Correlations between plasma Hcy levels and M1 MØ percentages in mouse BM, peripheral blood, and spleen. Each data point represents one mouse. F: Correlations between plasma SAM-to-SAH ratios and M1 MØ percentages in mouse BM, peripheral blood, and spleen. Each data point represents one mouse. Note that SAM-to-SAH ratios were negatively correlated with M1 MØ percentages in all three tissues. Probability values are from independent t test (n = 11–21). Syn, synergy.
Figure 7
Figure 7
Inflammatory MC subsets are increased in cultured primary mouse splenocytes treated with l-Hcy plus d-Glu, and transduced Adv-DNMT1 reversed-inflammatory MC differentiation. Splenocytes were isolated from 2-month-old C57BL/6 wild-type mice and cultured. Cells were treated with recombinant interferon-γ (rIFNγ; 100 units/mL) at 0 h. After 24 h, l-Hcy (200 μmol/L), d-Glu (25 mmol/L), l-Glu (25 mmol/L), and/or AZC (1 μmol/L) were added for an additional 48 h for the differentiation study. Cells were stained with mouse antibodies against CD11b and Ly6C and analyzed by flow cytometry. CD11b+Ly6Clow, CD11b+Ly6Cmiddle, and CD11b+Ly6Chigh MCs are defined based on CD11b and Ly6C expression levels. A: Schematic design describes the experimental strategies. B: Representative dot plots depict the distribution of MC subsets. C: MC subset quantifications. D: DNMT1 protein levels were examined by Western blotting with antibodies against DNMT1 and normalized with β-actin expression levels. E: DNMT1 activities. For DNMT1 activity assay, nuclear extracts (20 µg) were prepared and incubated with hemimethylated double-stranded DNA for DNMT1 activity in the presence of [3H]SAM. DNMT1 activities were determined by the radioactivity level of DNA substrates. Expression levels of adenoviral DNMT1 protein were examined by Western blotting (F) and flow cytometry (G). For Western blotting, protein levels were detected by using antibodies against mouse DNMT1 and blotted with β-actin antibody. H: Adenoviral DNMT1 rescue effect. Primary mouse splenocytes were infected with Adv-CT or Adv-DNMT1 at 50 MOI for 24 h and then treated with l-Hcy (200 μmol/L) and/or d-Glu (25 mmol/L) for another 48 h. Quantifications of adenoviral DNMT1 rescue effect on MC subset differentiation were depicted. Note that l-Hcy and d-Glu increased CD11b+Ly6Cmiddle and CD11b+Ly6Chigh MC and that this effect was rescued by DNMT1. Plain bars represent CT groups. Diagonal bars represent d-Glu groups. Dotted bars represent l-Glu groups. Data are representative of three separate experiments and are shown as means ± SD. One-way ANOVA with post hoc Bonferroni was used for analysis. I: Working model. *P < 0.05, **P < 0.01, and ***P < 0.001. GFP, green fluorescent protein; SSC, side scatter; Syn, synergy.
Figure 7
Figure 7
Inflammatory MC subsets are increased in cultured primary mouse splenocytes treated with l-Hcy plus d-Glu, and transduced Adv-DNMT1 reversed-inflammatory MC differentiation. Splenocytes were isolated from 2-month-old C57BL/6 wild-type mice and cultured. Cells were treated with recombinant interferon-γ (rIFNγ; 100 units/mL) at 0 h. After 24 h, l-Hcy (200 μmol/L), d-Glu (25 mmol/L), l-Glu (25 mmol/L), and/or AZC (1 μmol/L) were added for an additional 48 h for the differentiation study. Cells were stained with mouse antibodies against CD11b and Ly6C and analyzed by flow cytometry. CD11b+Ly6Clow, CD11b+Ly6Cmiddle, and CD11b+Ly6Chigh MCs are defined based on CD11b and Ly6C expression levels. A: Schematic design describes the experimental strategies. B: Representative dot plots depict the distribution of MC subsets. C: MC subset quantifications. D: DNMT1 protein levels were examined by Western blotting with antibodies against DNMT1 and normalized with β-actin expression levels. E: DNMT1 activities. For DNMT1 activity assay, nuclear extracts (20 µg) were prepared and incubated with hemimethylated double-stranded DNA for DNMT1 activity in the presence of [3H]SAM. DNMT1 activities were determined by the radioactivity level of DNA substrates. Expression levels of adenoviral DNMT1 protein were examined by Western blotting (F) and flow cytometry (G). For Western blotting, protein levels were detected by using antibodies against mouse DNMT1 and blotted with β-actin antibody. H: Adenoviral DNMT1 rescue effect. Primary mouse splenocytes were infected with Adv-CT or Adv-DNMT1 at 50 MOI for 24 h and then treated with l-Hcy (200 μmol/L) and/or d-Glu (25 mmol/L) for another 48 h. Quantifications of adenoviral DNMT1 rescue effect on MC subset differentiation were depicted. Note that l-Hcy and d-Glu increased CD11b+Ly6Cmiddle and CD11b+Ly6Chigh MC and that this effect was rescued by DNMT1. Plain bars represent CT groups. Diagonal bars represent d-Glu groups. Dotted bars represent l-Glu groups. Data are representative of three separate experiments and are shown as means ± SD. One-way ANOVA with post hoc Bonferroni was used for analysis. I: Working model. *P < 0.05, **P < 0.01, and ***P < 0.001. GFP, green fluorescent protein; SSC, side scatter; Syn, synergy.

References

    1. Selhub J, Jacques PF, Bostom AG, et al. Association between plasma homocysteine concentrations and extracranial carotid-artery stenosis. N Engl J Med 1995;332:286–291 - PubMed
    1. Stühlinger MC, Oka RK, Graf EE, et al. Endothelial dysfunction induced by hyperhomocyst(e)inemia: role of asymmetric dimethylarginine. Circulation 2003;108:933–938 - PubMed
    1. Smulders YM, Rakic M, Slaats EH, et al. Fasting and post-methionine homocysteine levels in NIDDM. Determinants and correlations with retinopathy, albuminuria, and cardiovascular disease. Diabetes Care 1999;22:125–132 - PubMed
    1. Hofmann MA, Kohl B, Zumbach MS, et al. Hyperhomocyst(e)inemia and endothelial dysfunction in IDDM. Diabetes Care 1998;21:841–848 - PubMed
    1. Hoogeveen EK, Kostense PJ, Beks PJ, et al. Hyperhomocysteinemia is associated with an increased risk of cardiovascular disease, especially in non-insulin-dependent diabetes mellitus: a population-based study. Arterioscler Thromb Vasc Biol 1998;18:133–138 - PubMed

Publication types

Substances