. 2014 Nov 30;5(22):11193-208.
doi: 10.18632/oncotarget.1933.

The IGF-1 receptor inhibitor picropodophyllin potentiates the anti-myeloma activity of a BH3-mimetic

Affiliations

The IGF-1 receptor inhibitor picropodophyllin potentiates the anti-myeloma activity of a BH3-mimetic

Liesbeth Bieghs et al. Oncotarget. .

Abstract

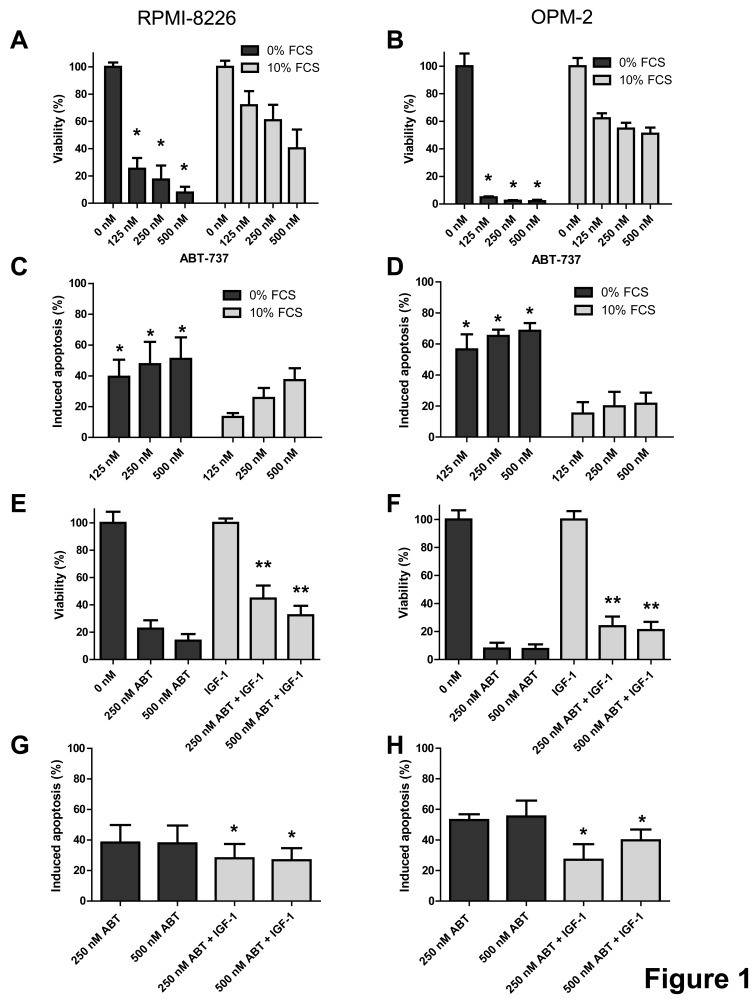
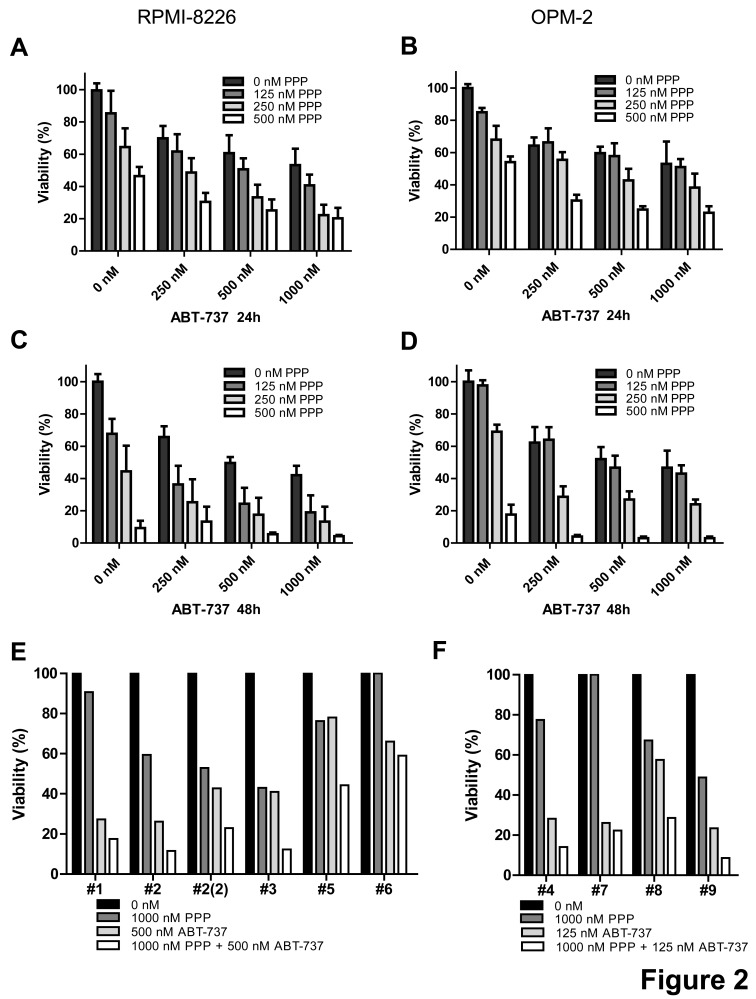
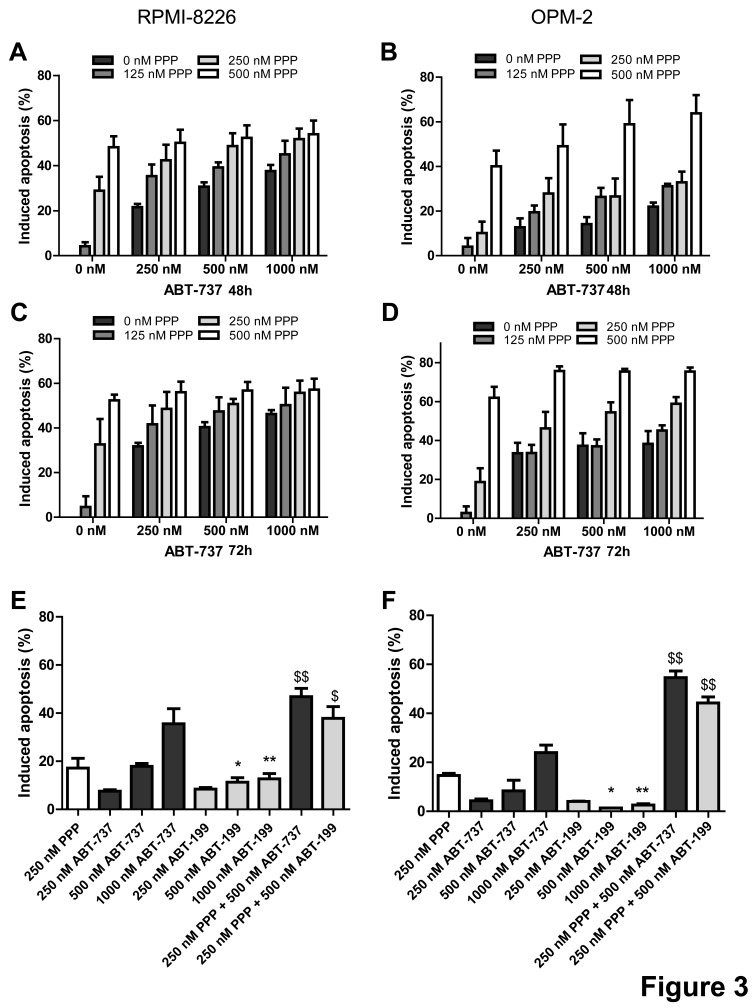
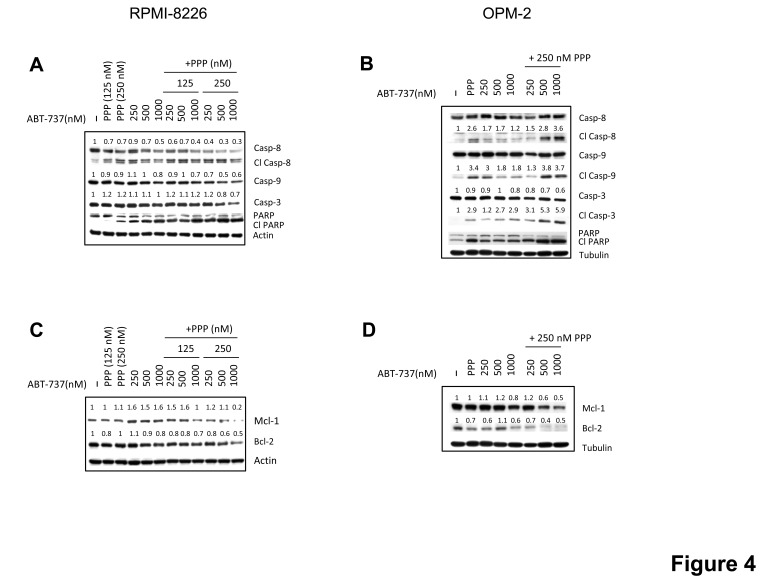
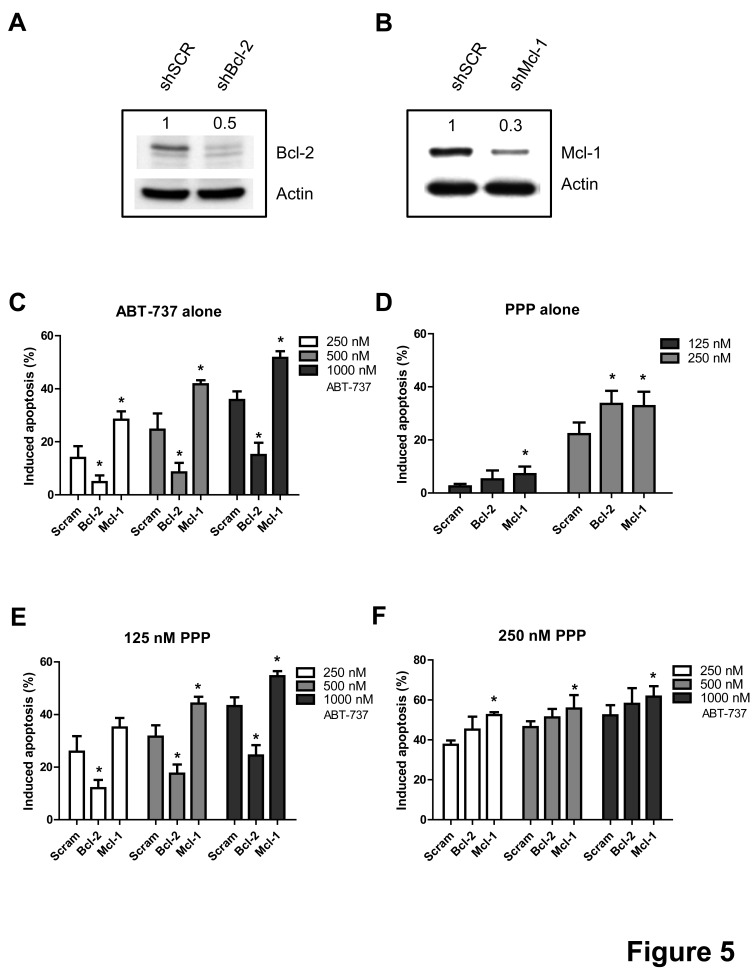
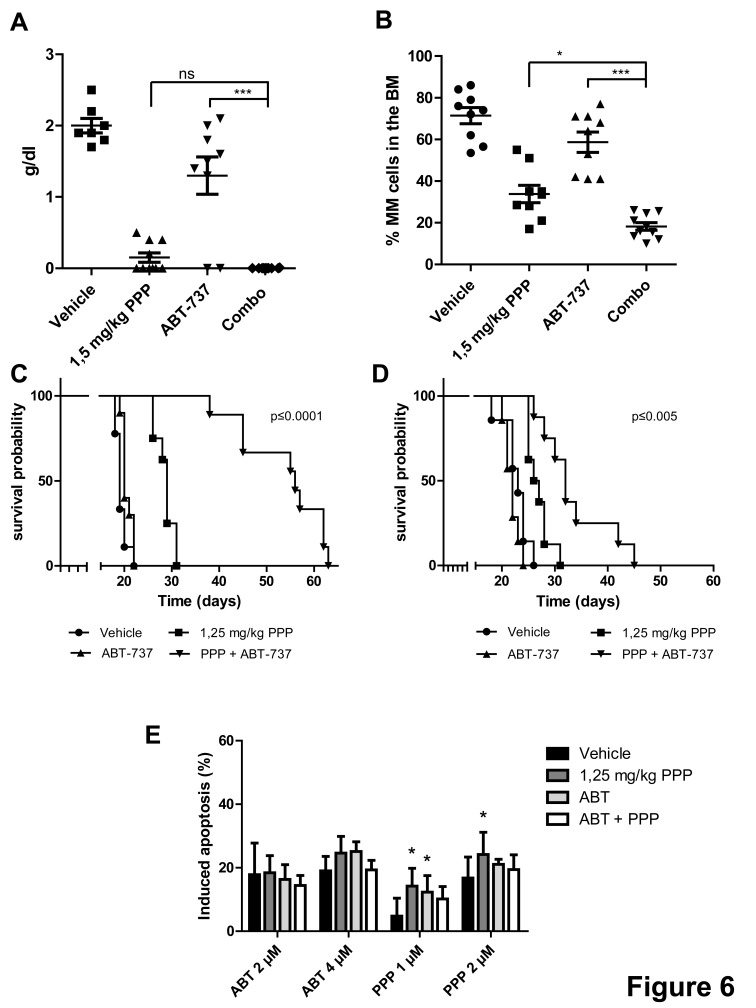
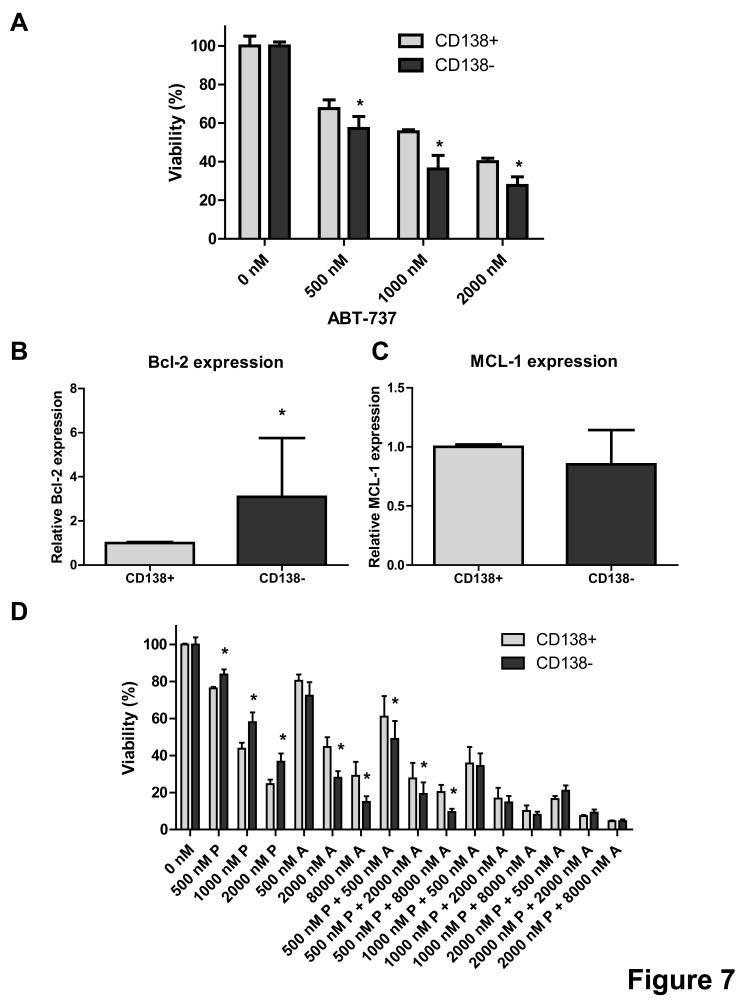
The ABT-analogous 737, 263 and 199 are BH3 mimetics showing potent anti-myeloma (MM) activity, but only on defined molecular subgroups of MM patients presenting a Bcl-2high/Mcl-1low profile. IGF-1 is a major survival factor in MM regulating the expression of Bcl-2 proteins and might therefore be a resistance factor to these ABT-analogous. We first show that IGF-1 protected human MM cell lines (HMCLs) against ABT-737. Concurrently, the IGF-1 receptor inhibitor picropodophyllin (PPP) synergistically sensitized HMCL, primary human MM and murine 5T33MM cells to ABT-737 and ABT-199 by further decreasing cell viability and enhancing apoptosis. Knockdown of Bcl-2 by shRNA protected MM cells to ABT-737, while Mcl-1 shRNA sensitized the cells. PPP overcame the Bcl-2 dependency of ABT-737, but failed to completely overcome the protective effect of Mcl-1. In vivo, co-treatment of 5T33MM bearing mice significantly decreased tumor burden and prolonged overall survival both in a prophylactic and therapeutic setting. Interestingly, proteasome inhibitor resistant CD138- 5T33MM cells were more sensitive to ABT-737, whereas PPP alone targeted the CD138+ cells more effectively. After co-treatment, both subpopulations were targeted equally. Together, the combination of an IGF-1R inhibitor and an ABT-analogue displays synergistic anti-myeloma activity providing the rational for further (pre)clinical testing.


Conflict of interest statement

Conflict of interest

Olle Larson and Magnus Axelson have ownership interest (including patents) on Owner of patent for picropodophyllin. The remaining authors declare no potential conflict of interest.

Figures

Figure 1
Figure 1. IGF-1 protects myeloma cells against ABT-737 induced cell death
A-D: Serum protects MM cells to ABT-737. RPMI-8226 (A, C) and OPM-2 (B, D) cells were cultured in RPMI-1640 medium supplemented with or without 10% FCS and treated with different concentrations of ABT-737 (125, 250 and 500 nM). (A, B): The effect on cell viability was evaluated after 48h by using a CellTiter-Glo Assay. Results are expressed as the relative viability compared to untreated cells assayed in serum free medium or complete growth medium. (C, D): The effect on apoptosis was evaluated after 48h by an AnnexinV-FITC/7′AAD staining followed by FACS analysis. Results are expressed as the percentage induced apoptosis compared to control cells cultured in serum free medium or complete growth medium. Columns and error bars indicate mean ± SD of at least 4 independent experiments. * indicate p-values of ≤0.05 comparing treatment in serum free medium to treatment in complete growth medium. E-H: IGF-1 protects MM cells to ABT-737. RPMI-8226 (E, G) and OPM-2 (F, H) cells were serum starved overnight and pre-stimulated or not with IGF-1 (200 ng/ml) for 3h before ABT-737 (250 and 500 nM) was added. (E, F): Effect on cell viability after 48h was evaluated by using a CellTiter-Glo Assay. Results are expressed as the relative number of viable cells compared to control cells or IGF-1 condition. (G, H): Effect on apoptosis after 48h was determined by an AnnexinV-FITC/7′AAD staining followed by FACS analysis. Results are expressed as the percentage induced apoptosis compared to control cells or IGF-1 condition. Columns and error bars are the mean ± SD of at least 4 individual experiments. * and ** indicate p-values of respectively ≤0.05 and ≤0.01 comparing ABT-737 treatment with or without IGF-1.
Figure 2
Figure 2. PPP synergistically enhances the anti-myeloma activity of ABT-737
A-D: PPP + ABT-737 synergistically decreased HMCL viability. RPMI-8226 (A, C) and OPM-2 (B, D) cells were cultured with 0 nM (black bars), 125 nM (dark grey), 250 nM (light grey) or 500 nM (white) PPP either alone or in combination with indicated concentrations of ABT-737 for 24h (A, B) and 48h (C, D). A-D: Effect on cell viability was evaluated by using a CellTiter-Glo Assay. Results are expressed as the relative viability compared to control cells. Bars and error bars indicate mean ± SD of at least 3 independent experiments. P-values and combination indexes after 48h are shown in Table 1. E-F: Effect of co-treatment on primary human MM cells. CD138+ cells were purified from BM aspirates from 9 MM patients. E: Primary MM cells of patient 1, 2, 3, 5 and 6 were treated with 1 μM PPP, 500 nM ABT-737 or a combination of both. F: Primary MM cells of patient 4, 7, 8 and 9 were treated with 1 μM PPP, 125 nM ABT-737 or a combination of both. The effect on cell viability was determined by the CellTiter-Glo assay after 24h. Results are expressed as the relative viability compared to untreated cells. # indicates patient number.
Figure 3
Figure 3. PPP potentiates ABT-737 and ABT-199 mediated apoptosis
A-D: PPP increased ABT-737 mediated apoptosis. RPMI-8226 (A, C) and OPM-2 (B, D) cells were treated with 0 nM (black bars), 125 nM (dark grey), 250 nM (light grey) or 500 nM (white) PPP either alone or in combination with indicated concentrations of ABT-737 for 48h (A, B) and 72h (C, D). P-values and combination indexes after 48h are shown in Table 1. E-F: PPP increased ABT-199 mediated apoptosis. RPMI-8226 (E) and OPM-2 (F) cells were treated with 250 nM PPP either alone or in combination with indicated concentrations of ABT-737 or ABT-199 for 48h. Effect on apoptosis was determined by an AnnexinV-FITC/7′AAD staining followed by FACS analysis. Results are expressed as the percentage induced apoptosis compared to untreated cells. Columns and error bars are the mean ± SD from at least 3 individual experiments. * and ** indicate p-values of respectively ≤0.05 and ≤0.01 comparing ABT-737 with ABT-199, while $ and $$ indicate p-values of respectively ≤0.05 and ≤0.01 compared to both single agents.
Figure 4
Figure 4. Effect of co-treatment on caspases activation and expression of Mcl-1 and Bcl-2
RPMI-8226 (A, C) and OPM-2 (B, D) cells were cultured with indicated concentrations of PPP and/or ABT-737 and the expression of Bcl-2 and Mcl-1 (24h) and cleavage of caspase-3, -8, -9 and PARP-1 (48h) was analysed by western blot. β-actin and α-tubulin were used as loading control for respectively RPMI-8226 and OPM-2 cells. One experiment representative of 3 is shown. For selected proteins, optical density was determined by ImageJ, normalized for loading control and put relative to untreated control.
Figure 5
Figure 5. PPP overcomes the Bcl-2 dependency of ABT-737
A-B: Silencing of Bcl-2 (A) or Mcl-1 (B). RPMI-8226 cells were stably transfected with a lentiviral vector containing a shRNA cassette against either Bcl-2 or Mcl-1. Silencing of the respective proteins was confirmed by comparing expression between ShScrambled and knocked-down RPMI-8226 cells by western blot analysis. Optical density was determined by ImageJ. One experiment representative of 3 is shown. C-F: Effect of Bcl-2 or Mcl-1 silencing on the lethality induced by PPP and/or ABT-737. Cells were treated for 48h with either ABT-737 (250, 500 and 1000 nM) (C), PPP (125 and 250 nM) (D) or a combination of both (E-F) and the effect on apoptosis was evaluated by an AnnexinV-APC/7′AAD staining. Results represent the percentage induced apoptosis compared to untreated scrambled, shBcl-2 or shMcl-1 cells. Columns and error bars are the mean ± SD from 3 individual experiments. * indicates p-value of <0.05 versus ShScrambled RPMI-8226 cells.
Figure 6
Figure 6. Co-treatment significantly reduces tumor burden and prolongs overall survival of 5T33MM inoculated mice
A-B: In vivo effect of PPP and/or ABT-737 on tumor burden. 5T33MM inoculated mice were divided in 4 groups (n=10) and either treated with vehicle, 1.5 mg/kg PPP (daily in food), 75 mg/kg ABT-737 (intraperitoneal injection (i.p.) 6 days/week) or the combination of both. When the first mouse showed signs of morbidity all mice were sacrificed simultaneously and the effect on serum M-protein levels and BM plasmacytosis was determined. * p<0.05, *** p<0.001. C-D: Effect of co-treatment on the survival rates in a prophylactic (C) and a therapeutic setting (D). Mice were assigned to different treatment groups receiving either vehicle (n=10), 75 mg/kg ABT-737 (n=10), 1.25 mg/kg PPP (n=10), or a combination of both (n=10). Treatment started either 1 (prophylactic setting) or 9 day(s) (therapeutic setting) after tumor inoculation. Each mouse was sacrificed when it showed clear signs of morbidity and the effect on the survival rates was determined by Kaplan-Meier analysis. E: In vitro drug response of 5T33MMvv myeloma cells. Upon showing clear signs of morbidity, MM cells were isolated from mice treated either with vehicle, PPP, ABT-737 or a combination of both as described in panel D. Cells were then treated for 24h with ABT-737 (2 and 4 μM) or PPP (1 and 2 μM) and the effect on apoptosis was evaluated by an AnnexinV-FITC/7′AAD staining. Results are expressed as the percentage induced apoptosis. Columns and error bars are the mean ± SD from at least 3 individual mice. * indicate p-values of ≤0.05 compared to cells obtained from vehicle mice.
Figure 7
Figure 7. Combination of PPP and ABT-737 equally targets CD138+ and CD138− MM subpopulations
A: ABT-737 sensitivity of mature CD138+ and immature CD138− 5T33MM cells. Sorted populations were incubated with different concentrations of ABT-737 (0.5, 1 and 2 μM). Cell viability was analyzed after 24h by a CellTiter-Glo assay. B-C: Relative Bcl-2 (B) and Mcl-1 (C) mRNA expression in the 2 subpopulations. mRNA expression was evaluated by quantitative realtime RT-PCR. The Bcl-2 and Mcl-1 gene expression was normalized to GAPDH. Data are presented as relative mRNA expression compared to CD138+ cells. Bars and error bars indicate mean ± SD of 4 individual mice. D: Sensitivity of the CD138+ and CD138− 5T33MM cells to ABT-737 alone and in combination with PPP. Sorted populations were incubated with PPP (0.5, 1 and 2 μM), ABT-737 (0.5, 2 and 8 μM) or a combination of both. After 24h, the viability was measured by a CellTiter-Glo assay. Results are given as the percentage viability relative to control. Bars and error bars indicate mean ± SD of at least 3 independent experiments. * indicates p value of <0.05, ** p value of <0.01 comparing CD138− cells against CD138+ cells.

References

    1. Mahindra A, Laubach J, Raje N, Munshi N, Richardson PG, Anderson K. Latest advances and current challenges in the treatment of multiple myeloma. Nature reviews Clinical oncology. 2012;9:135–143. - PubMed
    1. Adams JM, Cory S. The Bcl-2 apoptotic switch in cancer development and therapy. Oncogene. 2007;26:1324–1337. - PMC - PubMed
    1. Yip KW, Reed JC. Bcl-2 family proteins and cancer. Oncogene. 2008;27:6398–6406. - PubMed
    1. Kuroda J, Taniwaki M. Involvement of BH3-only proteins in hematologic malignancies. Critical reviews in oncology/hematology. 2009;71(2):89–101. - PubMed
    1. Scarfo L, Ghia P. Reprogramming cell death: BCL2 family inhibition in hematological malignancies. Immunol Lett. 2013;155:36–39. - PubMed

Publication types

MeSH terms