Identification of diet-derived constituents as potent inhibitors of intestinal glucuronidation
- PMID: 25008344
- PMCID: PMC4164973
- DOI: 10.1124/dmd.114.059451
Identification of diet-derived constituents as potent inhibitors of intestinal glucuronidation
Abstract
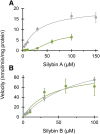
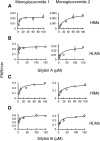
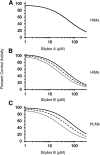
Drug-metabolizing enzymes within enterocytes constitute a key barrier to xenobiotic entry into the systemic circulation. Furanocoumarins in grapefruit juice are cornerstone examples of diet-derived xenobiotics that perpetrate interactions with drugs via mechanism-based inhibition of intestinal CYP3A4. Relative to intestinal CYP3A4-mediated inhibition, alternate mechanisms underlying dietary substance-drug interactions remain understudied. A working systematic framework was applied to a panel of structurally diverse diet-derived constituents/extracts (n = 15) as inhibitors of intestinal UDP-glucuronosyl transferases (UGTs) to identify and characterize additional perpetrators of dietary substance-drug interactions. Using a screening assay involving the nonspecific UGT probe substrate 4-methylumbelliferone, human intestinal microsomes, and human embryonic kidney cell lysates overexpressing gut-relevant UGT1A isoforms, 14 diet-derived constituents/extracts inhibited UGT activity by >50% in at least one enzyme source, prompting IC(50) determination. The IC(50) values of 13 constituents/extracts (≤10 μM with at least one enzyme source) were well below intestinal tissue concentrations or concentrations in relevant juices, suggesting that these diet-derived substances can inhibit intestinal UGTs at clinically achievable concentrations. Evaluation of the effect of inhibitor depletion on IC(50) determination demonstrated substantial impact (up to 2.8-fold shift) using silybin A and silybin B, two key flavonolignans from milk thistle (Silybum marianum) as exemplar inhibitors, highlighting an important consideration for interpretation of UGT inhibition in vitro. Results from this work will help refine a working systematic framework to identify dietary substance-drug interactions that warrant advanced modeling and simulation to inform clinical assessment.
Copyright © 2014 by The American Society for Pharmacology and Experimental Therapeutics.
Figures


Similar articles
-
Milk Thistle Constituents Inhibit Raloxifene Intestinal Glucuronidation: A Potential Clinically Relevant Natural Product-Drug Interaction.Drug Metab Dispos. 2015 Sep;43(9):1353-9. doi: 10.1124/dmd.115.065086. Epub 2015 Jun 12. Drug Metab Dispos. 2015. PMID: 26070840 Free PMC article.
-
Identification of Intestinal UDP-Glucuronosyltransferase Inhibitors in Green Tea (Camellia sinensis) Using a Biochemometric Approach: Application to Raloxifene as a Test Drug via In Vitro to In Vivo Extrapolation.Drug Metab Dispos. 2018 May;46(5):552-560. doi: 10.1124/dmd.117.079491. Epub 2018 Feb 21. Drug Metab Dispos. 2018. PMID: 29467215 Free PMC article.
-
A systematic approach to evaluate herb-drug interaction mechanisms: investigation of milk thistle extracts and eight isolated constituents as CYP3A inhibitors.Drug Metab Dispos. 2013 Sep;41(9):1662-70. doi: 10.1124/dmd.113.052563. Epub 2013 Jun 25. Drug Metab Dispos. 2013. PMID: 23801821 Free PMC article.
-
Natural and synthetic inhibitors of UDP-glucuronosyltransferase.Pharmacol Ther. 2001 Feb;89(2):171-86. doi: 10.1016/s0163-7258(00)00109-1. Pharmacol Ther. 2001. PMID: 11316519 Review.
-
Potential of herb-drug / herb interactions between substrates and inhibitors of UGTs derived from herbal medicines.Pharmacol Res. 2019 Dec;150:104510. doi: 10.1016/j.phrs.2019.104510. Epub 2019 Oct 31. Pharmacol Res. 2019. PMID: 31678209 Review.
Cited by
-
Isolated Silymarin Flavonoids Increase Systemic and Hepatic Bilirubin Concentrations and Lower Lipoperoxidation in Mice.Oxid Med Cell Longev. 2019 Feb 12;2019:6026902. doi: 10.1155/2019/6026902. eCollection 2019. Oxid Med Cell Longev. 2019. PMID: 30891115 Free PMC article.
-
Chirality Matters: Biological Activity of Optically Pure Silybin and Its Congeners.Int J Mol Sci. 2021 Jul 23;22(15):7885. doi: 10.3390/ijms22157885. Int J Mol Sci. 2021. PMID: 34360650 Free PMC article. Review.
-
Investigating the Contribution of Major Drug-Metabolising Enzymes to Possum-Specific Fertility Control.Int J Mol Sci. 2023 May 29;24(11):9424. doi: 10.3390/ijms24119424. Int J Mol Sci. 2023. PMID: 37298375 Free PMC article.
-
Milk Thistle Constituents Inhibit Raloxifene Intestinal Glucuronidation: A Potential Clinically Relevant Natural Product-Drug Interaction.Drug Metab Dispos. 2015 Sep;43(9):1353-9. doi: 10.1124/dmd.115.065086. Epub 2015 Jun 12. Drug Metab Dispos. 2015. PMID: 26070840 Free PMC article.
-
Refined Prediction of Pharmacokinetic Kratom-Drug Interactions: Time-Dependent Inhibition Considerations.J Pharmacol Exp Ther. 2021 Jan;376(1):64-73. doi: 10.1124/jpet.120.000270. Epub 2020 Oct 22. J Pharmacol Exp Ther. 2021. PMID: 33093187 Free PMC article.
References
-
- Biasutto L, Zoratti M. (2014) Prodrugs of quercetin and resveratrol: a strategy under development. Curr Drug Metab 15:77–95 - PubMed
Publication types
MeSH terms
Substances
Grants and funding
LinkOut - more resources
Full Text Sources
Other Literature Sources

