. 2014 Jul 10:4:5647.
doi: 10.1038/srep05647.

Scanning focused refractive-index microscopy

Affiliations

Scanning focused refractive-index microscopy

Teng-Qian Sun et al. Sci Rep. .

Abstract

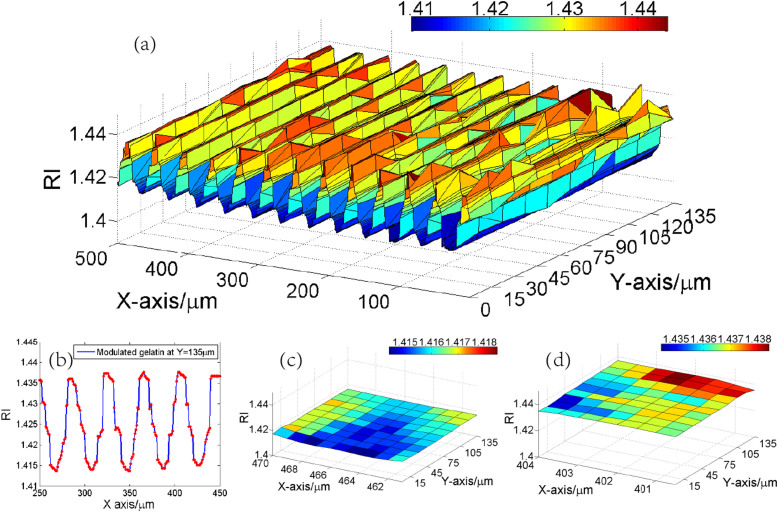
We present a novel scanning focused refractive-index microscopy (SFRIM) technique to obtain the refractive index (RI) profiles of objects. The method uses a focused laser as the light source, and combines the derivative total reflection method (DTRM), projection magnification, and scanning technique together. SFRIM is able to determine RIs with an accuracy of 0.002, and the central spatial resolution achieved is 1 µm, which is smaller than the size of the focal spot. The results of measurements carried out on cedar oil and a gradient-refractive-index (GRIN) lens agree well with theoretical expectations, verifying the accuracy of SFRIM. Furthermore, using SFRIM, to the best of our knowledge we have extracted for the first time the RI profile of a periodically modulated photosensitive gelatin sample. SFRIM is the first RI profile-resolved reflected light microscopy technique that can be applied to scattering and absorbing samples. SFRIM enables the possibility of performing RI profile measurements in a variety of applications, including optical waveguides, photosensitive materials and devices, photorefractive effect studies, and RI imaging in biomedical fields.


Figures

Figure 1
Figure 1. Structure diagram of SFRIM.
L is a He-Ne laser, O is the long work distance objective lens, S is the sample, P is the prism, D is the detector, and T is the translation stage. ϕ is the apex angle of the prism. XY-plane is horizontal. Central beam of the collimated beam is in YZ-plane, and the prism-sample interface is parallel to the XY-plane. The collimated beam out from the laser is focused on the prism-sample interface by the objective lens. Intensity of the reflected light is recorded by linear detector. The computer receives and analyzes data from the detector and controls movement of the translation stages. The enlarged diagram shows the relationship between the detected area and the illuminated spot. IAD is the imager area of the detector. IA is the illuminated area on the sample and CDA is the correspondingly detected area. The spatial resolution of SFRIM is defined as the length on each direction of the detected area, which is Sx along X-axis, and Sy along Y-axis.
Figure 2
Figure 2. Propagation of the light through the SFRIM system.
c is the distance between the objective and the prism. d is the distance between the prism and the detector. b1 and b2 are the distances from the focal spot to the air-prism and prism-air interface, respectively. Propagation direction of the central beam of the collimated beam is along the j-axis and illuminate pixel N0. φi and θi are incident angle of the light that illuminated pixel Ni on the air-prism interface and prism-sample interface, respectively.
Figure 3
Figure 3
(a) Normalized intensity of reflected light curves for air, sample and background. The curves are normalized with respect to the maximum value of the intensity of the air. (b) Reflectance curve of sample and its first derivative curve. (c) Normalized reflected intensity of glycol, glycerol, cedar oil and background. (d) Distribution of reflectance curves for glycol, glycerol and cedar oil. (e) First derivative of reflectance curves for glycol, glycerol and cedar oil. It shows that information of reflected light with θi ∈ (θc − 1°,θc + 1°) is sufficient to confirm the peak of first derivative of reflectance-angle curve.
Figure 4
Figure 4
(a) Central part of RI profile of a GRIN lens scanned by SFRIM. (b) Measured and theoretical RI profile of the GRIN lens along the X-axis at Y = 90 µm. There is slight departure at the fringe area. Photo of the arc-shaped area is shown in supporting material. (c) Measured and theoretical RI profile along the Y-axis at X = 835 µm. The measured data departure from theoretical expectation is less than 0.001.
Figure 5
Figure 5
(a) RI profile of the modulated gelatin. (b) Detailed RI profile of the modulated gelatin along the X-axis at Y = 135 µm, X ∈ [250,450] µm. (c) RIs for the valley of the modulated gelatin. (d) RIs for the peak of the modulated gelatin.

References

    1. Ergin T., Stenger N., Brenner P., Pendry J. B. & Wegener M. Three-dimensional invisibility cloak at optical wavelengths. Science 328, 337–339 (2010). - PubMed
    1. Lie R. et al. Broadband ground-plane cloak. Science 323, 366–369 (2009). - PubMed
    1. Leonhardt U. Optical conformal mapping. Science 312, 1777–1780 (2006). - PubMed
    1. Yang Y. et al. Optofluidic waveguide as a transformation optics device for lightwave bending and manipulation. nat. commun. 3, 651 (2012). - PMC - PubMed
    1. Sazio P. J. A. et al. Microstructured optical fibers as high-pressure microfluidic reactors. Science 311, 1583–1586 (2006). - PubMed

Publication types