. 2014 Jul 10;511(7508):177-83.
doi: 10.1038/nature13551. Epub 2014 Jul 2.

Abnormalities in human pluripotent cells due to reprogramming mechanisms

Affiliations

Abnormalities in human pluripotent cells due to reprogramming mechanisms

Hong Ma et al. Nature. .

Abstract

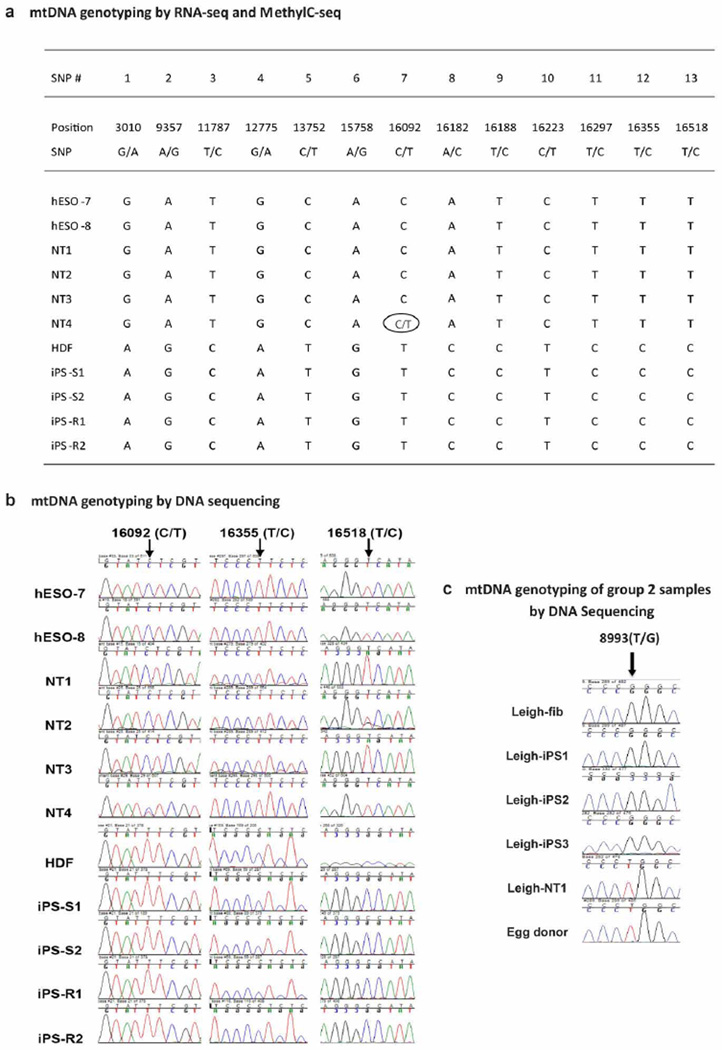
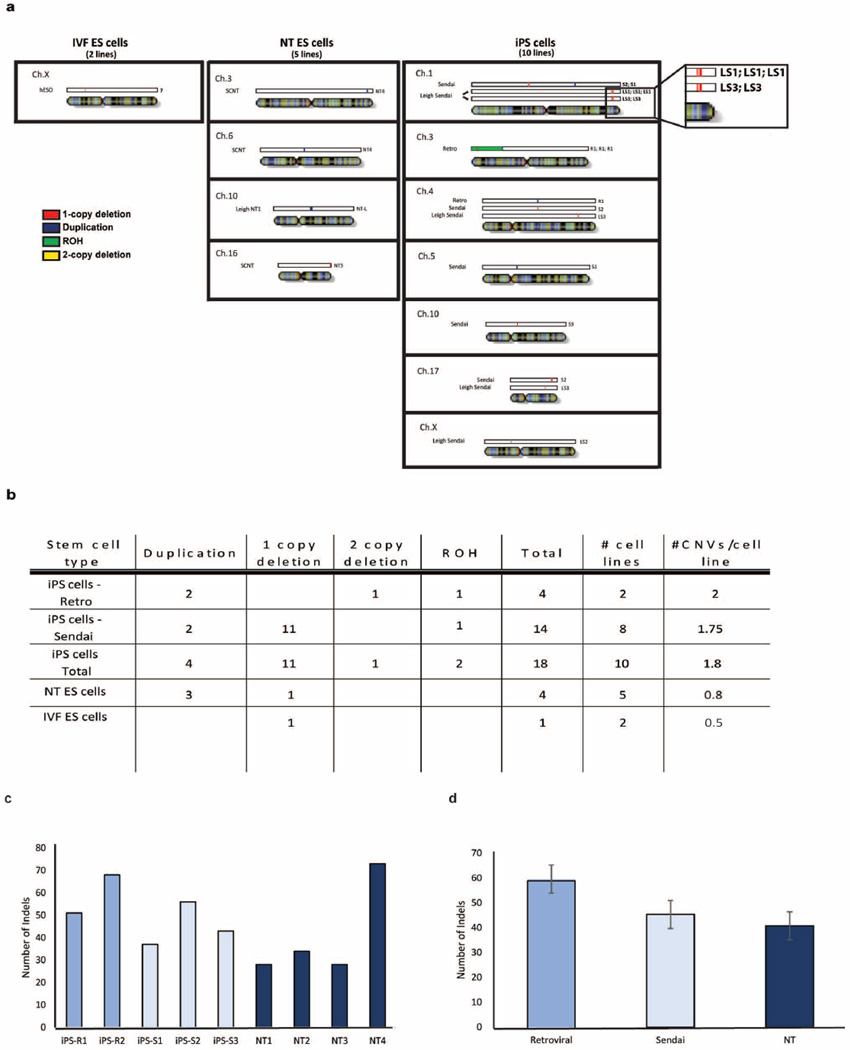
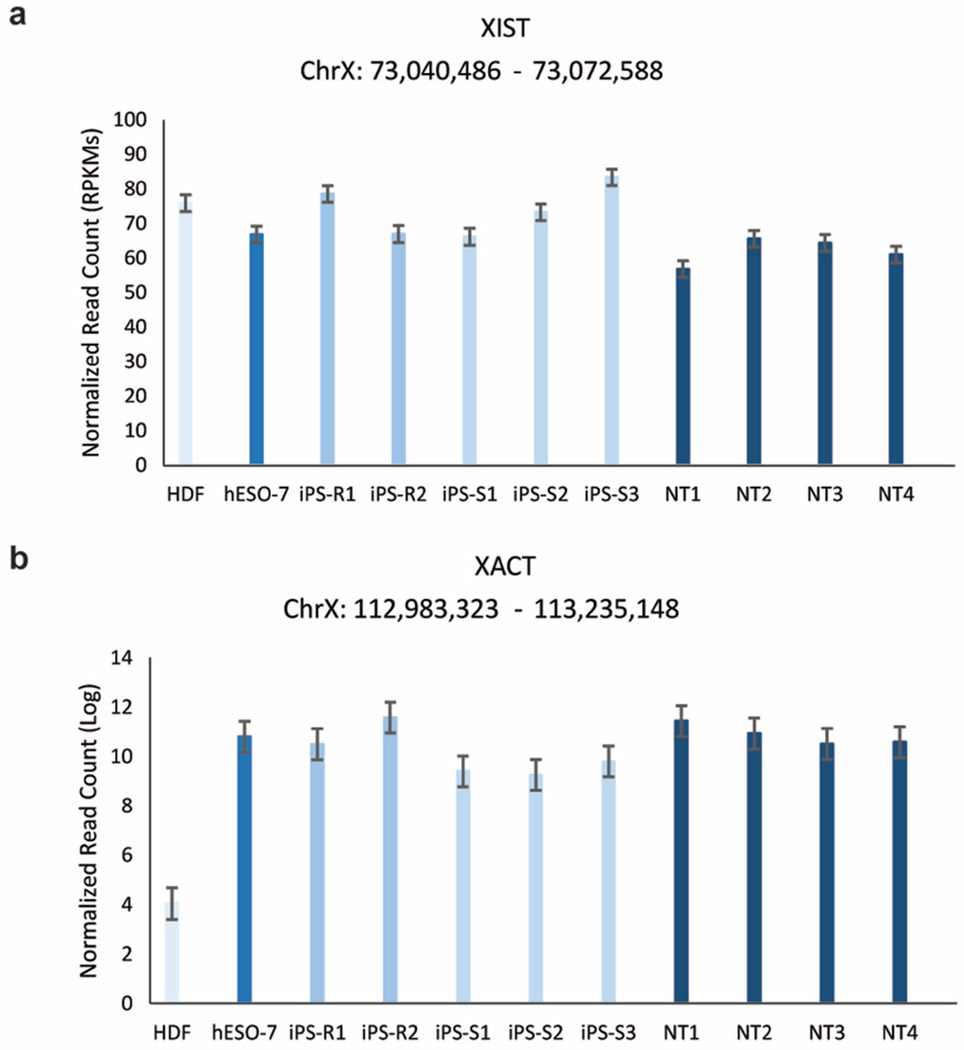
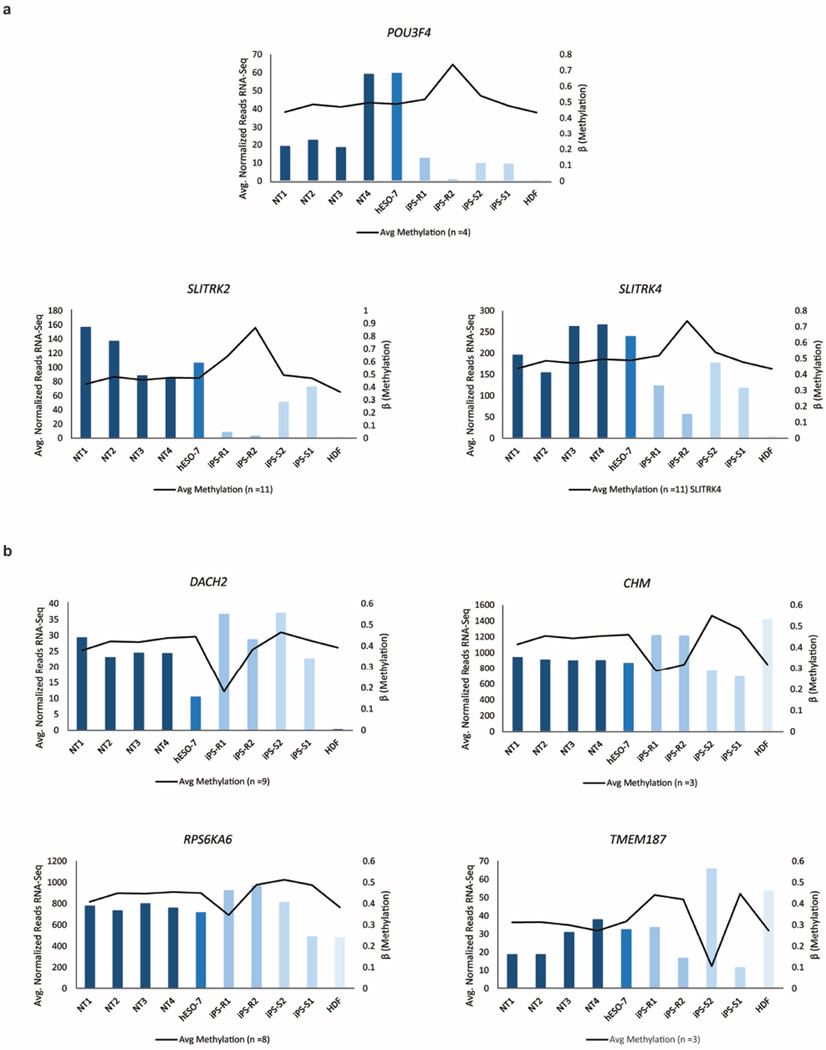
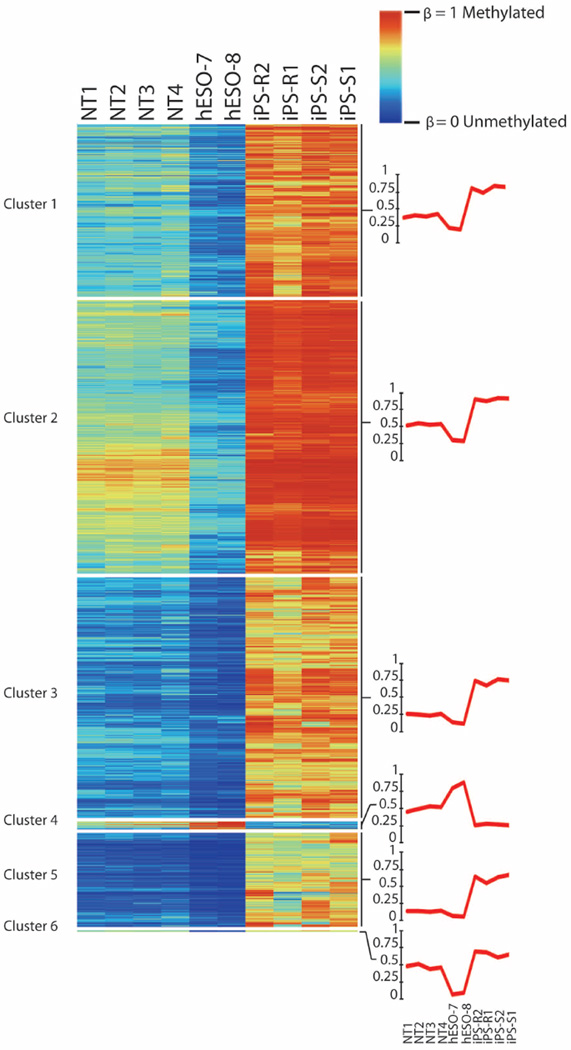
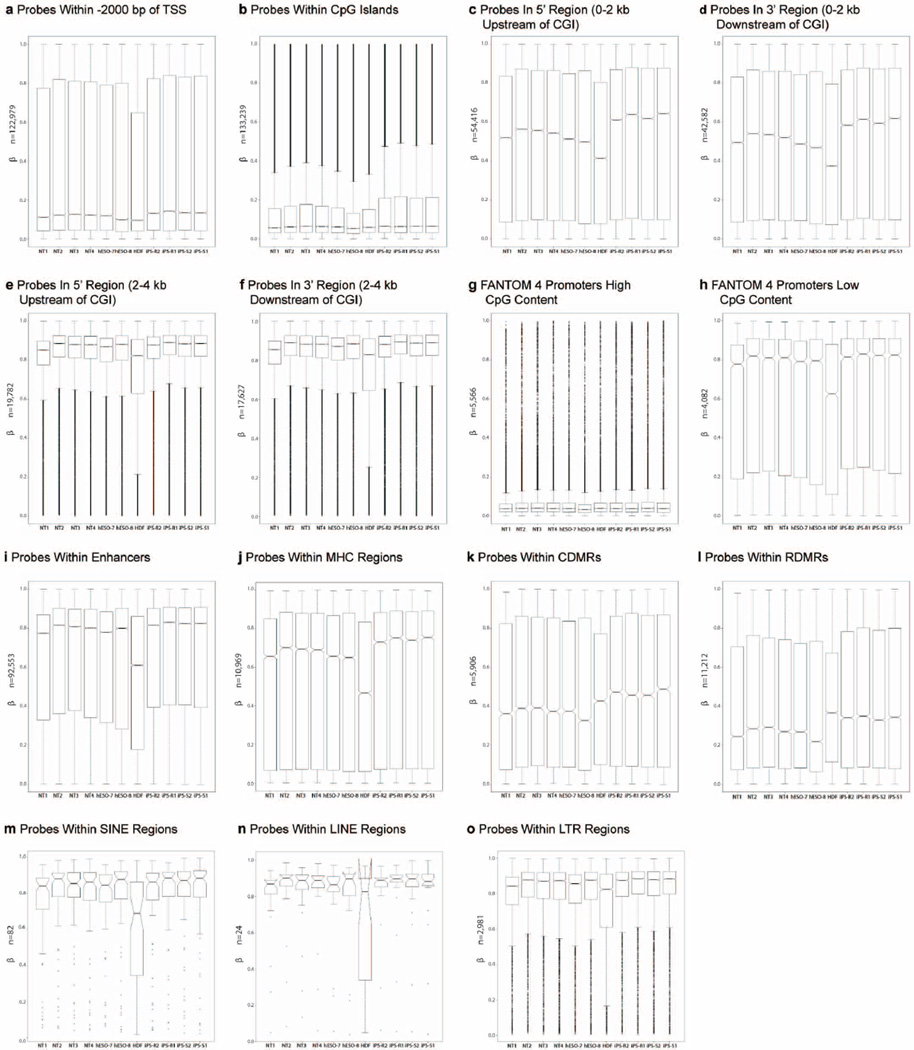
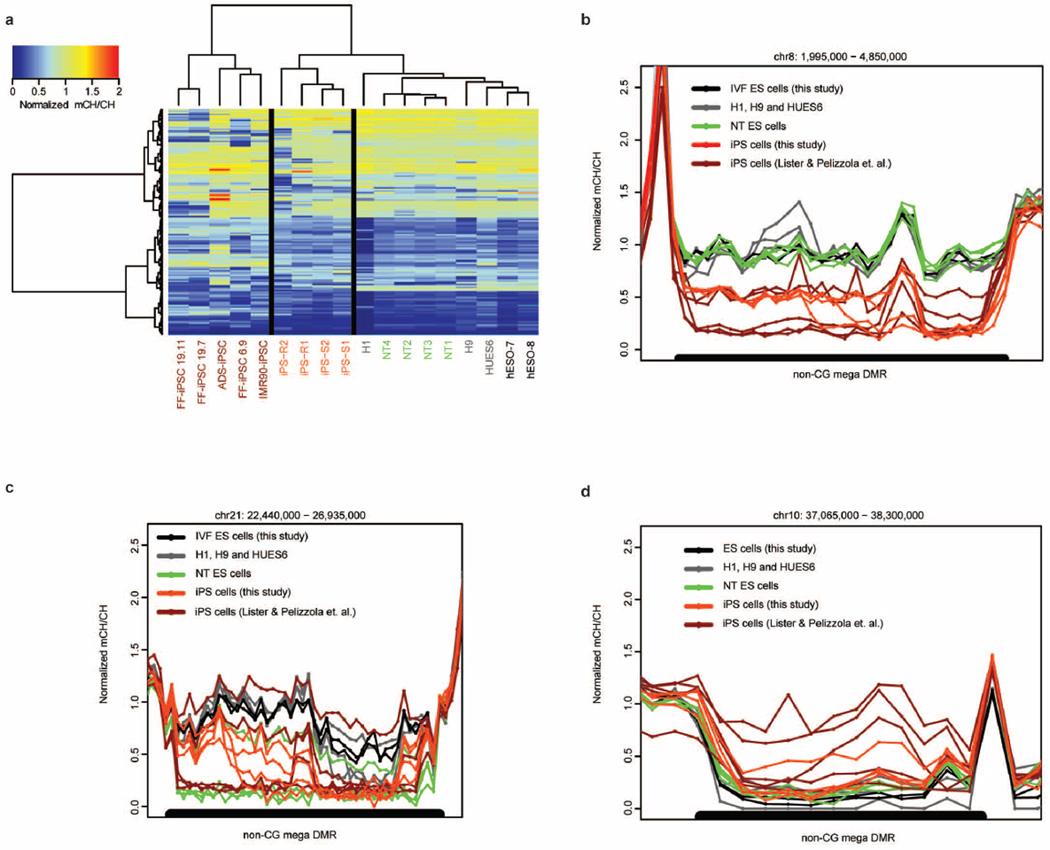
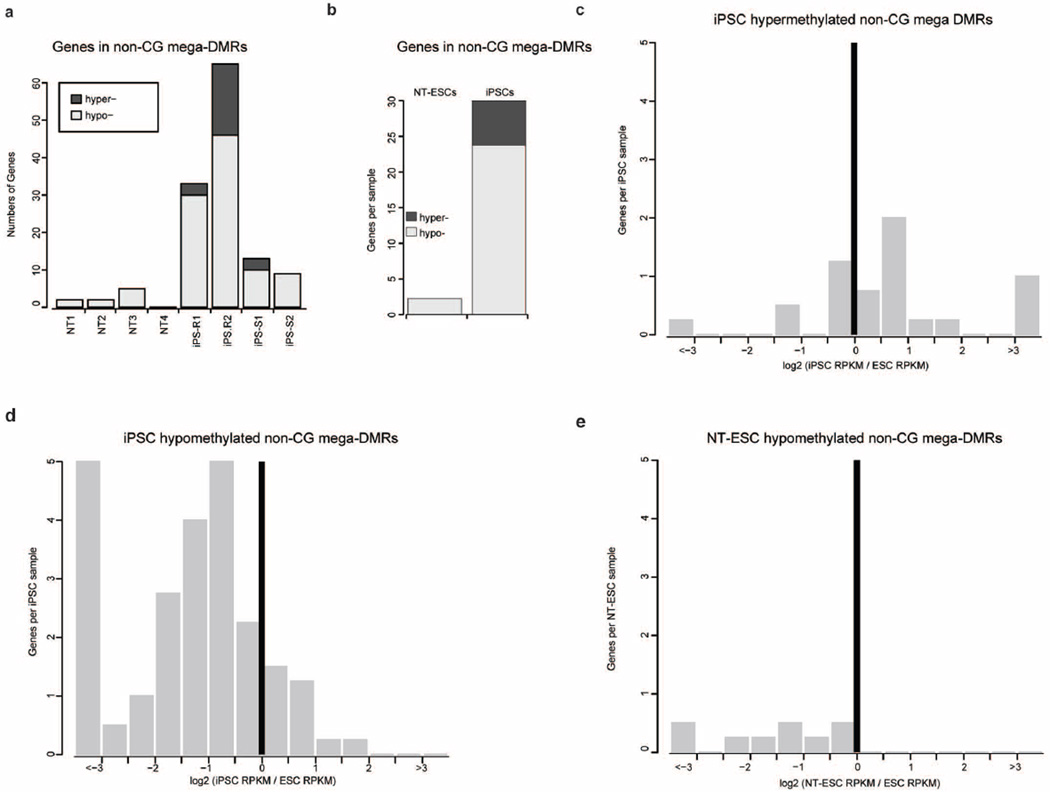
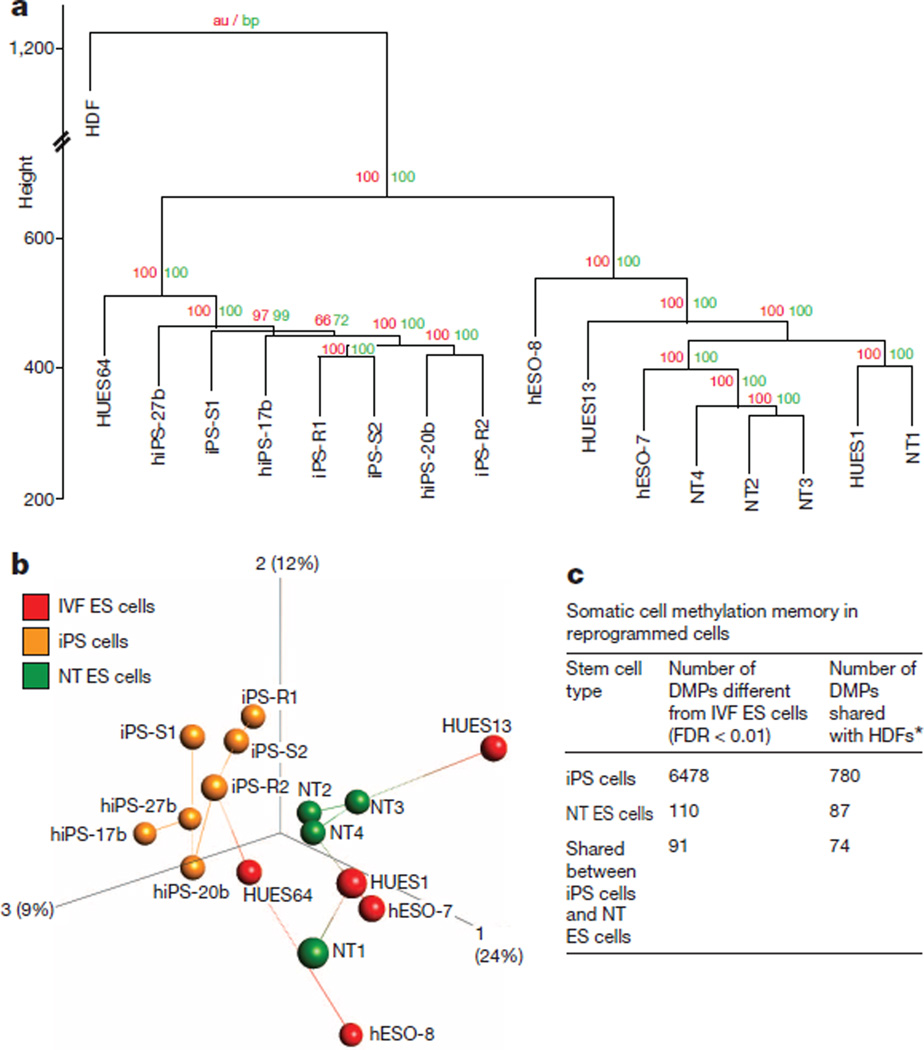
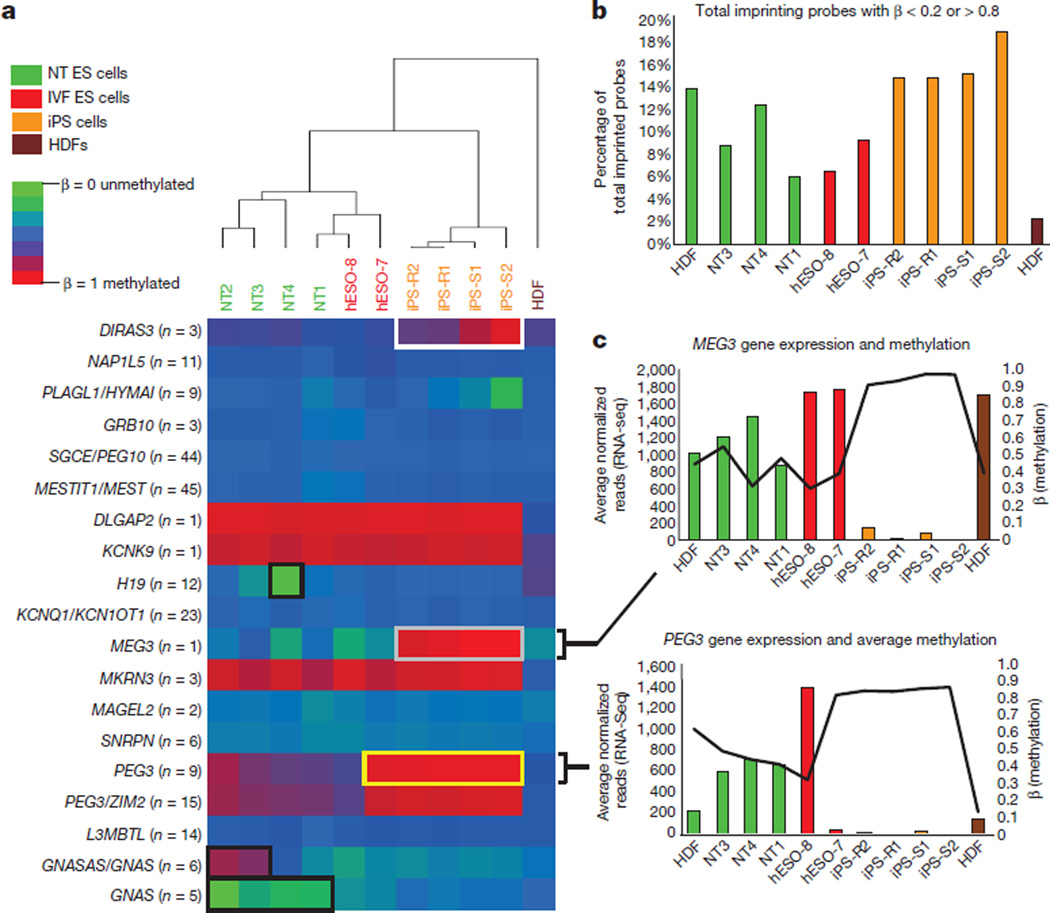
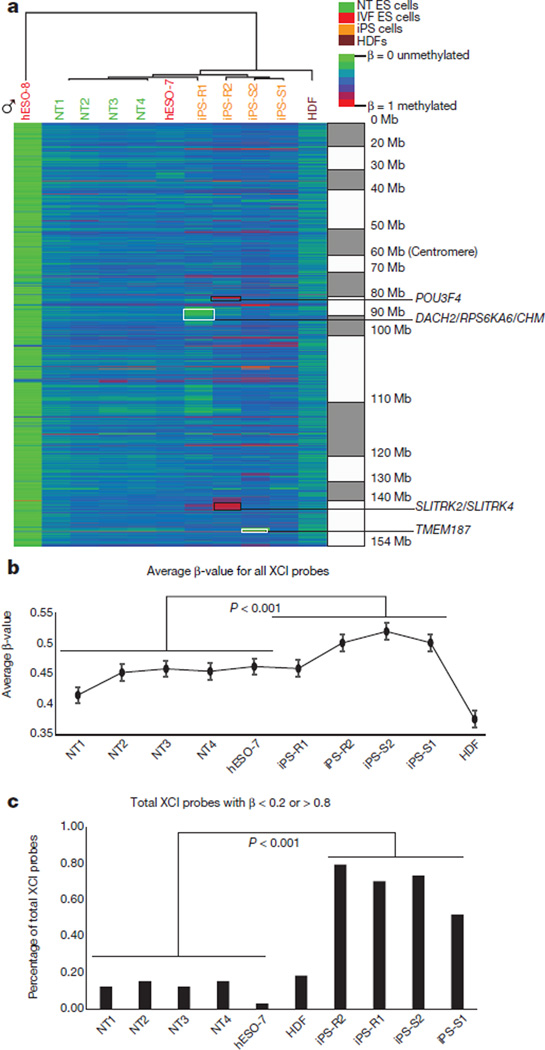
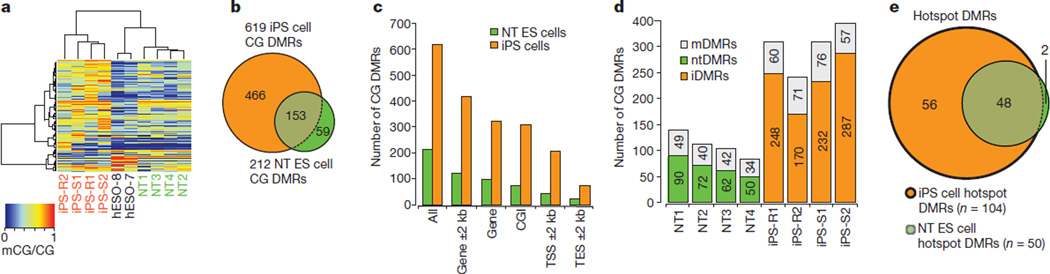
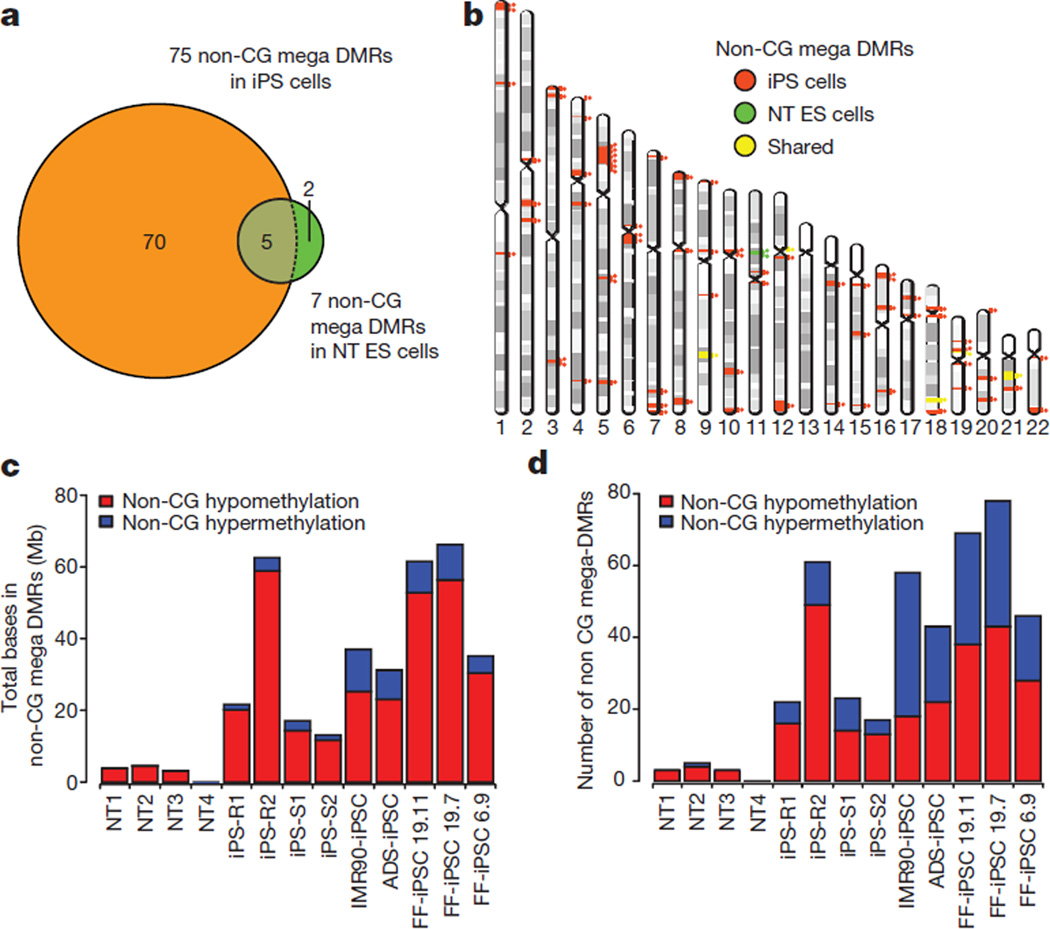
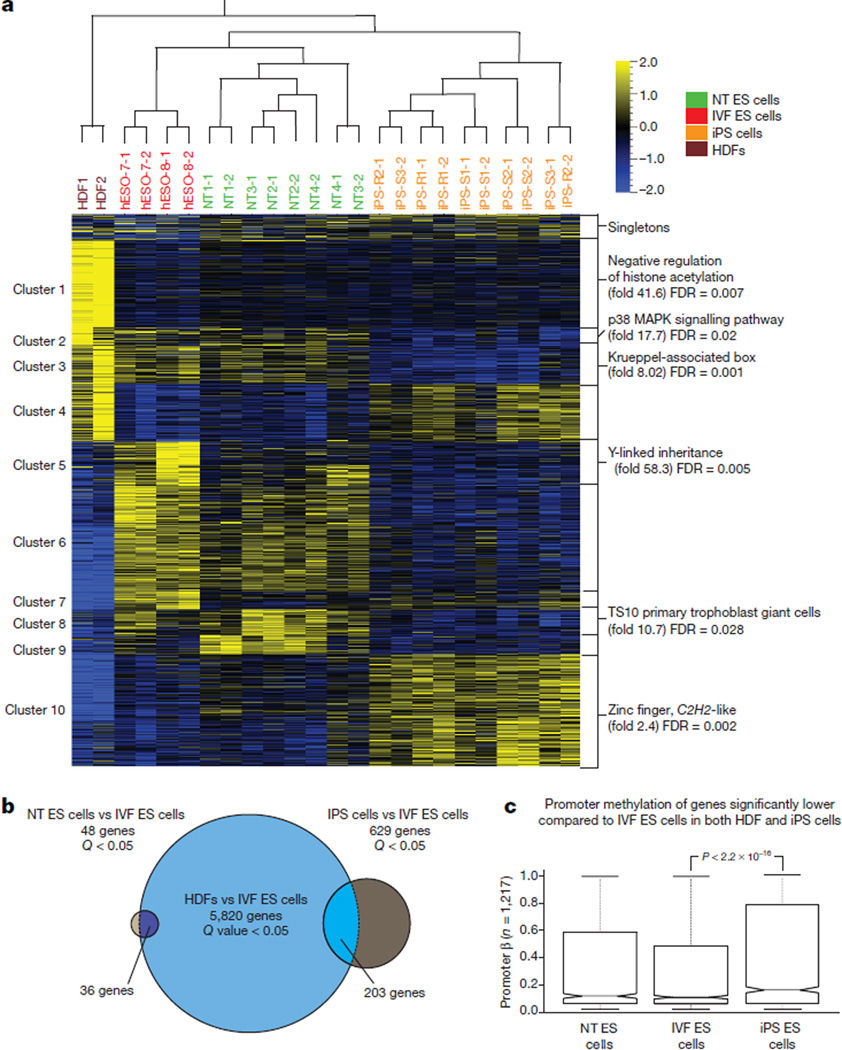
Human pluripotent stem cells hold potential for regenerative medicine, but available cell types have significant limitations. Although embryonic stem cells (ES cells) from in vitro fertilized embryos (IVF ES cells) represent the 'gold standard', they are allogeneic to patients. Autologous induced pluripotent stem cells (iPS cells) are prone to epigenetic and transcriptional aberrations. To determine whether such abnormalities are intrinsic to somatic cell reprogramming or secondary to the reprogramming method, genetically matched sets of human IVF ES cells, iPS cells and nuclear transfer ES cells (NT ES cells) derived by somatic cell nuclear transfer (SCNT) were subjected to genome-wide analyses. Both NT ES cells and iPS cells derived from the same somatic cells contained comparable numbers of de novo copy number variations. In contrast, DNA methylation and transcriptome profiles of NT ES cells corresponded closely to those of IVF ES cells, whereas iPS cells differed and retained residual DNA methylation patterns typical of parental somatic cells. Thus, human somatic cells can be faithfully reprogrammed to pluripotency by SCNT and are therefore ideal for cell replacement therapies.


Figures

Extended Data Figure 1
Extended Data Figure 1. Mitochondrial DNA genotyping
a, Mitochondrial DNA (mtDNA) genotyping by RNA-seq and MethylC-seq. The NT4 line carried a C/T heteroplasmy at position 16092 (open oval) while the other NT ES cell and IVF ES cell lines contained a homoplasmic C allele at this position. b, Chromatographs of single nucleotide polymorphisms (SNPs, arrows) within the human mitochondrial genome indicate that all four NT ES cell lines share a mtDNA sequence with IVF ES cells. Notably, the NT4 line carried a C/T heteroplasmy at position 16092 (double peaks with blue representing C and red representing T in the chromatograph) while other NT ES cell lines and both hESO-7 and hESO-8 contained a homoplasmic C allele. The mtDNA sequence of all iPS cell lines was identical to the parental HDFs. c, mtDNA genotyping by Sanger sequencing demonstrated that all Leigh-iPS cell lines contain a G mutation at mtDNA position 8993 and the Leigh-NT1 line contains oocyte mtDNA with a wild-type T at the same position.
Extended Data Figure 2
Extended Data Figure 2. Subchromosomal genomic aberrations in IVF ES cells, NT ES cells and iPS cells
a, The location and type of CNVs for all mapped samples. One-copy deletion regions are shown in red, two-copy deletions are in yellow, duplicated regions (three copies) are in dark blue, and runs of homozygosity (ROHs) are in green. b, The average number of CNVs per stem cell type for IVF ES cells, NT ES cells and iPS cells. Owing to the small sample sizes, no statistically significant differences were found between sample groups. c, Bar graphs displaying the number of InDels by sample. d, Bar graphs showing the average number of InDels found in the iPS cell lines and NT ES cell lines. No statistically significant differences were found between sample groups. Error bars, s.e.m.
Extended Data Figure 3
Extended Data Figure 3. XIST and XACT expression
a, Bar graph showing the reads per kb per million reads (RPKMs) of the XIST gene for pluripotent stem cell lines and HDFs. b, Bar graph showing the log transformed normalized read count of the XACT gene for the same samples. Error bars, s.e.m.
Extended Data Figure 4
Extended Data Figure 4. Genes with aberrant methylation and associated alterations in gene expression
a, Hypermethylation of iPS-R2 (black line in bar graphs representing the average β-values for methylation level, right side of y axis) and decreased gene expression of POU3F4, SLITRK2 and SLITRK4 (bar graphs representing normalized reads, averaged between replicates, left side of y axis). b, Hypomethylation (black line in bar graphs representing the average β-values for methylation level, right side of y axis) of iPS-R1 (top two graphs and bottom left corner) and iPS-S2 (bottom right corner) correlated with decreased gene expression of DACH2, CHM, RPS6KA6 and TMEM187 (bar graph representing normalized reads, averaged between replicates, left side of y axis).
Extended Data Figure 5
Extended Data Figure 5. Differential methylation at autosomal non-imprinted loci
Heat map displaying 1,621 autosomal, non-imprinted CpGs that were differentially methylated among NT ES cells, iPS cells and IVF ES cells (n = 10) (Kruskal–Wallis P-value < 0.01, Δβ > 0.5). CpG probes were clustered into six groups using an unsupervised self-organizing map algorithm. The line graphs on the right represent an average β-value for each cluster.
Extended Data Figure 6
Extended Data Figure 6. Methylation of CpG probes
Box plots representing the β-values for all autosomal non-imprinted probes on the methylation array located within specified genomic regions. The box plots show a general trend of higher methylation levels in iPS cells compared to IVF ES cells. The number of CpGs interrogated in each genomic region is included on the y axis. The box represents the interquartile range (25th to 75th percentile), and the line within the box marking represents the median. The notch in the box represents the 95% confidence interval around the median. The whiskers above and below the box contain 99.3% of the data with outliers represented by circles above and below the whiskers. a, Probes within 2,000 base pairs of the transcription start site (TSS). b, Probes within CpG Islands (CGIs). c, Probes in the 5′ region (0–2 kb upstream of CGI). d, Probes in the 3′ region (0–2 kb downstream of CGI). e, Probes in the 5′ region (2–4 kb upstream of CGI). f, Probes in the 3′ region (2–4 kb downstream of CGI). g, Functional annotation of the mammalian genome (FANTOM 4) promoters with high CpG content. h, FANTOM 4 promoters with low CpG content. i, Probes within enhancers. j, Probes within major histocompatibility complex (MHC) regions. k, Probes within cancer differential methylated regions (CDMRs). l, Probes within reprogramming differentially methylated regions (RDMRs). m, Probes within short interspersed nuclear element (SINE) regions. n, Probes within long interspersed nuclear element (LINE) regions. o, Probes within long terminal repeat (LTR) regions.
Extended Data Figure 7
Extended Data Figure 7. Non-CG mega DMRs
a, Heat map of normalized mCH/CH of all 150 non-CG mega DMRs identified by comparing four NT ES cell lines, nine iPS cell lies to five IVF ES cell lines from this study and the previous studies. b, An example of non-CG mega DMRs (black bar) ranged from 1,995,000 bp to 4,850,000 bp on chromosome 8. The y axis is normalized mCH/CH, which is defined as the weighted non-CG methylation level minus bisulphite non-conversion and dividing median mCH/CH of 5 kb bin. Scope was extended 200 kb on both sides to show non-CG methylation profile of regions surrounding non-CG mega DMRs. c, A representative non-CG mega DMR (black bar) hypomethylated in both iPS cells and NT ES cells on chromosome 21. d, A representative non-CG mega DMR hypermethylated only in iPS cells on chromosome 10.
Extended Data Figure 8
Extended Data Figure 8. Expression patterns of genes in non-CG mega DMRs
a, Number of genes in non-CG mega DMRs identified in each sample. b, Average number of genes falling in non-CG mega DMRs in NT ES cells and iPS cells. c, Histogram of gene expression in iPS cells for the genes located in hypermethylated. d, Hypomethylated non-CG mega DMRs identified in iPS cells. The x axis is the log2 fold change of iPS cell RPKM compared to IVF ES cell RPKM. e, Histogram of gene expression in NT ES cells for the genes located in hypomethylated non-CG mega DMRs. The x axis is the log2 fold change of NT ES cell RPKM compared to IVF ES cell RPKM. NT ES cell (or iPS cell) RPKM was the average of two replicates, while ES cell RPKM was the average of all replicates of hESO-7 and hESO-8.
Figure 1
Figure 1. Global methylation status
a, Unsupervised hierarchical clustering of all filtered and normalized methylation probes in five IVF ES cell lines, seven iPS cell lines, and four NT ES cell lines, and in parental HDFs. Red and green values above each edge represent AU (approximately unbiased) and BP (bootstrap probability) P values (%) calculated using bootstrap resampling. b, Principal component analysis of IVF ES cells (red balls), iPS cells (orange balls), and NT ES cells (green balls) with nearest-neighbour analysis. The percentages in parentheses represent the variance explained by the respective axes. c, Total number of differentially methylated probes (DMPs) observed between matched iPS cells, NT ES cells and IVF ES cells (n = 11, Kruskal–Wallis test, FDR < 0.01). The number of DMPs shared with parental HDFs was used as a measure of the degree of somatic cell memory. *|Average β HDF – average β IVF-ES cells| > 0.3 and |average β iPS cells – average β IVF-ES cells| > 0.3.
Figure 2
Figure 2. Methylation at imprinted regions
a, Heat map of previously identified imprinted regions. For each gene, an average β-value (the ratio of intensities between methylated alleles and the sum of methylated and unmethylated alleles) for all DNA methylation probes assigned to a specific gene is shown and the number of included probes is indicated next to the gene. White box, hypermethylation at DIRAS3 locus, no change in gene expression; black boxes, DNA methylation changes at H19, GNASAS or GNAS, and GNAS loci (no change in gene expression); grey box, hypermethylation at the MEG3 locus (reduced gene expression); yellow box, hypermethylation at the PEG3 locus (reduced gene expression). b, Bar graph showing percentage of total imprinted probes that had a β < 0.2 or > 0.8. c, Bar and line graphs showing the normalized RNA-seq read count (bars, averaged between replicates) and the DNA methylation β-values (black line) for MEG3 and PEG3. Solidus symbols indicate genes with overlapping genomic regions.
Figure 3
Figure 3. Methylation at X-chromosome inactivation sites
a, Heat map displaying β-values of previously identified XCI probes on the DNA methylation array in NT ES cells, IVF ES cells, iPS cells and HDFs. The genes highlighted with black boxes showed both aberrant hypermethylation and corresponding changes in gene expression. The hypomethylated genes highlighted in white boxes were associated with corresponding changes in gene expression. b, Line graph showing an average β-value for all XCI probes for each cell line (two-sided t-test, P < 0.001, error bars s.e.m.). c, The percentage of total XCI probes with β < 0.2 or > 0.8 (two-sided t-test, P < 0.001).
Figure 4
Figure 4. CG DMRs across NT ES cells and iPS cells
a, Complete hierarchical clustering of CG methylation for a total 678 CG DMRs identified by comparing methylomes of NT ES cells and iPS cells to IVF ES cells. b, Venn diagram showing the overlap of CG DMRs across iPS cells and NT ES cells in cases in which the DMR is found in at least one of the lines in the same group. c, The number of 678 CG DMRs that overlapped (at least 1 bp) with indicated genomic features. CGI, CG islands; TES, transcription end sites; TSS, transcription start sites. d, Distribution of CG DMRs among each NT ES cell and iPS cell line. DMRs that were also shared with parental somatic cells were identified as memory or mDMRs. Other DMRs were then assigned into NT-specific DMRs (ntDMRs) and iPS-cell-specific DMRs (iDMRs) if the DMRs were present in NT ES cell lines and iPS cell lines, respectively. e, The Venn diagram shows the hotspot CG DMRs that were identified in every iPS cell or NT ES cell line in the same group. Hotspot CG DMRs (48) were shared among all iPS cell and NT ES cell lines.
Figure 5
Figure 5. Non-CG mega DMRs in NT ES cells and iPS cells
a, Venn diagram showing the overlap of the 77 non-CG mega DMRs identified in the iPS cell and the NT ES cell lines from this study. Numbers within circles denote DMRs identified exclusively within each group. Five DMRs were shared among all cell lines in both groups. b, Chromosome ideogram showing the location of the 77 non-CG mega DMRs found in both NT ES cell and iPS cell lines from this study. Orange circles and lines indicate the location of the individual DMRs specific for iPS cells; green circles and lines denote those specific for NT ES cells and yellow circles and lines are DMRs shared by both cell types. c, Total length of the non-CG mega DMRs identified in 4 NT ES cell and 9 iPS cell lines. The NT ES cells had a significantly lower size of DMRs (Mann–Whitney test, P < 0.005) compared to the iPS cells. FF, foreskin fibroblasts. d, Total number of the non-CG mega DMRs identified in the cell lines. The NT ES cells had a significantly lower number of DMRs (Mann–Whitney test, P < 0.005) compared to the iPS cells.
Figure 6
Figure 6. Gene expression analysis by RNA-seq
a, Heat map displaying 1,220 differentially expressed genes between NT ES cells, iPS cells and IVF ES cells (n = 22) (ANOVA adjusted p-value <0.05). Genes were clustered into ten-groups for functional analysis and presented as a heat map. Cluster 4, 6, 7, and 9 showed no significant functional enrichments. b, Venn diagram showing the number of genes differentially expressed between the HDFs and the IVF ES cells (large circle), the iPS cells and the IVF ES cells (medium circle) and the NT ES cells and IVF ES cells (small circle; t-test FDR <0.05). Overlapping regions represent the number of genes differentially expressed in both the HDFs and either the NT ES cells or iPS cells. c, Notched box plots represent the β-value of all probes in the promoter regions (−2,000 bp to 500 bp) of the genes that were expressed at significantly lower levels (t-test FDR < 0.05) in both the HDFs and the iPS cells (exhibiting transcriptional memory) when compared to the IVF ES cells. The box represents the interquartile range (25th to 75th percentile), and the line within the box marks, the median. The notch in the box represents the 95% confidence interval around the median. The whiskers above and below the box contain 99.3% of the data and the number of CpGs interrogated is shown on the y axis.

Comment in

References

    1. Thomson JA, et al. Embryonic stem cell lines derived from human blastocysts. Science. 1998;282:1145–1147. - PubMed
    1. Takahashi K, et al. Induction of pluripotent stem cells from adult human fibroblasts by defined factors. Cell. 2007;131:861–872. - PubMed
    1. Rais Y, et al. Deterministic direct reprogramming of somatic cells to pluripotency. Nature. 2013;502:65–70. - PubMed
    1. Hussein SM, et al. Copy number variation and selection during reprogramming to pluripotency. Nature. 2011;471:58–62. - PubMed
    1. Laurent LC, et al. Dynamic changes in the copy number of pluripotency and cell proliferation genes in human ESCs and iPSCs during reprogramming and time in culture. Cell Stem Cell. 2011;8:106–118. - PMC - PubMed

Publication types

Associated data