. 2014 Oct;88(19):11045-55.
doi: 10.1128/JVI.00307-14. Epub 2014 Jul 9.

HIV-1 gp120 activates the STAT3/interleukin-6 axis in primary human monocyte-derived dendritic cells

Affiliations

HIV-1 gp120 activates the STAT3/interleukin-6 axis in primary human monocyte-derived dendritic cells

Manuela Del Cornò et al. J Virol. 2014 Oct.

Abstract

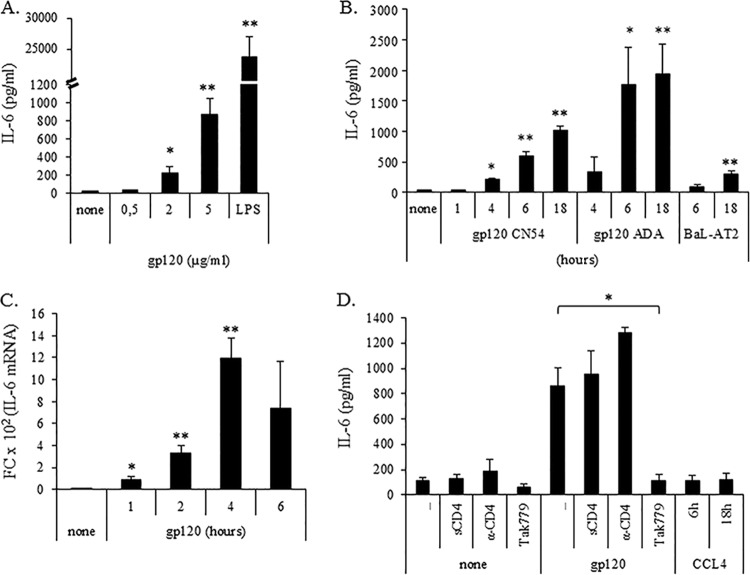
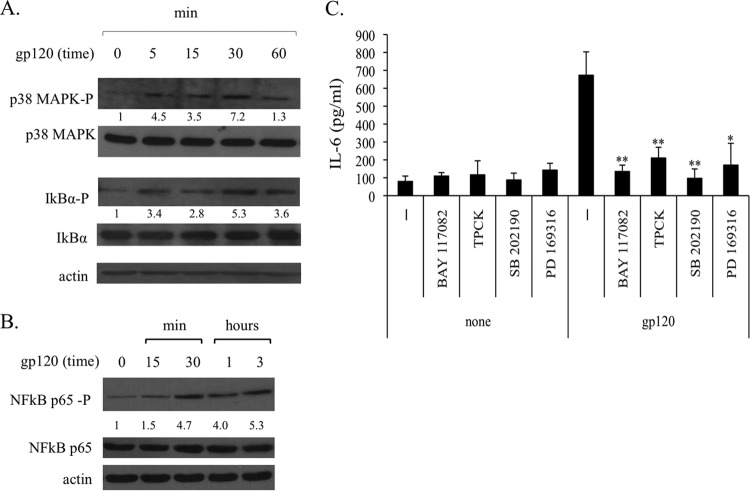
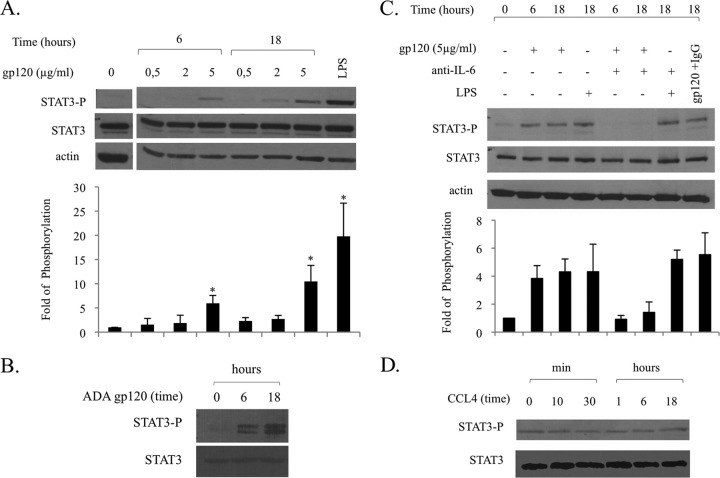
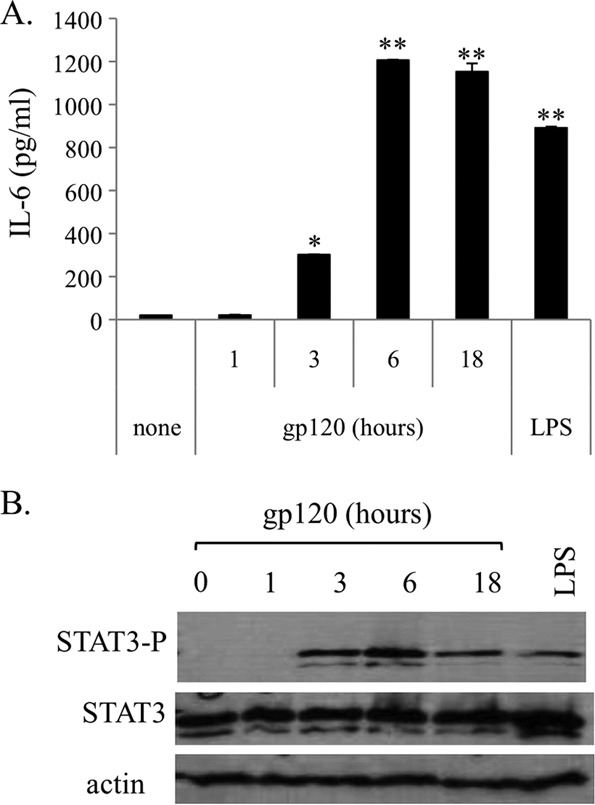
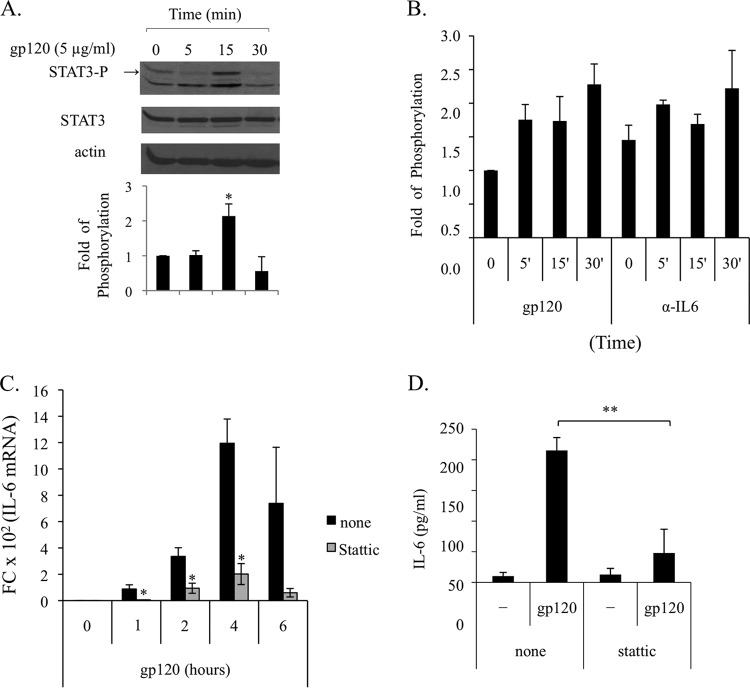
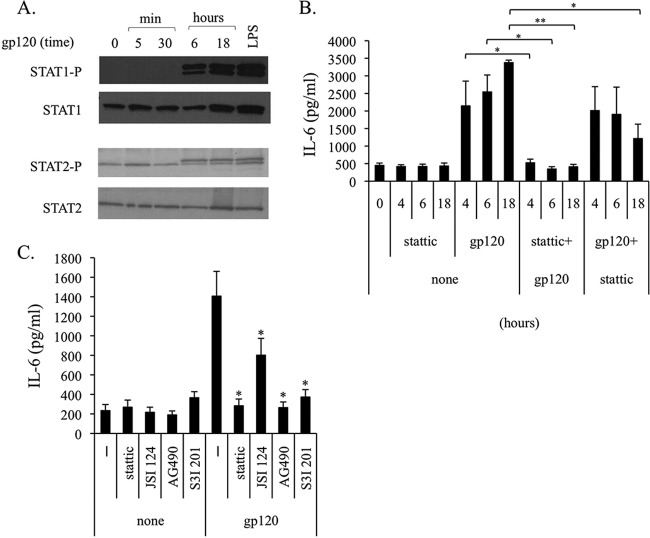
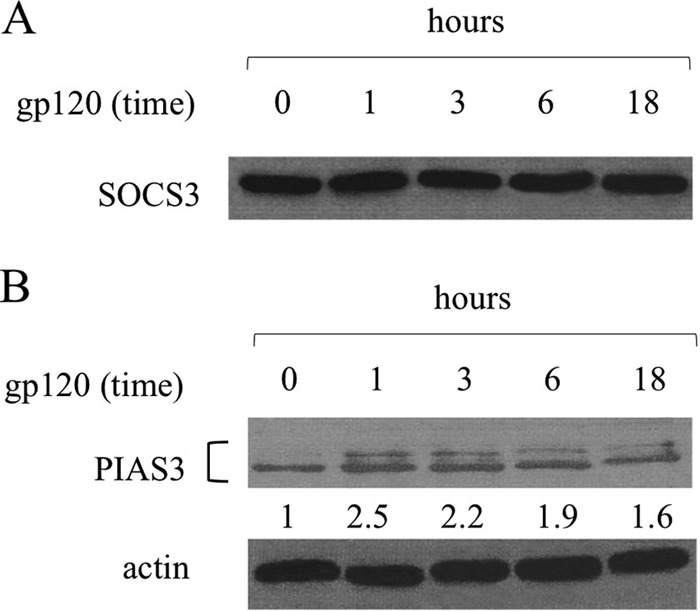
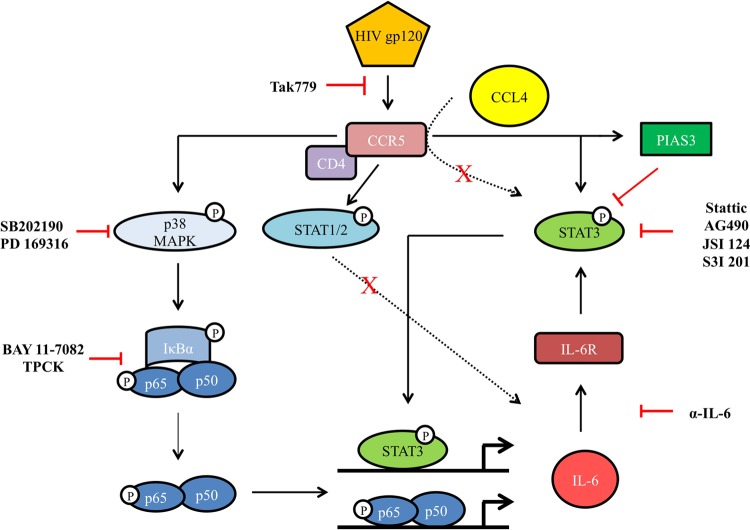
Dendritic cells (DCs) are fundamental for the initiation of immune responses and are important players in AIDS immunopathogenesis. The modulation of DC functional activities represents a strategic mechanism for HIV-1 to evade immune surveillance. Impairment of DC function may result from bystander effects of HIV-1 envelope proteins independently of direct HIV-1 infection. In this study, we report that exposure of immature monocyte-derived DCs (MDDCs) to HIV-1 R5 gp120 resulted in the CCR5-dependent production of interleukin-6 (IL-6) via mitogen-activated protein kinase (MAPK)/NF-κB pathways. IL-6 in turn activated STAT3 by an autocrine loop. Concomitantly, gp120 promoted an early activation of STAT3 that further contributed to IL-6 induction. This activation paralleled a concomitant upregulation of the STAT3 inhibitor PIAS3. Notably, STAT3/IL-6 pathway activation was not affected by the CCR5-specific ligand CCL4. These results identify STAT3 as a key signaling intermediate activated by gp120 in MDDCs and highlight the existence of a virus-induced dysregulation of the IL-6/STAT3 axis. HIV-1 gp120 signaling through STAT3 may provide an explanation for the impairment of DC function observed upon HIV exposure.

Importance: This study provides new evidence for the molecular mechanisms and signaling pathways triggered by HIV-1 gp120 in human DCs in the absence of productive infection, emphasizing a role of aberrant signaling in early virus-host interaction, contributing to viral pathogenesis. We identified STAT3 as a key component in the gp120-mediated signaling cascade involving MAPK and NF-κB components and ultimately leading to IL-6 secretion. STAT3 now is recognized as a key regulator of DC functions. Thus, the identification of this transcription factor as a signaling molecule mediating some of gp120's biological effects unveils a new mechanism by which HIV-1 may deregulate DC functions and contribute to AIDS pathogenesis.


Figures

FIG 1
FIG 1
HIV gp120, but not CCL4, upmodulates IL-6 expression via CCR5. MDDCs at day 6 of culture were treated with different concentrations of gp120 and LPS (10 ng/ml) (A) or for different time periods with 5 μg/ml gp120 (CN54 and ADA strain) and BaL-AT2 (46.783 ng/ml p24) (B and C). To test the specificity of gp120-induced effects, MDDCs were preincubated for 1 h with or without sCD4 (2 μg/ml), anti-CD4 (2 μg/ml), or Tak779 (5 μM) and then exposed to gp120 (5 μg/ml) for 18 h or treated with CCL4 (100 nM) for the indicated times (D). For panels A, B, and D, supernatants were collected and IL-6 content was measured by ELISA. Data are expressed as means ± standard errors (SE) from six (A) or four (B and D) independent experiments. P values were calculated by Student's t test, and statistical significance is indicated. *, P < 0.05; **, P < 0.005 (gp120 versus the untreated control and Tak779 plus gp120 versus gp120 alone). (C) Total RNA was extracted and reverse transcribed, and real-time PCR was performed using primers specific for the human IL-6 gene and normalized with β actin. Data are expressed as means ± SE from five independent experiments performed. Results, analyzed by the relative quantification method (2−ΔΔCT method), are shown as fold increase (FC) of IL-6 gene expression versus that of the untreated control. P values were calculated by Student's t test, and statistical significance is indicated (P < 0.05 [*] and P < 0.005 [**] for gp120 versus the untreated control).
FIG 2
FIG 2
p38 MAPK, IkBα, and p65 NF-κB are involved in HIV gp120-induced secretion of IL-6. MDDCs were stimulated with gp120 (5 μg/ml) for the indicated time periods. Cell lysates were resolved by 10% to 12% SDS-PAGE, transferred to a nitrocellulose membrane, and subjected to immunoblot analysis with antibodies specific for the total or phosphorylated (P) forms of p38 MAPK (phospho-p38 MAPK [T183/Y185]) and IkBα (phospho-IkBα [Ser32]) (A) or p65 NF-κB (phospho-p65 NF-κB [Ser536]) (B) antibody. Blots shown are from one donor and are representative of three to five experiments carried out with different donors that yielded similar results. Values below the lanes show the intensities of the respective bands. The increase in phosphorylation was estimated by calculating the ratios of the phosphorylated form to total form of proteins. Actin expression is shown as a gel loading control. (C) MDDCs were preincubated for 1 h with or without the specific p38 MAPK inhibitors SB 202190 (1 μg/ml) and PD 169316 (10 μM), or NF-κB inhibitors BAY 117082 (10 μM) and TPCK (2 μM), before gp120 exposure or were left untreated. After 18 h of culture, supernatants were harvested and frozen for IL-6 determination. Data are expressed as means ± SE from four independent experiments performed. P values were calculated by Student's t test and statistical significance is indicated. *, P < 0.05 (gp120 plus inhibitor versus gp120 alone).
FIG 3
FIG 3
HIV gp120, but not CCL4, induces STAT3 activation via IL-6 production. MDDCs were stimulated with gp120 (concentration ranging from 0.5 to 5 μg/ml) or CCL4 (100 nM) for the indicated time periods, or with LPS (10 ng/ml), for 18 h in the presence or absence of anti-IL-6 antibody (5 μg/ml, 1 h of pretreatment). Cell lysates were resolved by 8% SDS-PAGE, transferred to a nitrocellulose membrane, and subjected to immunoblot analysis with antibodies specific for the total or phosphorylated forms of STAT3. Actin expression is shown as a gel loading control. Data from one representative experiment out of four (A and B) or two (C and D) analyzed are shown. Graphs show the ratio of phosphorylated to nonphosphorylated protein as determined by densitometry, where each sample was normalized to total STAT3. Fold phosphorylation was calculated relative to that of the untreated control, and the average fold from four (A) and two (C) independent experiments was represented graphically, along with the standard deviations (SD). Statistical significance is indicated versus the untreated control.
FIG 4
FIG 4
HIV gp120 promotes IL-6 secretion and induces STAT3 phosphorylation in MDMs. MDMs at day 6 of culture were treated for different time periods with gp120 (2 μg/ml) or LPS (10 ng/ml) or were left untreated. (A) At the indicated time points, supernatants were collected and IL-6 contents measured by ELISA. Data are expressed as means ± SE from four independent experiments performed. P values were calculated by Student's t test, and statistical significance is indicated (P < 0.05 and P < 0.005 for gp120 versus the untreated control). (B) Cell lysates were resolved by 8% SDS-PAGE, transferred to a nitrocellulose membrane, and subjected to immunoblot analysis with antibodies specific for the total or phosphorylated forms of STAT3. Actin expression is shown as a gel loading control. Data from one representative experiment out of three performed are shown.
FIG 5
FIG 5
HIV gp120-induced early activation of STAT3 is responsible for IL-6 production. (A and B) MDDCs were stimulated with gp120 (5 μg/ml) for the indicated time periods in the presence or absence of anti-IL-6 antibody (5 μg/ml, 1 h of pretreatment). Cell lysates were resolved by 8% SDS-PAGE, transferred to a nitrocellulose membrane, and subjected to immunoblot analysis with antibodies specific for the total or phosphorylated forms of STAT3. Actin expression is shown as a gel loading control. Graphs in panels A and B show the ratio of phosphorylated to nonphosphorylated protein as determined by densitometry, where each sample was normalized to total STAT3. Fold phosphorylation was calculated relative to that of the untreated control, and the average fold change from four (A) and two (B) independent experiments was represented graphically, along with the SD. Statistical significance is indicated versus the untreated control. (C) MDDCs were pretreated for 1 h with the STAT3 inhibitor Stattic (10 μM) and stimulated with gp120 (5 μg/ml) for the indicated times. Total RNA was extracted and reverse transcribed, and real-time PCR was performed using primers specific for the human IL-6 gene and normalized with β actin. Data are expressed as means ± SE from three independent experiments performed. Results, analyzed by the relative quantification method (2−ΔΔCT method), are shown as fold increase of IL-6 gene expression versus the untreated control. P values were calculated by Student's t test, and statistical significance is indicated (*, P < 0.05 for gp120 plus inhibitor versus gp120 alone). (D) MDDCs were pretreated for 1 h with the STAT3 inhibitor Stattic (10 μM) and stimulated with gp120 (5 μg/ml). After 18 h, supernatants were collected and IL-6 production was assessed by ELISA. Data are represented as means ± SE from five independent experiments. Statistical significance is indicated. **, P < 0.005 for gp120 plus inhibitor versus gp120 alone.
FIG 6
FIG 6
HIV gp120-induced late STAT1 and STAT2 activation is not responsible for IL-6 production. (A) MDDCs were stimulated with gp120 (5 μg/ml) or LPS (10 ng/ml) for the indicated time periods. Cell lysates were resolved by 8% SDS-PAGE, transferred to a nitrocellulose membrane, and subjected to immunoblot analysis with antibodies specific for the total or phosphorylated forms of STAT1 and STAT2. Data from one representative experiment out of three analyzed are shown. (B) MDDCs were treated with the STAT3 inhibitor Stattic (10 μM) before (1 h) or after (2 h) gp120 (5 μg/ml) exposure. At the indicated time points, supernatants were collected and IL-6 production was assessed by ELISA. Data are represented as means ± SE from four independent experiments. Statistical significance is indicated. P < 0.05 (*) and P < 0.005 (**) for gp120 plus inhibitor versus gp120 alone. (C) MDDCs were pretreated for 1 h with STAT3 inhibitors Stattic (10 μM), JSI 124 (0.5 μM), AG490 (100 μM), and S3I 201 (250 μM) and stimulated with gp120 (5 μg/ml). After 18 h, supernatants were collected and IL-6 production was assessed by ELISA. Data are represented as means ± SE from four independent experiments. Statistical significance is indicated. *, P < 0.05 for gp120 plus inhibitor versus gp120 alone.
FIG 7
FIG 7
HIV gp120 upregulates PIAS3, but not SOCS3, expression. MDDCs were stimulated with gp120 (5 μg/ml) for the indicated time periods. Cell lysates were resolved by 10% SDS-PAGE, transferred to a nitrocellulose membrane, and subjected to immunoblot analysis with antibodies specific for SOCS3 (A) and PIAS3 (B). Values below the lanes show band intensities of the respective bands normalized to actin expression. Data from one representative experiment out of three (A) or five (B) analyzed are shown.
FIG 8
FIG 8
Schematic model of gp120-induced signaling pathways in MDDCs. The cascade of signals triggered upon CCR5 engagement by R5 HIV-1 gp120 in MDDCs is schematically shown.

Similar articles

Cited by

References

    1. Pulendran B, Palucka K, Banchereau J. 2001. Sensing pathogens and tuning immune responses. Science 293:253–256. 10.1126/science.1062060 - DOI - PubMed
    1. Rinaldo CR, Jr, Piazza P. 2004. Virus infection of dendritic cells: portal for host invasion and host defense. Trends Microbiol. 12:337–345. 10.1016/j.tim.2004.05.003 - DOI - PubMed
    1. Spira AI, Marx PA, Patterson BK, Mahoney J, Koup RA, Wolinsky SM, Ho DD. 1996. Cellular targets of infection and route of viral dissemination after an intravaginal inoculation of simian immunodeficiency virus into rhesus macaques. J. Exp. Med. 183:215–225 - PMC - PubMed
    1. Miller CJ, Hu J. 1999. T cell-tropic simian immunodeficiency virus (SIV) and simian-human immunodeficiency viruses are readily transmitted by vaginal inoculation of rhesus macaques, and Langerhans' cells of the female genital tract are infected with SIV. J. Infect. Dis. 179(Suppl 3):S413–S417. 10.1086/314795 - DOI - PMC - PubMed
    1. Stahl-Hennig C, Steinman RM, Tenner-Racz K, Pope M, Stolte N, Matz-Rensing K, Grobschupff G, Raschdorff B, Hunsmann G, Racz P. 1999. Rapid infection of oral mucosal-associated lymphoid tissue with simian immunodeficiency virus. Science 285:1261–1265. 10.1126/science.285.5431.1261 - DOI - PubMed

Publication types

MeSH terms

LinkOut - more resources