. 2014 Sep;88(18):10851-63.
doi: 10.1128/JVI.00664-14. Epub 2014 Jul 9.

Sequence of events in measles virus replication: role of phosphoprotein-nucleocapsid interactions

Affiliations

Sequence of events in measles virus replication: role of phosphoprotein-nucleocapsid interactions

Joanna Brunel et al. J Virol. 2014 Sep.

Abstract

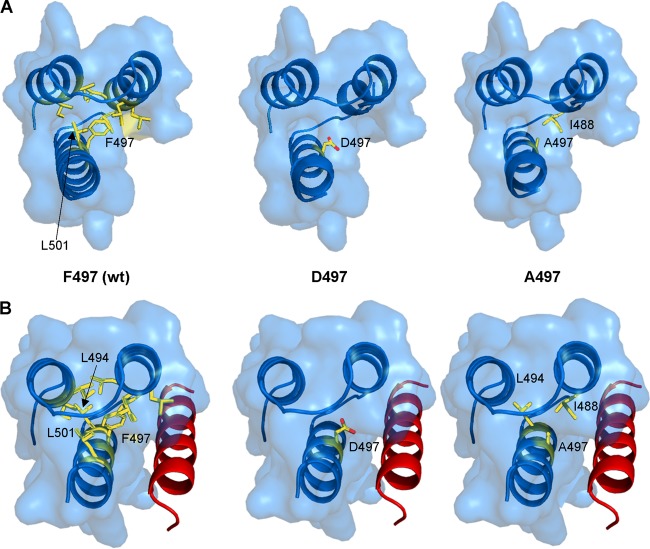
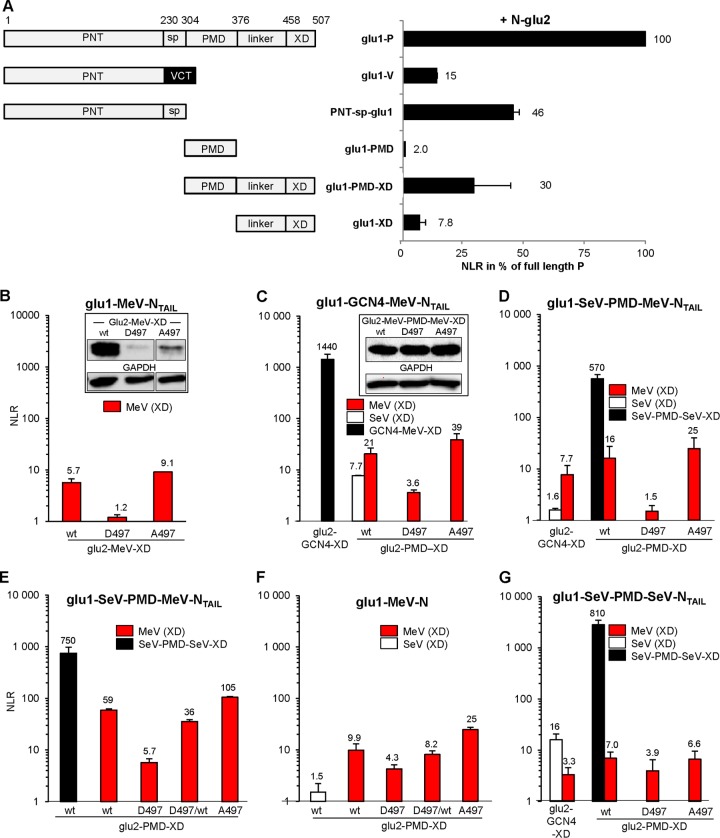
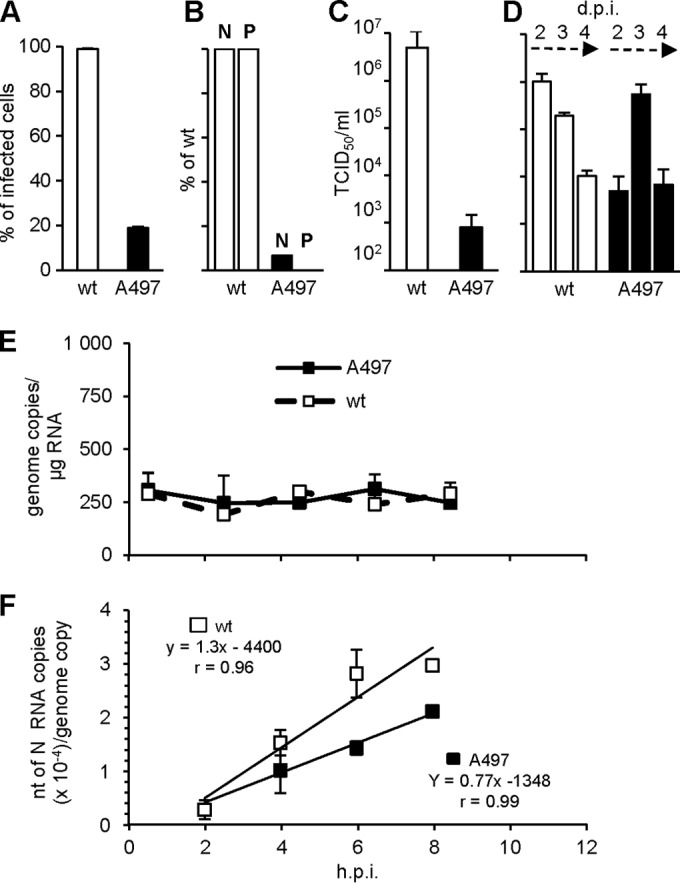
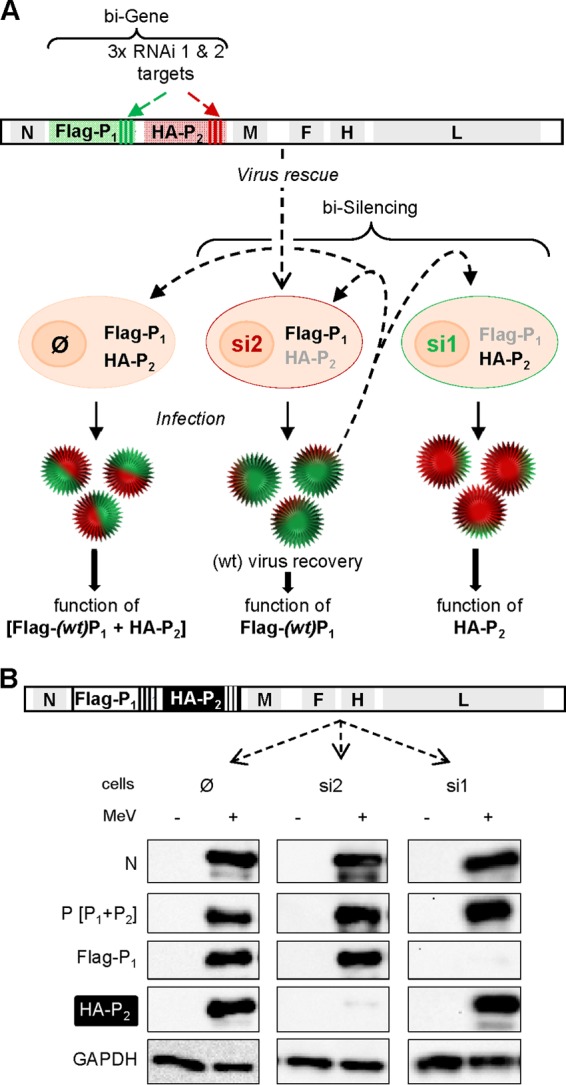
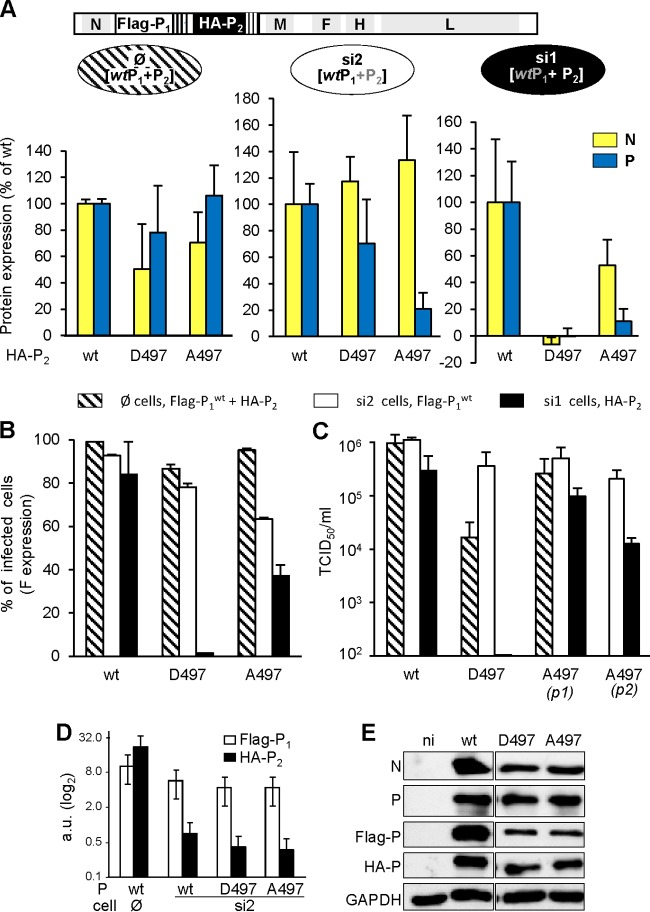
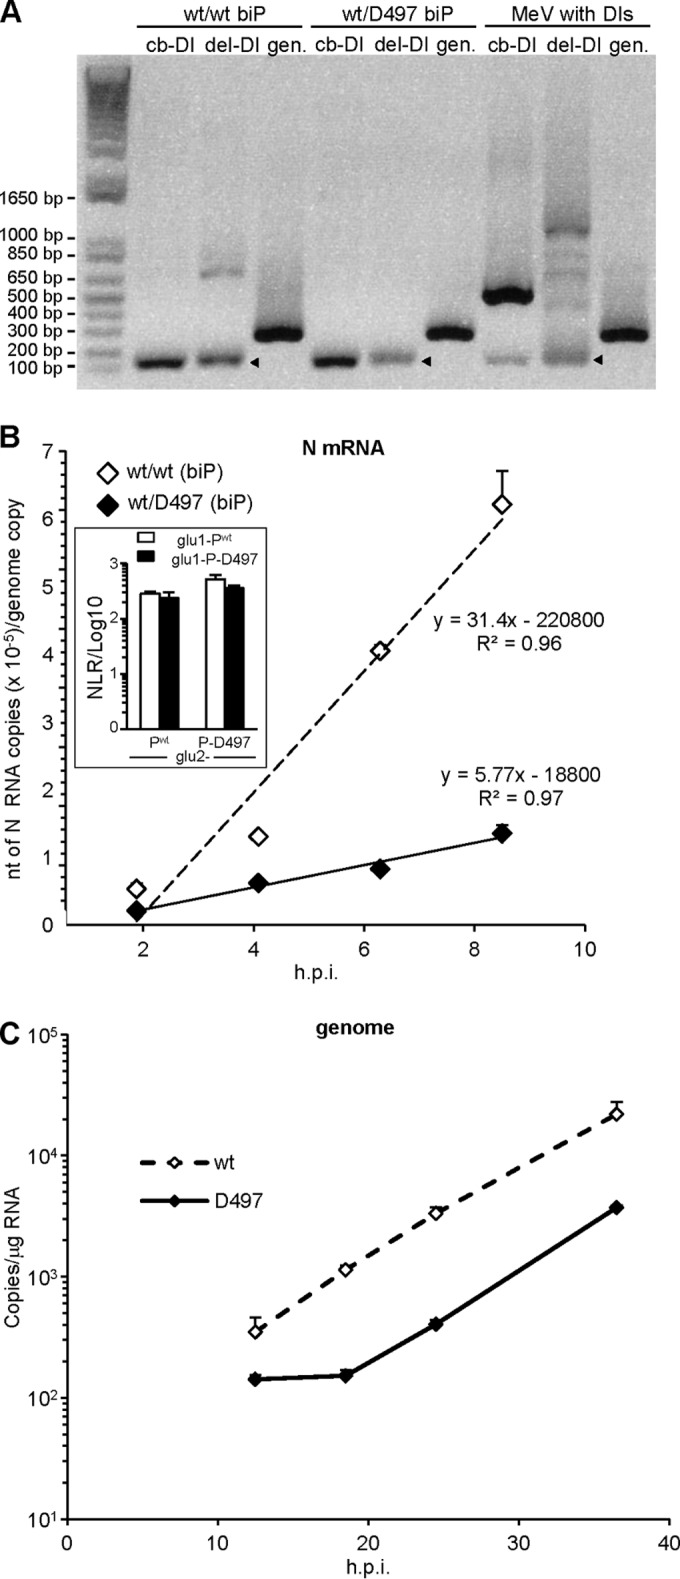
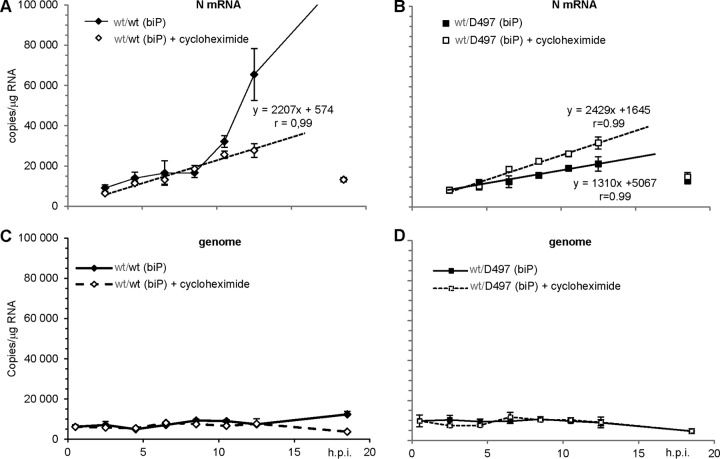
The genome of nonsegmented negative-strand RNA viruses is tightly embedded within a nucleocapsid made of a nucleoprotein (N) homopolymer. To ensure processive RNA synthesis, the viral polymerase L in complex with its cofactor phosphoprotein (P) binds the nucleocapsid that constitutes the functional template. Measles virus P and N interact through two binding sites. While binding of the P amino terminus with the core of N (NCORE) prevents illegitimate encapsidation of cellular RNA, the interaction between their C-terminal domains, P(XD) and N(TAIL) is required for viral RNA synthesis. To investigate the binding dynamics between the two latter domains, the P(XD) F497 residue that makes multiple hydrophobic intramolecular interactions was mutated. Using a quantitative mammalian protein complementation assay and recombinant viruses, we found that an increase in P(XD)-to-N(TAIL) binding strength is associated with a slower transcript accumulation rate and that abolishing the interaction renders the polymerase nonfunctional. The use of a newly developed system allowing conditional expression of wild-type or mutated P genes, revealed that the loss of the P(XD)-N(TAIL) interaction results in reduced transcription by preformed transcriptases, suggesting reduced engagement on the genomic template. These intracellular data indicate that the viral polymerase entry into and progression along its genomic template relies on a protein-protein interaction that serves as a tightly controlled dynamic anchor.

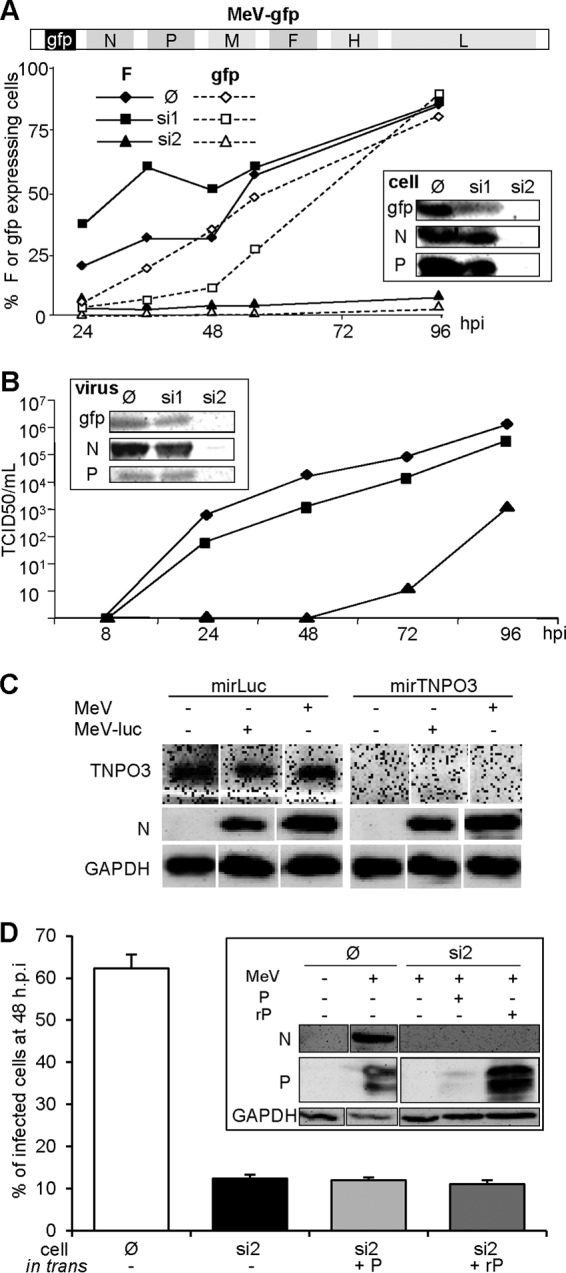
Importance: Mononegavirales have a unique machinery to replicate RNA. Processivity of their polymerase is only achieved when the genome template is entirely embedded into a helical homopolymer of nucleoproteins that constitutes the nucleocapsid. The polymerase binds to the nucleocapsid template through the phosphoprotein. How the polymerase complex enters and travels along the nucleocapsid template to ensure uninterrupted synthesis of up to ∼ 6,700-nucleotide messenger RNAs from six to ten consecutive genes is unknown. Using a quantitative protein complementation assay and a biGene-biSilencing system allowing conditional expression of two P genes copies, the role of the P-to-N interaction in polymerase function was further characterized. We report here a dynamic protein anchoring mechanism that differs from all other known polymerases that rely only onto a sustained and direct binding to their nucleic acid template.


Figures

FIG 1
FIG 1
(A) PXD residues in contact with residue 497 within the PXD structure (PDB 1OKS). In the left panel, F497 makes hydrophobic contacts with PXD residues I464, I468, L481, L484, L485, I488, and L501. The middle and right panels display structural models of the D497 (middle) and A497 (right) PXD variants showing that while residue D497 does not establish any contacts, residue A497 makes a hydrophobic contact with PXD residue I488. (B) Residues contacting PXD residue 497 within the chimeric PXD/NTAIL α-MoRE structure (PDB 1T60, PXD in blue and NTAIL in red). In the left panel, F497 makes an additional hydrophobic contact with PXD residue L494 in addition to those found in the unbound PXD structure (PDB 1OKS). The middle and right panels display structural models of the D497 (middle) and A497 (right) PXD variants in complex with the α-MoRE showing that while PXD residue D497 is not involved in any interaction (middle), residue A497 makes an additional hydrophobic contact with PXD L494 residue in addition to that involving PXD residue I488 occurring in the unbound form. The structural models were obtained by replacing the side chain of the native F497 residue either in the structure of PXD (PDB 1OKS) or in that of the PXD/α-MoRE complex (PDB 1T60) by the side chain (most frequent conformer) of either Asp or Ala. The models were then energy minimized so as to avoid steric clashes by using the GROMOS96 implementation of the Swiss-PDB Viewer with default parameters.
FIG 2
FIG 2
Similar expression levels of P-D497 and P-A497 alone (lane ∅) or together with N protein 1 day after transfection of 293T cells. A Western blot revealed by anti-P and anti-N monoclonal antibodies is shown. GAPDH (glyceraldehyde-3-phosphate dehydrogenase) served as a loading control.
FIG 3
FIG 3
Assessment of protein-protein interaction strength using the Gaussia luciferase-based protein complementation assay (PCA) in human 293T cells. (A) Interaction strength of full-length and truncated MeV P and V proteins (schemed on left) with the MeV N protein. PNT, P N terminus; sp., spacer; PMD, P multimerization domain; XD, X domain; linker, linker region between PMD and XD; VCT, V C terminus. The V protein is made by RNA editing at aa 231; hence, it has a different C-terminal domain (VCT). Shown are the means of two independent experiments performed in triplicates. Similar rankings were obtained in a third experiment. (B to G) Binding properties of PXDwt, PXD-D497, and PXD-A497 to NTAIL. (B) Interaction between monomeric glu1-MeV-NTAIL (aa 401 to 525) with monomeric glu2-MeV-PXD (aa 376 to 507) hybrid proteins with the expression levels of glu2-MeV-XD determined by Western blotting (B, inset). (C) Interaction of glu1-GCN4-MeV-NTAIL with glu2-GCN4-MeV-XD (black bar) or with glu2-PMD-XD from MeV (MeV-P[aa301-507], red bars) or SeV (P[aa316-568], white bar) hybrid proteins with the expression levels of glu2-MeV-PMD-MeV-XD determined by Western blotting (C, inset). (D and E) Interaction of glu1-SeV-PMD-MeV-NTAIL with glu2-GCN4-XD from MeV (P[aa376-507], red bar) or SeV-P (P[aa445-568], white bar) and tetrameric glu2-PMD-XD hybrid proteins from MeV (P[aa301-507], red bars), SeV (P[aa316-568], black bars), or a 1:1 mixture of glu2-MeV-PMD-MeV-XDwt and glu2-MeV-PMD-MeV-XD-D497 (red bar “D497/wt”). (E) Repeat of D with additional testing of the 1:1 mixture of glu2-MeV-PMD-MeV-XDwt (red bar “D497/wt”). (F) Same as E but using glu1-MeV-N as a sparring partner instead of glu1-SeV-PMD-MeV-NTAIL. (G) Interaction of glu1-SeV-PMD-SeV-NTAIL with glu2-GCN4-XD from MeV (P[aa376-507], red bar) or SeV-P (P[aa445-568], white bar) or glu2-PMD-XD hybrid proteins from MeV (P[aa301-507], red bars) or SeV (P[aa316-568], black bar). The NLR values in panels B to G are means of three independent experimental replicates.
FIG 4
FIG 4
Growth characteristics of wt P and P-A497 virus. (A to D) Percentage of infected cells (A), expression of N and P (with expression of N and P expressed as the percentage of wt N and P as estimated by Western blotting with an anti-N or an anti-P monoclonal antibody, respectively) at 24 hpi with an MOI of 1 (B), and virus production at 2 dpi (C) or 2 to 4 dpi (D). For cytometry analysis of F expression, cell-cell fusion was prevented by adding fusion inhibitor peptide z-fFG after MeV infection. (E and F) Kinetics of RNA accumulation of viral genome (E) and of N mRNA (F) after infection with single P viruses. Error bars indicate the standard deviations based on three experimental replicates. Genomic RNAs in panel E correspond to the virus inputs that remain constant before the replication start (see reference for details). Slopes in panel F correspond to the transcript accumulation rate (according to Plumet et al. [7]). See Table 1 for the genomic inputs of both virus preparations and slope comparisons.
FIG 5
FIG 5
Inhibition of MeV infection by an shRNA targeting the P mRNA (si2) is not alleviated by the expression of an shRNA-resistant P protein in trans. (A) Schematic representation of the MeV genome expressing GFP upstream of the N gene (top scheme). Inhibition of the expression of F (filled symbols, continuous line), gfp (open symbols, dotted line) after infection (MOI = 1) of parental 293T (∅, diamonds), or 293T cells constitutively expressing a shRNA against P (si2, triangles) or GFP (si1, squares) mRNA was assessed. The inset shows the expression of N and P proteins. Protein expression was determined by flow cytometry (curves) and Western blot at 96 hpi (inset). For cytometry analysis of F expression, cell-cell fusion was prevented by adding fusion inhibitor peptide z-fFG after MeV infection. (B) Kinetics of virus production after infection (MOI = 1) of parental (diamonds), si1 (squares), and si2 (triangles) cells and protein contents of purified virions collected at 96 hpi as determined by Western blotting (inset). (C) Ongoing RNA silencing does not affect infection by MeV or MeV expressing luciferase as the reporter gene, nor does MeV infection inhibit an ongoing RNA silencing. Cells constitutively expressing a miRNA-based shRNA targeting the luciferase gene or endogenous TNPO3 gene were infected with MeV or MeV-luc virus (MOI = 1) for 1 day. TNOP3 and virus N protein expression were determined by Western blotting. (D) Inability of P protein transiently expressed from a shRNA resistant transcript (rP) to restore MeV growth in si2 cells (MOI 4). The inset presents the protein expression, as determined by Western blotting, showing resistance and sensitivity to si2 shRNA of the rP and P constructs, respectively. In the absence of urea, P migrates as a doublet due to its phosphorylation heterogeneity.
FIG 6
FIG 6
biG-biS assay: principle and proof of concept. (A) Antigenome (+ strand, 5′-3′) organization of recombinant “bi-P” MeV expressing two copies of the P gene: (wt) P1 with mRNA and protein tagged with three copies of the 21-nucleotide target of shRNA 1 (si1) and Flag peptide, respectively; (mutated) P2 with mRNA and protein tagged with three copies of the 21-nucleotide target of shRNA 2 (si2) and HA peptide, respectively. The virus is rescued and amplified in si2 cells (middle) to ensure successful recovery of a wt-like virus thanks to the selective expression of the P1wt gene. This virus can then be used to infect parental (∅, expressing no shRNA, left), si2 (middle), and si1 (right) cells to allow the expression and functional analysis of [Flag-P1 + HA-P2], Flag-P1, and HA-P2, respectively. The gray and black color lettering code for Flag-P1 and HA-P2 illustrates the absence or presence of the protein in the cells, respectively. (B) Efficiency of selective silencing of P1 and P2 from recombinant bi-P MeV in si1 and si2 cells after infection with biP MeV (MOI = 1) revealed by Western blot analysis at 24 hpi.
FIG 7
FIG 7
Impact of the D497 and A497 substitutions on P function in the viral context. [Pwt + P-D497] and [Pwt + P-A497] bi-P viruses were rescued and used to infect (MOI = 1) parental (∅, A [left panel] and B [shaded columns]), si2 (A [middle panel] and B [white columns]), and si1 (A [right panel] and B [black columns]) cells. The expression (in percentages of wt/wt virus as estimated by Western blotting with cl55 anti-N and 49.21 anti-P) of N (yellow columns) and P (blue columns) at 24 hpi (A), the percentage of (F-expressing) infected cells at 24 hpi (B), and virus production after infection at an MOI of 0.01 (C) were determined. For cytometry analysis of F expression, cell-cell fusion was prevented by adding fusion inhibitor peptide z-fFG after MeV infection. In panel C, virus production of si1 cells infected by the [Pwt + P-A497] virus was measured after one (p1) and two (p2) successive passages. Error bars indicate the standard deviations based on three experimental replicates. (D and E) Virions produced from si2 cells infected by bi-Pwt, [P1wt + P2-D497], and [P1wt + P2-A497] viruses have similar high Flag-P1 and low HA-P2 protein contents (D), while infection of parental Vero cells by these viruses resulted in the expression of both Flag-P1 and HA-P2 at a similar ratio (E).
FIG 8
FIG 8
(A) Analysis of biP virus stocks produced in Vero cells for their contamination with deletion (del-DI) and copyback (cb-DI). DI results were detected by RT-PCR. Heavy DI contents (identified by sequencing) of a Moraten MeV stock are shown as DI-positive controls (right lanes). Note the similar intensities of the genomic amplicons (gen) indicative of a similar genomic RNA load for the three viruses. The kinetics of N mRNA (B) and genome (C) accumulation after infection with biP wt/wt and wt/D497 viruses produced in parental Vero cells in which protein is expressed from both P genes (see Fig. 7E) were evaluated. Error bars indicate the standard deviations based on three experimental replicates. Slopes correspond to the transcript accumulation rate (according to Plumet et al. [7]). The genome inputs at earlier times (not shown) for both viruses were similar in range with 83 ± 41 (wt/wt) and 62 ± 18 (wt/D497) copies/μg of RNA (Student t test, P > 0.15). The inset in panel B shows that Pwt and P-D497 make homo- and hetero-oligomers with similar efficiencies, as determined by PCA.
FIG 9
FIG 9
Kinetics of N transcript (A and B) and genome (C and D) accumulation in si1 cells after infection with either wt/wt (A and C) or wt/D497 (B and D) biP viruses in the absence (full symbols, full lines) or presence of 20 μg of cycloheximide/ml (empty symbols and dotted lines). The linear accumulation of N transcripts in the presence of cycloheximide in the 2.5- to 12.5-h time interval (A and B) and in the absence of cycloheximide (B) is shown by the straight lines, equations, and the correlation r factor. Note that at the latest time point (18.5 hpi), the N mRNA (isolated symbols) amount dropped to near the levels detected at 2.5 hpi (A and B), in agreement with the genome contents decrease (C and D) in these three experimental settings, while upon infection with wt/wt virus in the absence of cycloheximide, the N mRNA accumulation sharply increased to reach a level well out of the graphic scale (A) and the genome accumulation started to increase (C). The P1wt gene is indicated in gray to reflect its silencing.

Similar articles

Cited by

References

    1. Morin B, Rahmeh AA, Whelan SP. 2012. Mechanism of RNA synthesis initiation by the vesicular stomatitis virus polymerase. EMBO J. 31:1320–1329. 10.1038/emboj.2011.483 - DOI - PMC - PubMed
    1. Albertini AA, Wernimont AK, Muziol T, Ravelli RB, Clapier CR, Schoehn G, Weissenhorn W, Ruigrok RW. 2006. Crystal structure of the rabies virus nucleoprotein-RNA complex. Science 313:360–363. 10.1126/science.1125280 - DOI - PubMed
    1. Green TJ, Zhang X, Wertz GW, Luo M. 2006. Structure of the vesicular stomatitis virus nucleoprotein-RNA complex. Science 313:357–360. 10.1126/science.1126953 - DOI - PubMed
    1. Tawar RG, Duquerroy S, Vonrhein C, Varela PF, Damier-Piolle L, Castagne N, MacLellan K, Bedouelle H, Bricogne G, Bhella D, Eleouet JF, Rey FA. 2009. Crystal structure of a nucleocapsid-like nucleoprotein-RNA complex of respiratory syncytial virus. Science 326:1279–1283. 10.1126/science.1177634 - DOI - PubMed
    1. Rudolph MG, Kraus I, Dickmanns A, Eickmann M, Garten W, Ficner R. 2003. Crystal structure of the Borna disease virus nucleoprotein. Structure 11:1219–1226. 10.1016/j.str.2003.08.011 - DOI - PubMed