. 2014 Sep;55(9):1636-45.
doi: 10.1093/pcp/pcu094. Epub 2014 Jul 8.

Microtubule initiation from the nuclear surface controls cortical microtubule growth polarity and orientation in Arabidopsis thaliana

Affiliations

Microtubule initiation from the nuclear surface controls cortical microtubule growth polarity and orientation in Arabidopsis thaliana

Chris Ambrose et al. Plant Cell Physiol. 2014 Sep.

Abstract

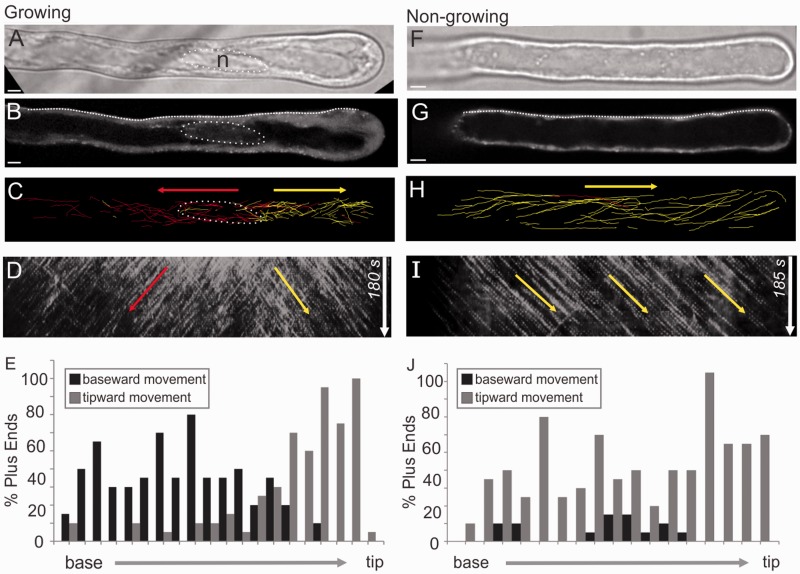
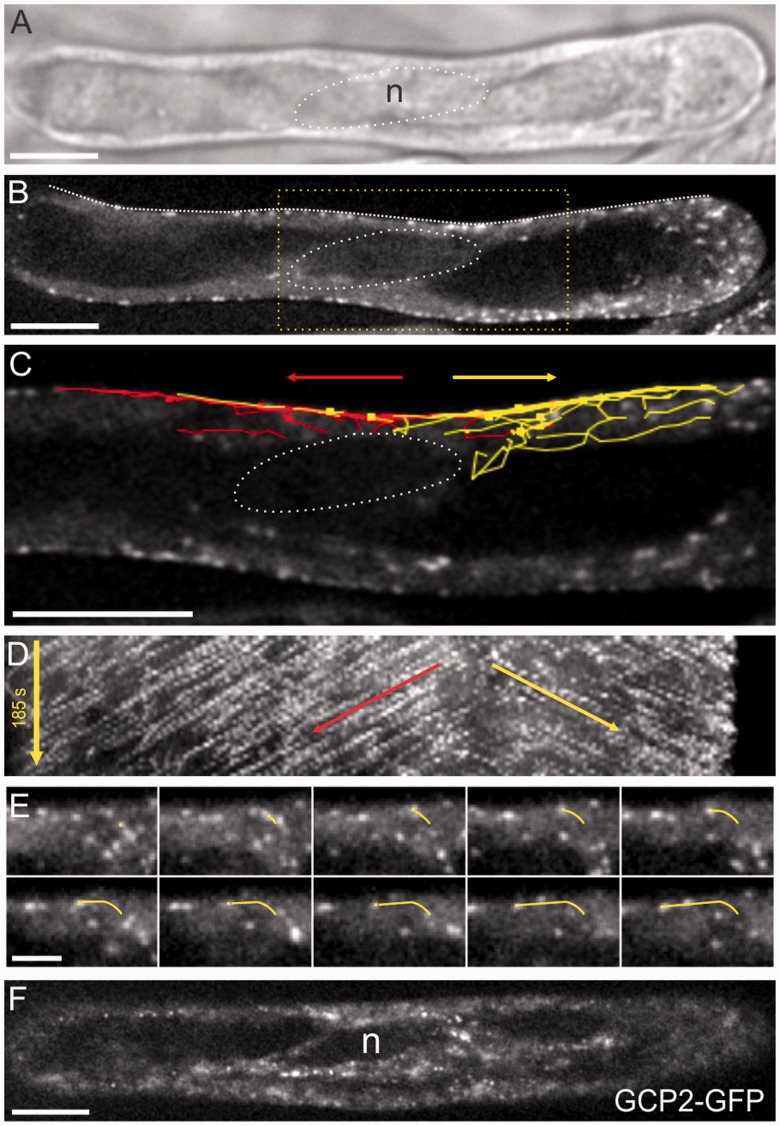
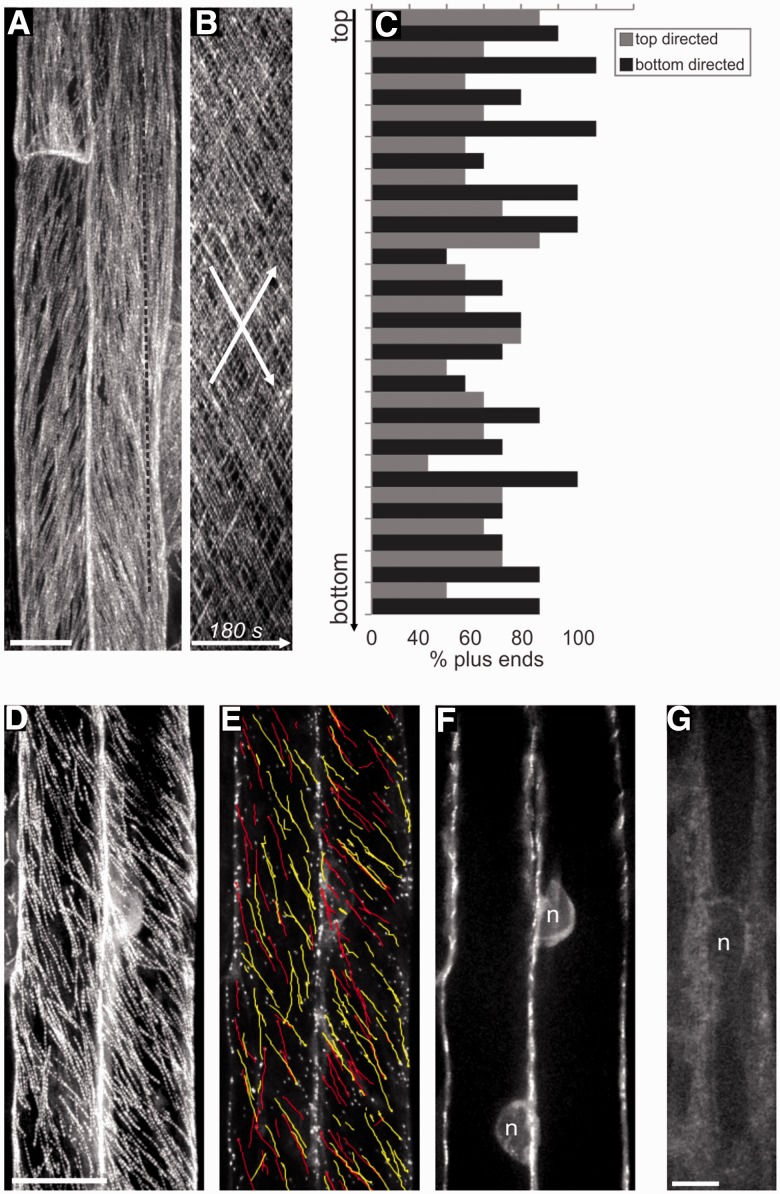
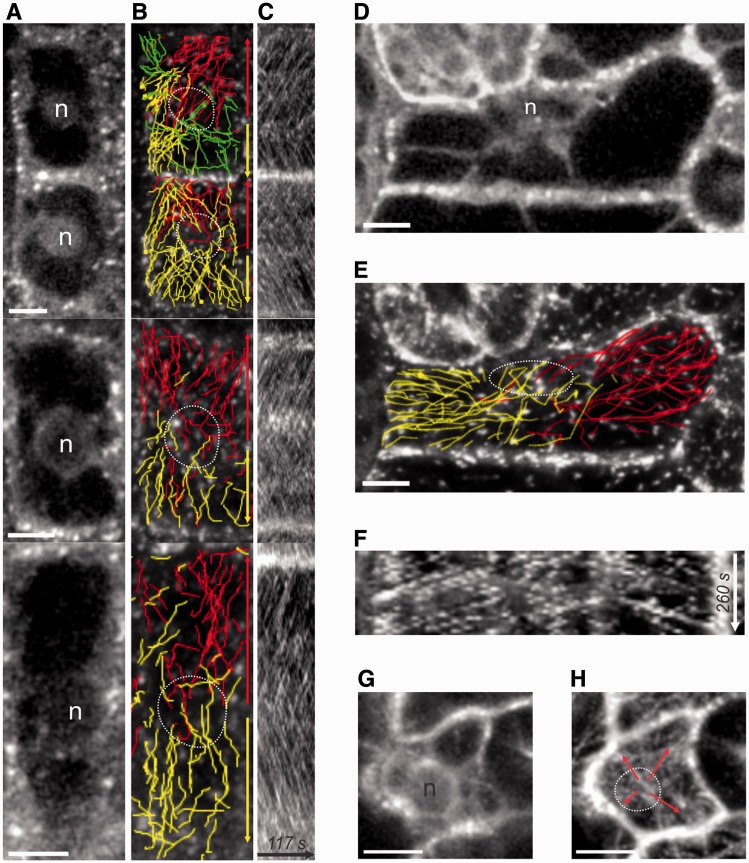
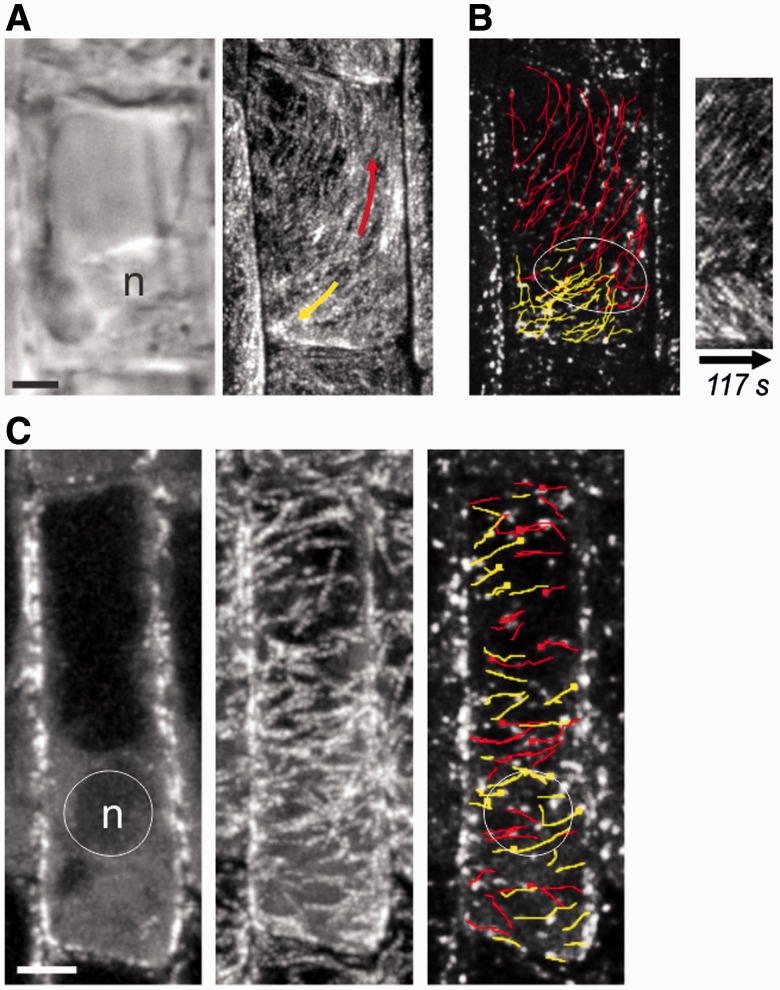
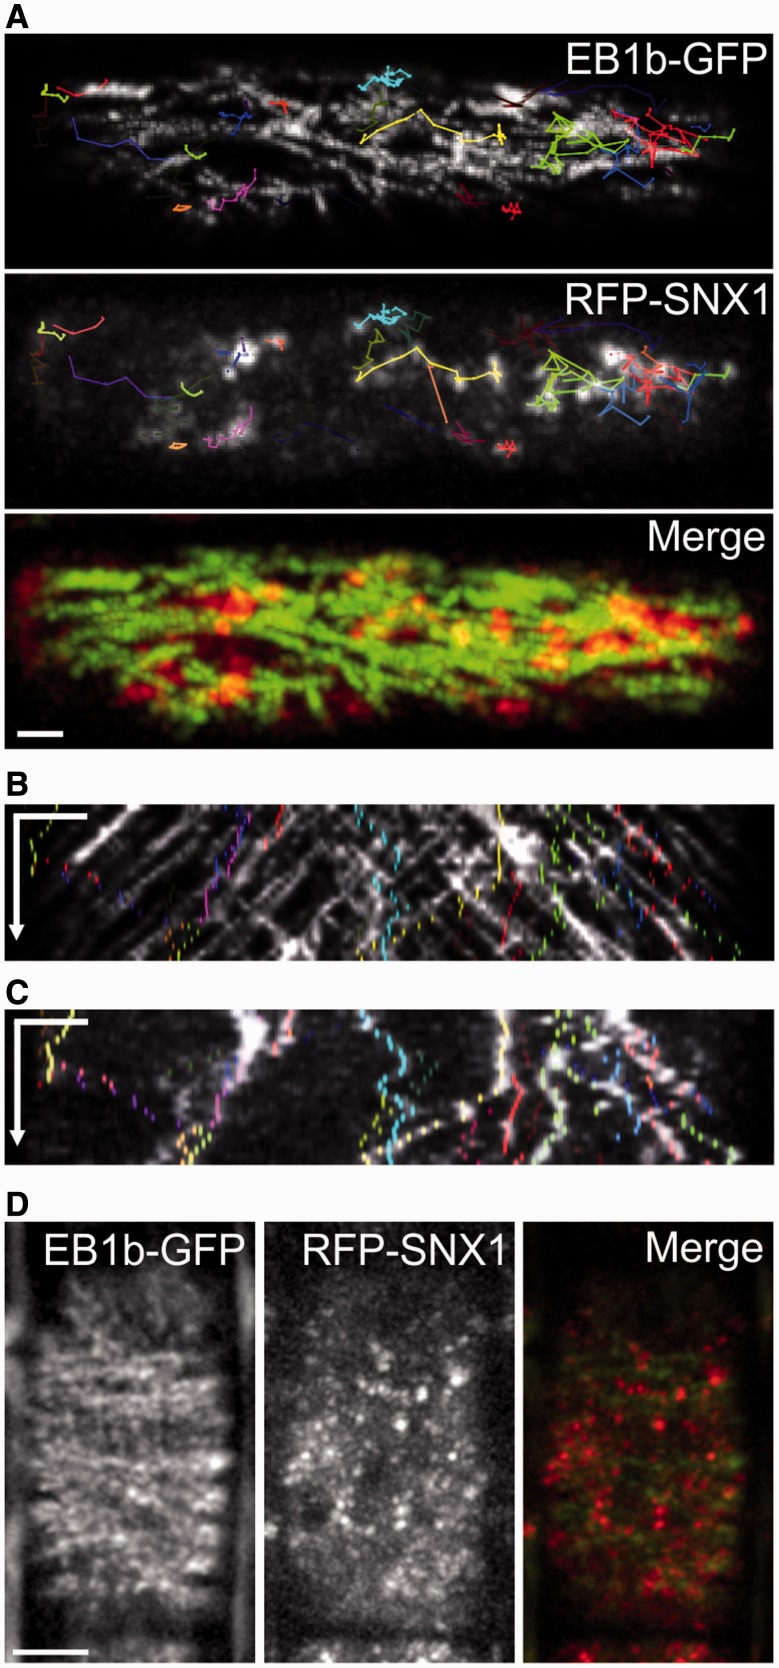
The nuclear envelope in plant cells has long been known to be a microtubule organizing center (MTOC), but its influence on microtubule organization in the cell cortex has been unclear. Here we show that nuclear MTOC activity favors the formation of longitudinal cortical microtubule (CMT) arrays. We used green fluorescent protein (GFP)-tagged gamma tubulin-complex protein 2 (GCP2) to identify nuclear MTOC activity and GFP-tagged End-Binding Protein 1b (EB1b) to track microtubule growth directions. We found that microtubules initiate from nuclei and enter the cortex in two directions along the long axis of the cell, creating bipolar longitudinal CMT arrays. Such arrays were observed in all cell types showing nuclear MTOC activity, including root hairs, recently divided cells in root tips, and the leaf epidermis. In order to confirm the causal nature of nuclei in bipolar array formation, we displaced nuclei by centrifugation, which generated a corresponding shift in the bipolarity split point. We also found that bipolar CMT arrays were associated with bidirectional trafficking of vesicular components to cell ends. Together, these findings reveal a conserved function of plant nuclear MTOCs and centrosomes/spindle pole bodies in animals and fungi, wherein all structures serve to establish polarities in microtubule growth.

Keywords: Arabidopsis; Cytoskeleton; Microtubule; Polarity; Root; Root hair.


Figures

Fig. 1
Fig. 1
Microtubule growth polarity corresponds to nuclear position in root hairs. Arabidopsis root hairs expressing EB1b–GFP in growing (A–E) and non-growing (F–J) hairs. (A and F) Differential interference contrast (DIC) images showing the nuclear position (circle). The nucleus is to the left of the imaged area in F. (B and G) Midplane confocal slices showing the nuclear position (circle). The nucleus is to the left of the imaged area in G. (C and H) Paths of manually tracked EB1b–GFP dots colored red for baseward or yellow for tipward movement. The nuclear position is shown with a dotted outline. (D and I) Kymographs corresponding to the midplane line drawn on a root hair. Arrows indicate dominant growth directions. (E and J) Histograms showing percentages of baseward vs. tipward MT growth polarities along the length of the root hairs. Scale bars, 5 µm.
Fig. 2
Fig. 2
Microtubules initiate from the nucleus in root hairs and enter the cortex in two directions (A) DIC image showing the nuclear position (circle). (B) Single EB1b–GFP midplane image showing the nuclear position (dotted circle). (C) Higher magnification of the boxed region in B, showing paths of manually tracked EB1b–GFP dots overlaid on a single time point entering the cortex in two directions above the nucleus. Red is baseward movement and yellow is tipward movement. Arrows indicate dominant growth directions. (D) Kymograph corresponding to the line drawn on the root hair in B. Arrows indicate dominant growth directions. (E) Montage from time series tracking a single EB1b–GFP as it enters the cortex and then grows along the cortex. (The yellow line is shown for reference of the track.) Intervals are 5 s between frames; total time is 50 s. (F) GCP2–3×GFP is localized to the nuclear surface and surrounding the cytoplasmic strand. Shown is an image of the confocal midplane of a root hair. Scale bars, 10 µm for all panels except E, which is 5 µm.
Fig. 3
Fig. 3
Atrichoblast cells lack bipolarity. (A) ZT projections (180 s) of EB1b–GFP in atrichoblast cells. The dotted line refers to the kymograph in B. (B) Kymograph of the cell in A corresponding to the dotted line drawn along the long axis of the cell. Arrows indicate the opposite but overlapping MT polarities. (C) Histogram showing percentages of baseward vs. tipward MT growth polarities along the length of the cell in A (the one used for the kymograph). (D) ZT projections (180 s) of EB1b–GFP in atrichoblast cells. (E) Growth paths of manually tracked EB1b–GFP dots overlaid on a single time point from cells in D. Yellow is top-directed movement and red is bottom-directed movement. (F) ZT projection of the cell midplane from cells in D and E, showing the nuclear position and lack of perinuclear MTs. (G) GFP–GCP2 localization in an atrichoblast cell. Signal does not accumulate in the perinuclear region. Scale bars, 10 µm.
Fig. 4
Fig. 4
Nucleocentric CMT polarities in the root division zone and leaf epidermal cells. (A) Midplane confocal slices showing the nuclear position for four representative cells with CMT bipolarities. (B) Paths of manually tracked EB1b–GFP dots colored red (topward movement) or yellow (bottomward movement) and overlaid on a single time point from the series. Dotted circles indicate the nuclear position. (C) Kymographs corresponding to lines drawn along the longitudinal axis in the middle of each cell. (D–F) Young leaf epidermal cell that still contains an active nucleus and exhibits nucleocentric CMT growth polarities. (D) Midplane confocal slice to show the nuclear position. (E) Paths of manually tracked EB1b–GFP dots colored red (rightward movement) or yellow (leftward movement) and overlaid on a single time point from the series. (F) Kymograph corresponding to the line drawn along the long axis in the middle of the cell. (G, H) Young polyhedral leaf epidermal cell showing EB1b–GFP tracks emanating from a central point in a radial manner. (G) Midplane showing the nuclear position. (F) Time projection of cell surface showing EB1b–GFP tracks. Arrows indicate growth directions. n, nucleus. Scale bars, 5 µm.
Fig. 5
Fig. 5
CMT bipolarity split point is the over nucleus in centrifuged root cells. (A) Epidermal division zone cell with sedimented nucleus (N). Left panel is a DIC image corresponding to the right panel, which shows a ZT projection of an EB1b-GFP time series. (B) Dual colored overlay of several EB1b-GFP dots in the cell from A. Red lines indicate upward transit, and yellow lines indicate downward transit. To the right is a kymograph drawn from this cell showing split polarity. (C) Lack of CMT growth polarities in cells with sedimented nuclei that lack MTOC activity. An elongated lateral root cap cell is shown. Left panel: the cellular midplane showing the nuclear position at the bottom of the cell. Middle panel: ZT projection of the same cell. Right panel: overlay of several EB1b–GFP growth paths. Red lines indicate right transit, and yellow lines indicate left transit. n, nucleus. Arrows indicate EB1b–GFP growth polarities. Time intervals are 5 s between time points. Scale bars, 5 µm.
Fig. 6
Fig. 6
Directional motility of sorting endosomes to cell poles in cells with bipolar CMTs. (A) Track paths of several RFP–SNX1 vesicles overlaid onto time projections of EB1b–GFP (top panel) and RFP–SNX1 (bottom panel). The bottom panel shows a merged image of GFP and RFP channels. (B) Kymograph showing correlation between vesicle paths (colored dots) and the EB1b–GFP channel. (C) Kymograph showing vesicle paths (colored dots) overlaid on the RFP–SNX1 channel. Time intervals are 2.5 s between time points, 60៎ s total. (D) Time projection of EB1b–GFP and RFP–SNX1 from the cell with the transverse CMT array. The right panel is the merged image of the first two panels. Total time is 120 s with 10 s intervals between acquisitions. Scale bars, 5 µm.

Similar articles

Cited by

References

    1. Allard JF, Wasteneys GO, Cytrynbaum EN. Mechanisms of self-organization of cortical microtubules in plants revealed by computational simulations. Mol. Biol. Cel. 2010;21:278–286. - PMC - PubMed
    1. Ambrose C, Allard JF, Cytrynbaum EN, Wasteneys GO. A CLASP-modulated cell edge barrier mechanism drives cell-wide cortical microtubule organization in Arabidopsis. Nat. Commun. 2011;2:430. - PMC - PubMed
    1. Ambrose C, Ruan Y, Gardiner J, Tamblyn LM, Catching A, Kirik V, et al. CLASP interacts with sorting nexin 1 to link microtubules and auxin transport via PIN2 recycling in Arabidopsis thaliana. Dev. Cell. 2013;24:649–659. - PubMed
    1. Ambrose C, Wasteneys GO. Cell edges accumulate gamma tubulin complex components and nucleate microtubules following cytokinesis in Arabidopsis thaliana cells. PLoS One. 2011;6:e27423. - PMC - PubMed
    1. Ambrose JC, Shoji T, Kotzer AM, Pighin JA, Wasteneys GO. The Arabidopsis CLASP gene encodes a microtubule-associated protein involved in cell expansion and division. Plant Cell. 2007;19:2763–2775. - PMC - PubMed

Publication types

MeSH terms

LinkOut - more resources