Alterations in the cholinergic system of brain stem neurons in a mouse model of Rett syndrome
- PMID: 25009110
- PMCID: PMC4166737
- DOI: 10.1152/ajpcell.00035.2014
Alterations in the cholinergic system of brain stem neurons in a mouse model of Rett syndrome
Abstract
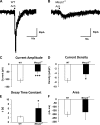
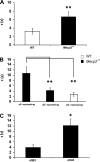
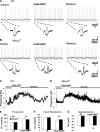
Rett syndrome is an autism-spectrum disorder resulting from mutations to the X-linked gene, methyl-CpG binding protein 2 (MeCP2), which causes abnormalities in many systems. It is possible that the body may develop certain compensatory mechanisms to alleviate the abnormalities. The norepinephrine system originating mainly in the locus coeruleus (LC) is defective in Rett syndrome and Mecp2-null mice. LC neurons are subject to modulation by GABA, glutamate, and acetylcholine (ACh), providing an ideal system to test the compensatory hypothesis. Here we show evidence for potential compensatory modulation of LC neurons by post- and presynaptic ACh inputs. We found that the postsynaptic currents of nicotinic ACh receptors (nAChR) were smaller in amplitude and longer in decay time in the Mecp2-null mice than in the wild type. Single-cell PCR analysis showed a decrease in the expression of α3-, α4-, α7-, and β3-subunits and an increase in the α5- and α6-subunits in the mutant mice. The α5-subunit was present in many of the LC neurons with slow-decay nAChR currents. The nicotinic modulation of spontaneous GABAA-ergic inhibitory postsynaptic currents in LC neurons was enhanced in Mecp2-null mice. In contrast, the nAChR manipulation of glutamatergic input to LC neurons was unaffected in both groups of mice. Our current-clamp studies showed that the modulation of LC neurons by ACh input was reduced moderately in Mecp2-null mice, despite the major decrease in nAChR currents, suggesting possible compensatory processes may take place, thus reducing the defects to a lesser extent in LC neurons.
Keywords: Mecp2; Rett syndrome; acetylcholine; compensatory mechanisms; locus coeruleus; nicotinic acetylcholine receptor.
Copyright © 2014 the American Physiological Society.
Figures


Similar articles
-
GABAergic synaptic inputs of locus coeruleus neurons in wild-type and Mecp2-null mice.Am J Physiol Cell Physiol. 2013 May 1;304(9):C844-57. doi: 10.1152/ajpcell.00399.2012. Epub 2013 Feb 7. Am J Physiol Cell Physiol. 2013. PMID: 23392116 Free PMC article.
-
Methyl CpG Binding Protein 2 Gene Disruption Augments Tonic Currents of γ-Aminobutyric Acid Receptors in Locus Coeruleus Neurons: IMPACT ON NEURONAL EXCITABILITY AND BREATHING.J Biol Chem. 2015 Jul 24;290(30):18400-11. doi: 10.1074/jbc.M115.650465. Epub 2015 May 15. J Biol Chem. 2015. PMID: 25979331 Free PMC article.
-
Cell-Genotype Specific Effects of Mecp2 Mutation on Spontaneous and Nicotinic Acetylcholine Receptor-Evoked Currents in Medial Prefrontal Cortical Pyramidal Neurons in Female Rett Model Mice.Neuroscience. 2019 Aug 21;414:141-153. doi: 10.1016/j.neuroscience.2019.07.008. Epub 2019 Jul 9. Neuroscience. 2019. PMID: 31299345
-
Exploring the possible link between MeCP2 and oxidative stress in Rett syndrome.Free Radic Biol Med. 2015 Nov;88(Pt A):81-90. doi: 10.1016/j.freeradbiomed.2015.04.019. Epub 2015 May 8. Free Radic Biol Med. 2015. PMID: 25960047 Review.
-
Cotransmission of acetylcholine and GABA.Neuropharmacology. 2016 Jan;100:40-6. doi: 10.1016/j.neuropharm.2015.07.031. Epub 2015 Jul 26. Neuropharmacology. 2016. PMID: 26220313 Free PMC article. Review.
Cited by
-
Substantial acetylcholine reduction in multiple brain regions of Mecp2-deficient female rats and associated behavioral abnormalities.PLoS One. 2021 Oct 21;16(10):e0258830. doi: 10.1371/journal.pone.0258830. eCollection 2021. PLoS One. 2021. PMID: 34673817 Free PMC article.
-
Metabolomic Fingerprint of Mecp2-Deficient Mouse Cortex: Evidence for a Pronounced Multi-Facetted Metabolic Component in Rett Syndrome.Cells. 2021 Sep 21;10(9):2494. doi: 10.3390/cells10092494. Cells. 2021. PMID: 34572143 Free PMC article.
-
Rett syndrome.Nat Rev Dis Primers. 2024 Nov 7;10(1):84. doi: 10.1038/s41572-024-00568-0. Nat Rev Dis Primers. 2024. PMID: 39511247 Review.
-
Effects of early-life exposure to THIP on phenotype development in a mouse model of Rett syndrome.J Neurodev Disord. 2016 Oct 19;8:37. doi: 10.1186/s11689-016-9169-2. eCollection 2016. J Neurodev Disord. 2016. PMID: 27777634 Free PMC article.
-
Disturbance of cardiac gene expression and cardiomyocyte structure predisposes Mecp2-null mice to arrhythmias.Sci Rep. 2015 Jun 15;5:11204. doi: 10.1038/srep11204. Sci Rep. 2015. PMID: 26073556 Free PMC article.
References
-
- Albuquerque EX, Alkondon M, Pereira EF, Castro NG, Schrattenholz A, Barbosa CT, Bonfante-Cabarcas R, Aracava Y, Eisenberg HM, Maelicke A. Properties of neuronal nicotinic acetylcholine receptors: pharmacological characterization and modulation of synaptic function. J Pharmacol Exp Ther 280: 1117–1136, 1997 - PubMed
-
- Alkondon M, Albuquerque EX. Diversity of nicotinic acetylcholine receptors in rat hippocampal neurons. I. Pharmacological and functional evidence for distinct structural subtypes. J Pharmacol Exp Ther 265: 1455–1473, 1993 - PubMed
-
- Aracri P, Consonni S, Morini R, Perrella M, Rodighiero S, Amadeo A, Becchetti A. Tonic modulation of GABA release by nicotinic acetylcholine receptors in layer V of the murine prefrontal cortex. Cereb Cortex 20: 1539–1555, 2010 - PubMed
Publication types
MeSH terms
Substances
Grants and funding
LinkOut - more resources
Full Text Sources
Other Literature Sources
Medical
Molecular Biology Databases

