. 2014 Jul 9;4(9):1671-80.
doi: 10.1534/g3.114.010892.

Genetic basis for Saccharomyces cerevisiae biofilm in liquid medium

Affiliations

Genetic basis for Saccharomyces cerevisiae biofilm in liquid medium

Kaj Scherz et al. G3 (Bethesda). .

Abstract

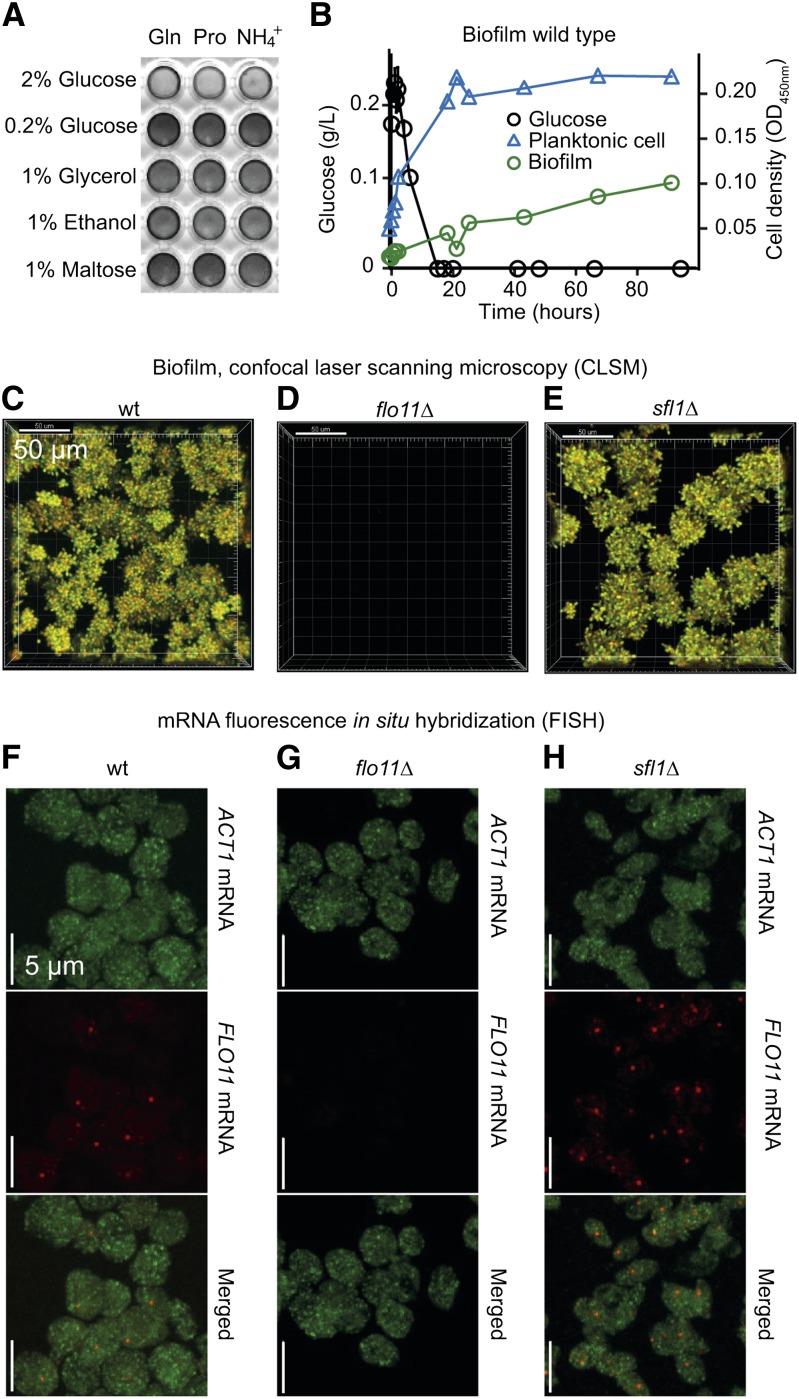
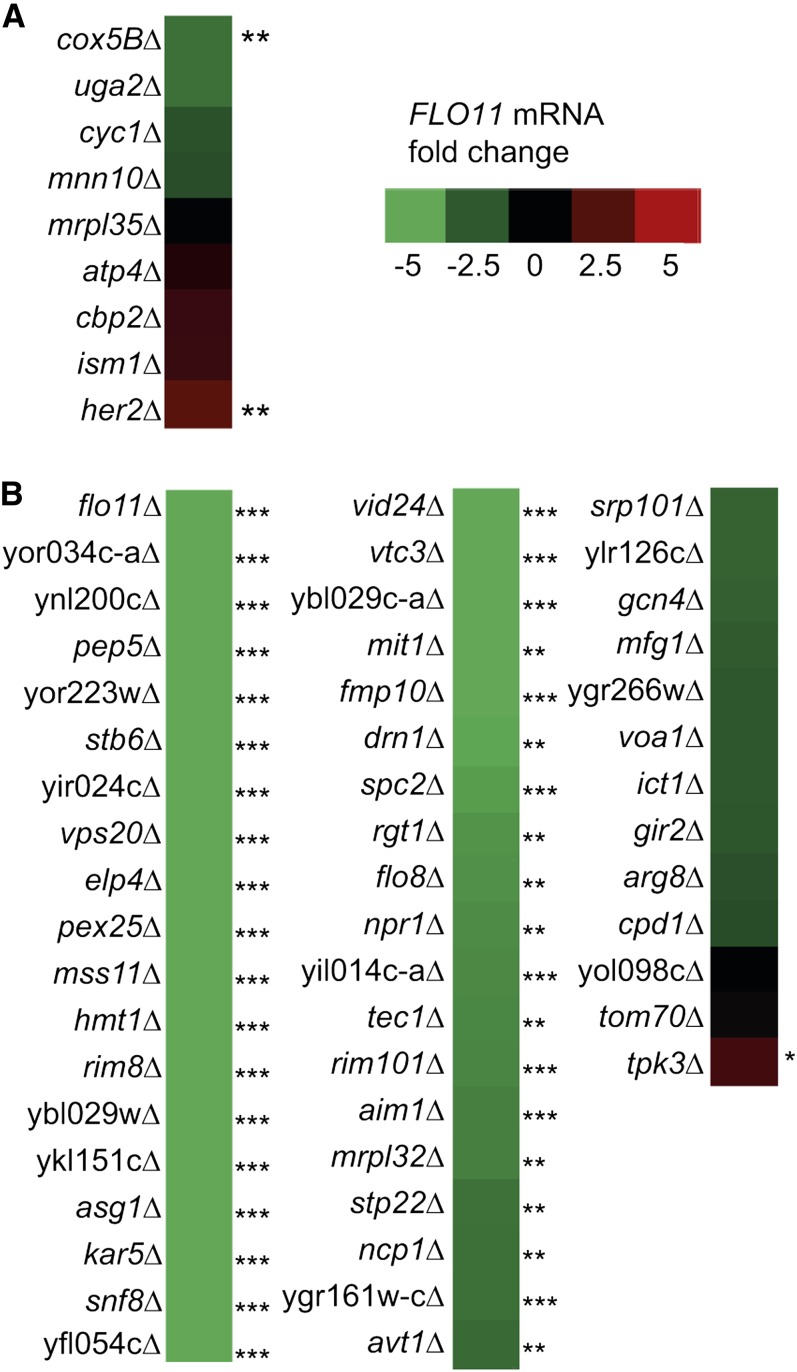
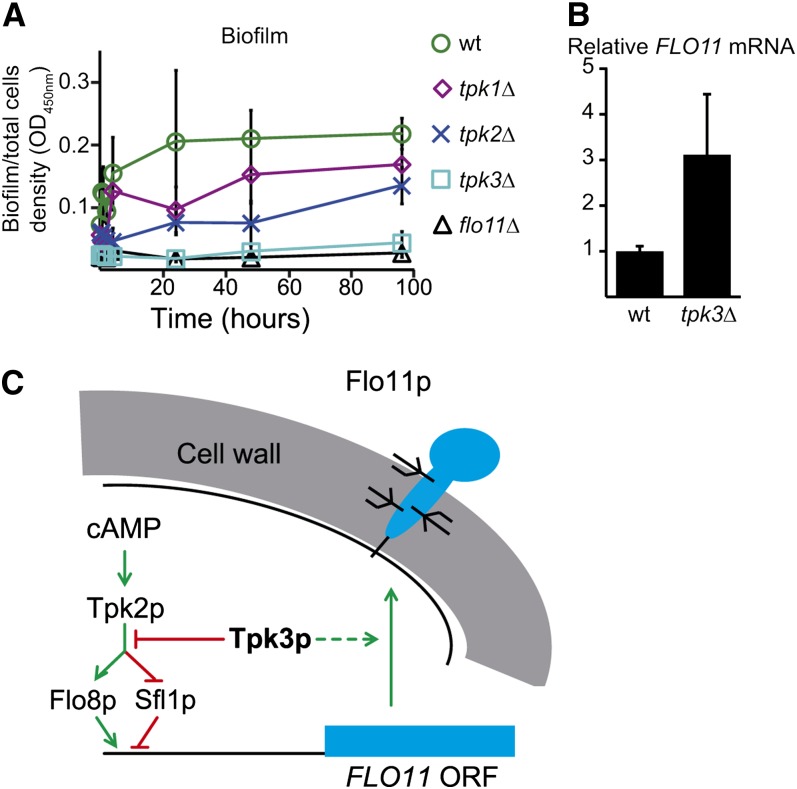
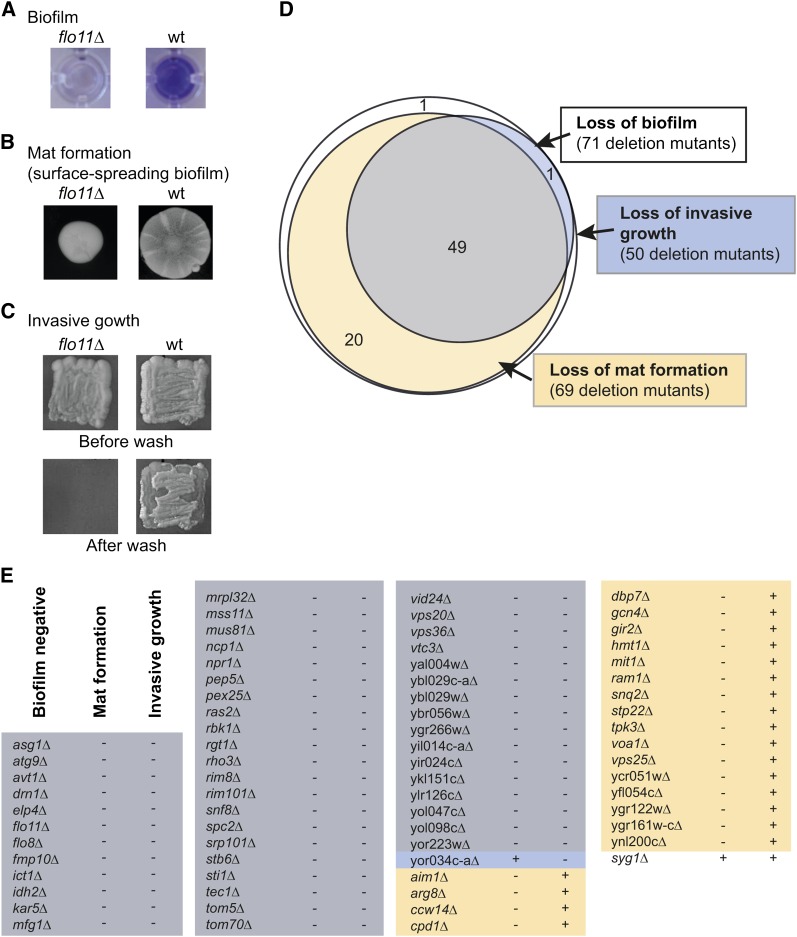
Biofilm-forming microorganisms switch between two forms: free-living planktonic and sessile multicellular. Sessile communities of yeast biofilms in liquid medium provide a primitive example of multicellularity and are clinically important because biofilms tend to have other growth characteristics than free-living cells. We investigated the genetic basis for yeast, Saccharomyces cerevisiae, biofilm on solid surfaces in liquid medium by screening a comprehensive deletion mutant collection in the Σ1278b background and found 71 genes that were essential for biofilm development. Quantitative northern blots further revealed that AIM1, ASG1, AVT1, DRN1, ELP4, FLO8, FMP10, HMT1, KAR5, MIT1, MRPL32, MSS11, NCP1, NPR1, PEP5, PEX25, RIM8, RIM101, RGT1, SNF8, SPC2, STB6, STP22, TEC1, VID24, VPS20, VTC3, YBL029W, YBL029C-A, YFL054C, YGR161W-C, YIL014C-A, YIR024C, YKL151C, YNL200C, YOR034C-A, and YOR223W controlled biofilm through FLO11 induction. Almost all deletion mutants that were unable to form biofilms in liquid medium also lost the ability to form surface-spreading biofilm colonies (mats) on agar and 69% also lost the ability to grow invasively. The protein kinase A isoform Tpk3p functioned specifically in biofilm and mat formation. In a tpk3 mutant, transcription of FLO11 was induced three-fold compared with wild-type, but biofilm development and cell-cell adhesion was absent, suggesting that Tpk3p regulates FLO11 positive posttranscriptionally and negative transcriptionally.The study provides a resource of biofilm-influencing genes for additional research on biofilm development and suggests that the regulation of FLO11 is more complex than previously anticipated.

Keywords: Biofilm; PKA; adhesion; genome-wide screen; multicellular.


Figures

Figure 1
Figure 1
S. cerevisiae Σ1278b forms mixed populations of biofilm and planktonic cells. (A) Wild-type cells grown at 30° in polystyrene wells in synthetic complete (SC) media in indicated carbon and nitrogen sources (Gln = glutamine 100 mM; Pro = proline 100 mM; NH4+ = ammonium 100 mM) for 96 hr and stained with crystal violet. Dark staining indicates biofilm formation. (B) Biofilm formation on polystyrene by a wild-type (wt) population in SC 0.2% glucose and NH4+. Blue triangles = nonadhering planktonic cells; green circles = biofilm-forming cells. Planktonic cells were separated from biofilms by pipetting. Cell density was measured at OD450nm. Black circles = measured glucose concentration left in growth medium over time. (C, D, E) Biofilm was recorded with confocal laser scanning microscopy (CLSM) after 96 hr of growth in SC 0.2% glucose and NH4+. Nonadhering cells were removed by a single gentle pipetting and adhering cells were dyed with FUN-1. White bar = 50 µm. (F, G, H) Single cell fluorescence in situ hybridization (FISH) of representative samples of cells grown in SC 0.2% glucose and NH4+ for 20 hr. Bars = 5 µm. (C, F) Wild-type. (D, G) flo11::kanMX in the wild-type background. (E, H) sfl1::kanMX in the wild-type background; MATa can1Δ::STE2p-spHIS5 lyp1Δ::STE3p-LEU2 his3::HisG leu2Δ ura3Δ.
Figure 2
Figure 2
Screening of a Σ1278b deletion mutant collection for genes essential in biofilm development. Mutants deleted for one of 4019 nonessential genes (indicated as geneX in MATa can1Δ::STE2p-spHIS5 lyp1Δ::STE3p-LEU2 his3::HisG leu2Δ ura3Δ geneX::kanMX) were tested for biofilm formation on polystyrene at 30° in liquid SC with 0.2% glucose and NH4+ medium. (A) Total biomass (OD600nm) vs. biofilm formation measured at OD595nm after crystal violet staining. Black circles = all data points for each mutant; red line = correlation between cell density and crystal violet staining; dotted red line = ±2σ. (B) Distribution of normalized biofilm from individual mutants as ln(crystal violet dyed biofilm/total biomass) compared with cell mass. Black circles = all data points for each mutant; red line = correlation between biomass and normalized biofilm; dotted red line = ±2σ. (A and B) Values obtained after 96 hr of biofilm development. (C) Histograms representing median normalized biofilm values of the 4019 deletion mutants assayed in triplicate. Black line = normalized biofilm values for the parental wild-type Σ1278b strain (n = 288) showing Gaussian distribution after 48 hr of growth. Biofilm distribution of the parental strain after 48 hr was used to set cut-off to average ±2σ. Blue bars = biofilms of mutants that formed significantly less biofilm than the parental strain; yellow bars = biofilm values of mutants that formed significantly more biofilm than the wild-type strain. (D) As in (C) after 96 hr of growth. Biofilm distribution of the parental strain after 96 hr of growth was used to set cut-offs to average ±2σ. A complete list of mutants and median normalized biofilm values are listed File S1 and File S2.
Figure 3
Figure 3
Heat map of FLO11 mRNA levels in mutants with reduced biofilm. FLO11 mRNA levels used for the heat map were measured by northern dot blots of mutants grown for 96 hr in 0.2% glucose synthetic medium. FLO11 mRNA levels were normalized to ACT1 mRNA levels and the wild-type ACT1:FLO11 mRNA ratio was set as 0. Mutants with significantly altered FLO11 mRNA levels compared with the parental strain are indicated with asterisks (***P ≤ 0.01, **0.01 < P < 0.05, *0.05 < P < 0.1; n = 3). (A) Transcript levels of FLO11 in deletion mutants with increased biofilm formation compared with the parental strain. (B) Transcript levels of FLO11 in deletion mutants that had lost the ability to form biofilm. Numerical values of FLO11 mRNA levels are listed in File S5.
Figure 4
Figure 4
TPK3 is essential for biofilm development. (A) The percentage of cells forming a biofilm on polystyrene compared with planktonic cells was determined as described in the legend for Figure 1B using OD450nm to determine the biomass of the total population and the biofilm subpopulation. Wild-type = green circle; flo11 mutant = black triangles; tpk1 mutant = purple diamond; tpk2 mutant = blue cross; tpk3 mutant = turquoise square. (B) FLO11 mRNA levels in the wild-type and the tpk3 mutant. Relative FLO11 mRNA levels were found by normalizing to ACT1 mRNA levels and the average wild-type ACT1:FLO11 mRNA ratio was set as 1. Both experiments were performed in triplicate (File S5). (C) Model of Tpk3p transcriptional and posttranscriptional regulation of FLO11. Green arrows, positive regulation; red bars, negative regulation. Experimental evidence for the interaction between Tpk2p and Tpk3p is also available (Robertson and Fink 1998).
Figure 5
Figure 5
Most genes essential for biofilm are also essential for invasive growth and surface-spreading biofilm formation. (A) Biofilms in microtiter plates stained with crystal violet as described in Figure 2A legend. Color indicates biofilm. Wt, wild-type. Σ1278b parental strain (MATa can1Δ::STE2p-spHIS5 lyp1Δ::STE3p-LEU2 his3::HisG leu2Δ ura3Δ); flo11Δ, flo11::kanMX in the wild-type background. (B) Mat formation of wild-type and lack of mat by flo11 on semisolid YPD (0.3% agar) after 5 d at room temperature (22°–25°). (C) Invasive growth of wild-type and flo11 mutant. Invasive growth was tested after 3 d on solid YPD (2% agar) at 30° by washing colonies gently with water to remove nonadhering cells. (D) Diagram of deletion mutants that lost the ability to form biofilm and mats and grow invasively. (E) List of phenotypes of mutants with gene deletion that eliminated biofilm formation. Images of mat formation and invasive growth of all mutants are in Figure S3 and Figure S4.

References

    1. Ashe M. P., De Long S. K., Sachs A. B., 2000. Glucose depletion rapidly inhibits translation initiation in yeast. Mol. Biol. Cell 11: 833–848 - PMC - PubMed
    1. Barrales R. R., Jimenez J., Ibeas J. I., 2008. Identification of novel activation mechanisms for FLO11 regulation in Saccharomyces cerevisiae. Genetics 178: 145–156 - PMC - PubMed
    1. Bayly J. C., Douglas L. M., Pretorius I. S., Bauer F. F., Dranginis A. M., 2005. Characteristics of Flo11-dependent flocculation in Saccharomyces cerevisiae. FEMS Yeast Res. 5: 1151–1156 - PubMed
    1. Braus G. H., Grundmann O., Brückner S., Mösch H. U., 2003. Amino acid starvation and Gcn4p regulate adhesive growth and FLO11 gene expression in Saccharomyces cerevisiae. Mol. Biol. Cell 14: 4272–4284 - PMC - PubMed
    1. Brückner S., Mösch H. U., 2011. Choosing the right lifestyle: adhesion and development in Saccharomyces cerevisiae. FEMS Microbiol. Rev. 36: 25–58 - PubMed

Publication types

MeSH terms