. 2014 Aug 15;193(4):1622-35.
doi: 10.4049/jimmunol.1401243. Epub 2014 Jul 9.

Human XCR1+ dendritic cells derived in vitro from CD34+ progenitors closely resemble blood dendritic cells, including their adjuvant responsiveness, contrary to monocyte-derived dendritic cells

Affiliations

Human XCR1+ dendritic cells derived in vitro from CD34+ progenitors closely resemble blood dendritic cells, including their adjuvant responsiveness, contrary to monocyte-derived dendritic cells

Sreekumar Balan et al. J Immunol. .

Abstract

Human monocyte-derived dendritic cell (MoDC) have been used in the clinic with moderately encouraging results. Mouse XCR1(+) DC excel at cross-presentation, can be targeted in vivo to induce protective immunity, and share characteristics with XCR1(+) human DC. Assessment of the immunoactivation potential of XCR1(+) human DC is hindered by their paucity in vivo and by their lack of a well-defined in vitro counterpart. We report in this study a protocol generating both XCR1(+) and XCR1(-) human DC in CD34(+) progenitor cultures (CD34-DC). Gene expression profiling, phenotypic characterization, and functional studies demonstrated that XCR1(-) CD34-DC are similar to canonical MoDC, whereas XCR1(+) CD34-DC resemble XCR1(+) blood DC (bDC). XCR1(+) DC were strongly activated by polyinosinic-polycytidylic acid but not LPS, and conversely for MoDC. XCR1(+) DC and MoDC expressed strikingly different patterns of molecules involved in inflammation and in cross-talk with NK or T cells. XCR1(+) CD34-DC but not MoDC efficiently cross-presented a cell-associated Ag upon stimulation by polyinosinic-polycytidylic acid or R848, likewise to what was reported for XCR1(+) bDC. Hence, it is feasible to generate high numbers of bona fide XCR1(+) human DC in vitro as a model to decipher the functions of XCR1(+) bDC and as a potential source of XCR1(+) DC for clinical use.


Figures

FIGURE 1.
FIGURE 1.
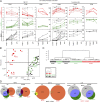
Characterization of in vitro–generated CD34-DC subsets. (A) Identification of cell subsets in cultures of CD34+ CB progenitors based on the expression of CD11c and CD141 for FS3T cultures (left contour plot, double-negative cells in violet, XCR1 CD34-DC in green and XCR1+ CD34-DC in red) and G4 cultures (right contour plot, MoDC in black). (B) Expression of XCR1, CLEC9A, and CADM1 on each of the cell subsets identified in (A), using the same color code. Isoptype control stainings are shown as gray curve on each histogram. For (A) and (B), one representative result of at least three independent cultures is shown. (C) Microscopy analysis of the morphology of Giemsa/May–Grünwald-stained DC subsets sorted from the cultures of CD34+ CB progenitors or from the blood of adult healthy donors. (DG) Gene expression profiling of XCR1+ CD34-DC, XCR1 CD34-DC, and MoDC. Microarrays were performed on total RNA extracted from DC subsets FACS purified from FS3T culture (XCR1+ CD34-DC and XCR1 CD34-DC), from G4 cultures (MoDC), or from the blood of adult healthy donors (bpDC, CD1c+ bDC, and XCR1+ bDC). (D) PCA performed on all ProbeSets. (E) Hierarchical clustering performed on the 3934 genes showing a fold change ≥ 2 between at least two of the cell types studied, using Pearson and average as distance metric/linkage parameters. The numbers above edges indicate the robustness of the corresponding node, calculated as the percentage of occurrence of this node among 1000 independent trees generated by multiscale bootstrap resampling. (F) BioLayoutExpress clustering of the same set of genes as used in (E). On the left, the size of the different clusters and their relationships are shown as tridimensional clouds with each gene represented as a node colored accordingly to the gene clusters to which it belongs. The calculation parameters used were a cutoff for Pearson correlation coefficient at 0.8 and an inflation value at 2. Only clusters encompassing ≥50 genes are represented. On the right, the average gene expression pattern across all cell types examined is shown for each cluster. (G) Heat maps showing the expression patterns for 20 individual genes selected from each cluster mostly based on prior knowledge of their selective expression in ex vivo–isolated bDC subsets (bold red for XCR1+ bDC-specific genes) or monocyte-derived inflammatory DC (bold green) and/or based on prior knowledge of their functions.
FIGURE 2.
FIGURE 2.
Phenotypic analyses confirm microarray data regarding the identity of CD34-DC subsets. DC cultures were stained with Abs against TLR3 or a variety of cell surface markers selected based on available Abs and differential expression of the corresponding genes between XCR1+ versus XCR1 CD34-DC as shown in Fig. 1G. Data were analyzed as in Fig. 1A and 1B. One representative result of at least three independent cultures is shown.
FIGURE 3.
FIGURE 3.
Efficient differentiation of XCR1+ DC in FS3T cultures of CD34+ hematopoietic progenitors from the bone marrow of adult donors. (A) Identification of cell subsets in cultures of adult bone marrow CD34+ progenitors based on the expression of CD11c and CD141, for FS3T cultures, similarly to what is shown for CB cultures on Fig. 1A. (B) Expression of selected markers on each of the cell subsets identified in (A), similarly to what is shown for CB cultures cultures on Figs. 1B and 2. One representative result of at least two independent cultures is shown.
FIGURE 4.
FIGURE 4.
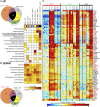
XCR1+ CD34-DC are uniquely and very strongly activated by polyI:C but fail to respond to LPS, whereas XCR1 CD34-DC and MoDC show a reverse pattern. (A) Phenotypic maturation of CD34-DC subsets in response to stimulation with PolyI:C, R848, or LPS. MoDC generated from five different CB samples and seven independent cultures and XCR1 versus XCR1+ CD34-DC subsets sorted from nine independent CB cultures representing five different CB samples were incubated for 16 h in medium alone (control) or with PolyI:C, R848, or LPS. Cells were then stained with Abs for the maturation markers CD83, CD86, CD40, or isotype control Abs. Results are represented as fold change (FC) of mean fluorescence intensity (MFI) above control cultures (left graphs) or as percentage of positive cells (right graphs) as a function of stimuli for each individual CB samples (symbols). To determine significance, a Wilcoxon matched-pairs signed rank test was performed on 10 independent cultures from five different donors. *p < 0.05, **p < 0.01, ***p < 10−3. (BD) Gene expression profiling of CD34-DC subsets exposed to PolyI:C, R848, or LPS. Genome-wide expression analysis was performed on XCR1+ versus XCR1 CD34-DC subsets sorted from three to six independent FS3T CB cultures and on three independent MoDC cultures. (B) PCA performed on all ProbeSets. (C) Unsupervised hierarchical clustering of stimulated DC subsets performed on the 5015 genes showing a FC ≥ 1.5 between at least two conditions. (D) Venn diagrams showing the number of genes induced (UP) or repressed (DOWN) in each DC subset by R848 (left), PolyI:C (middle), or LPS (right), as well as the overlap for a given stimulus between DC subset responses.
FIGURE 5.
FIGURE 5.
Comparison of the genetic reprogramming of XCR1+ DC in response to PolyI:C and XCR1 DC or MoDC in response to LPS. Venn diagrams were performed on the data from Fig. 4E to compare the sets of genes induced (A) or repressed (B) in XCR1+ DC in response to PolyI:C and XCR1- DC or MoDC in response to LPS. Ingenuity pathway analyses were performed for each set of genes as defined by the different areas of the Venn diagrams to determine whether these lists where enriched for genes annotated for specific pathways. The results are shown as heat maps where the color intensity increases with statistical significance of the annotation enrichment. (C) A heat map showing the expression patterns of the genes responsible for the enrichment of the pathways NF-KB signaling and IFN signaling shown in (A). The red font identifies the genes previously reported to be part of the core transcriptomic signature commonly upregulated in mouse DC subsets and in human pDC or MoDC upon activation with a variety of microbial stimuli.
FIGURE 6.
FIGURE 6.
Cytokine production by CD34-DC subsets and MoDC. DC subsets were sorted and stimulated as described in Fig. 4. (A) Expression pattern of selected genes. Genes highlighted in bold green are 1) already expressed to higher levels in steady state XCR1 CD34-DC or MoDC, as compared with XCR1+ CD34-DC (except for IL12B and IL18, which are not detected at steady state), 2) further induced specifically in XCR1 CD34-DC or MoDC upon R848 or LPS stimulation, and 3) encoded for molecules with proinflammatory or matrix remodeling functions, except for IL-10, which is anti-inflammatory. Genes highlighted in bold red are induced to higher levels in PolyI:C-activated XCR1+ CD34-DC as compared with all the other conditions examined and encode for antiviral, antiapoptotic, or NK/T cell–stimulating molecules. (B) Secretion of selected cytokines. Culture supernatants were used for Luminex-based detection of 18 different analytes. Results from three to eight independent cultures for each DC subset are shown as individual points, with bar overlays indicating mean ± SD. Dotted lines in the graph show detection (bottom) or saturation (top) thresholds. Color codes for molecule names are the same as in (A).
FIGURE 7.
FIGURE 7.
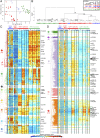
Comparison of the responses to adjuvants of CD34-DC and bDC subsets. XCR1+ bDC and CD1c+ bDC were FACS sorted from the blood of adult healthy donors, stimulated in vitro under the same conditions described in Fig. 4 for CD34-DC subsets, and processed for microarrays. Data were analyzed together with those of CD34-DC subsets shown in Fig. 4. (A) PCA performed on the 2978 genes showing a fold change ≥ 2 between at least two of the conditions studied. (B) Hierarchical clustering performed on the same set of genes as in (A), using Pearson/Ward as distance metric/linkage parameters. (C) A heat map showing the expression patterns of the genes bearing the most weight on cell type distribution along the PC1, PC2, and PC3 axes of the PCA illustrated in (A). (D) A heat map showing the expression patterns of PolyI:C-induced genes harboring contrasting expression patterns across conditions. Individual expression patterns of a few selected PolyI:C-induced genes are shown on Supplemental Fig. 3 as bar graphs of mean ± SD of relative linear expression values for each combination of DC subset/stimulus to better show the differential expression between conditions.
FIGURE 8.
FIGURE 8.
Activation of T lymphocytes by resting and stimulated CD34-DC subsets and MoDC. (A) Allogeneic CD4+ T cell activation. FS3T* CD34-DC subsets and MoDC were cocultured for 6 d with CFSE-labeled allogeneic CD4+ T cells. The percentages of CD4+ T cells showing CFSE dilution are shown on the left graphs and the fold changes in CD4+ T cell numbers on the right graphs as a function of stimuli. Results are shown as mean ± SD for three to four independent MLR cultures for each DC subset with three replicate wells per culture. To determine significance, a Wilcoxon matched-pairs signed rank test was performed. (B and C) Cross-presentation of a cell-associated Ag by FS36 CD34-DC subsets and by MoDC derived from adult peripheral blood monocytes. (B) Each DC subset was cocultured 24 h with N9V/OVA-expressing K562 cells with or without R848 or PolyI:C (ratio DC:tumor = 1:1) and tested for induction of IFN-γ production by an N9V-specific T cell clone as assessed by intracellular staining. (C) N9V peptide–pulsed DC subsets were used as a positive control for the activation of the N9V-specific T cell clone and to ensure that all DC subsets were viable and had a similar efficacy for direct presentation of an optimal MHC-I–restricted epitope. No cross-presentation was observed in absence of cognate Ag when using K562 cells transfected with a vector expressing GFP only (data not shown). Results are shown as individual percentages of IFN-γ–expressing T cells for four to six independent experiments for each DC subset, with mean values indicated by black horizontal bars. To determine significance, a Wilcoxon matched-pairs signed rank test was performed. *p < 0.05, **p < 0.01.

References

    1. Adema G. J., de Vries I. J., Punt C. J., Figdor C. G. 2005. Migration of dendritic cell based cancer vaccines: in vivo veritas? Curr. Opin. Immunol. 17: 170–174 - PubMed
    1. Plantinga M., Guilliams M., Vanheerswynghels M., Deswarte K., Branco-Madeira F., Toussaint W., Vanhoutte L., Neyt K., Killeen N., Malissen B., Hammad H., Lambrecht B. N. 2013. Conventional and monocyte-derived CD11b+ dendritic cells initiate and maintain T helper 2 cell-mediated immunity to house dust mite allergen. Immunity 38: 322‑335 - PubMed
    1. Ziegler-Heitbrock L., Ancuta P., Crowe S., Dalod M., Grau V., Hart D. N., Leenen P. J., Liu Y. J., MacPherson G., Randolph G. J., et al. 2010. Nomenclature of monocytes and dendritic cells in blood. Blood 116: e74–e80 - PubMed
    1. Robbins S. H., Walzer T., Dembélé D., Thibault C., Defays A., Bessou G., Xu H., Vivier E., Sellars M., Pierre P., et al. 2008. Novel insights into the relationships between dendritic cell subsets in human and mouse revealed by genome-wide expression profiling. Genome Biol. 9: R17. - PMC - PubMed
    1. Crozat K., Guiton R., Guilliams M., Henri S., Baranek T., Schwartz-Cornil I., Malissen B., Dalod M. 2010. Comparative genomics as a tool to reveal functional equivalences between human and mouse dendritic cell subsets. Immunol. Rev. 234: 177–198 - PubMed

Publication types

MeSH terms

Associated data