. 2014 Jul 9;6(244):244ra89.
doi: 10.1126/scitranslmed.3008065.

Cortical GABAergic excitation contributes to epileptic activities around human glioma

Affiliations

Cortical GABAergic excitation contributes to epileptic activities around human glioma

Johan Pallud et al. Sci Transl Med. .

Abstract

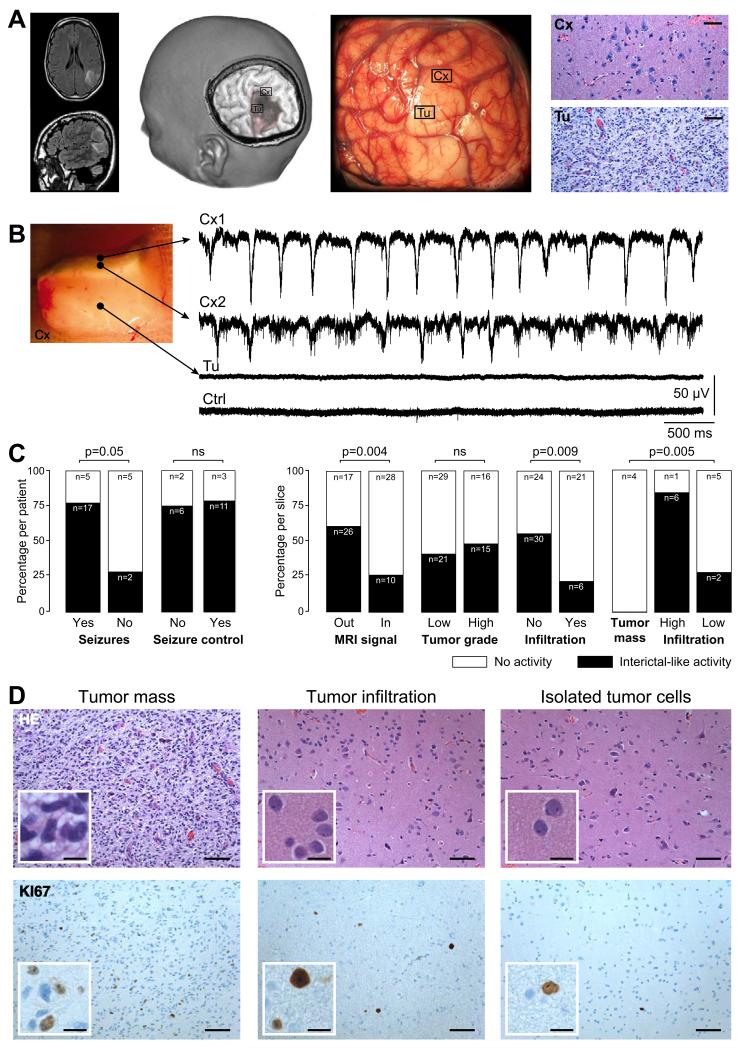
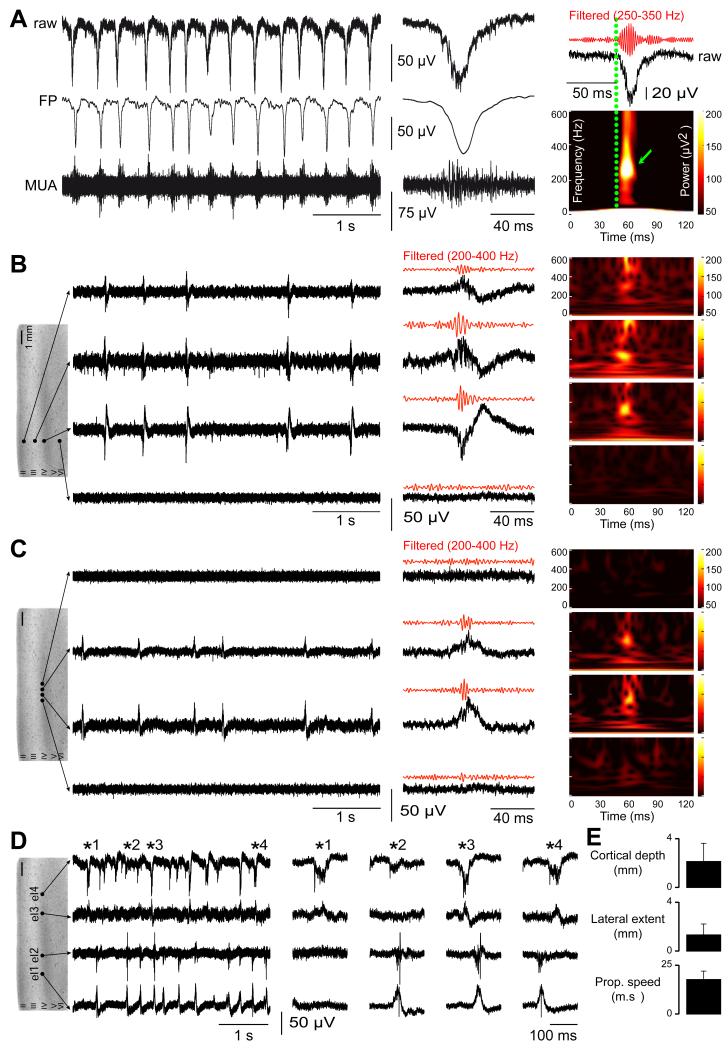
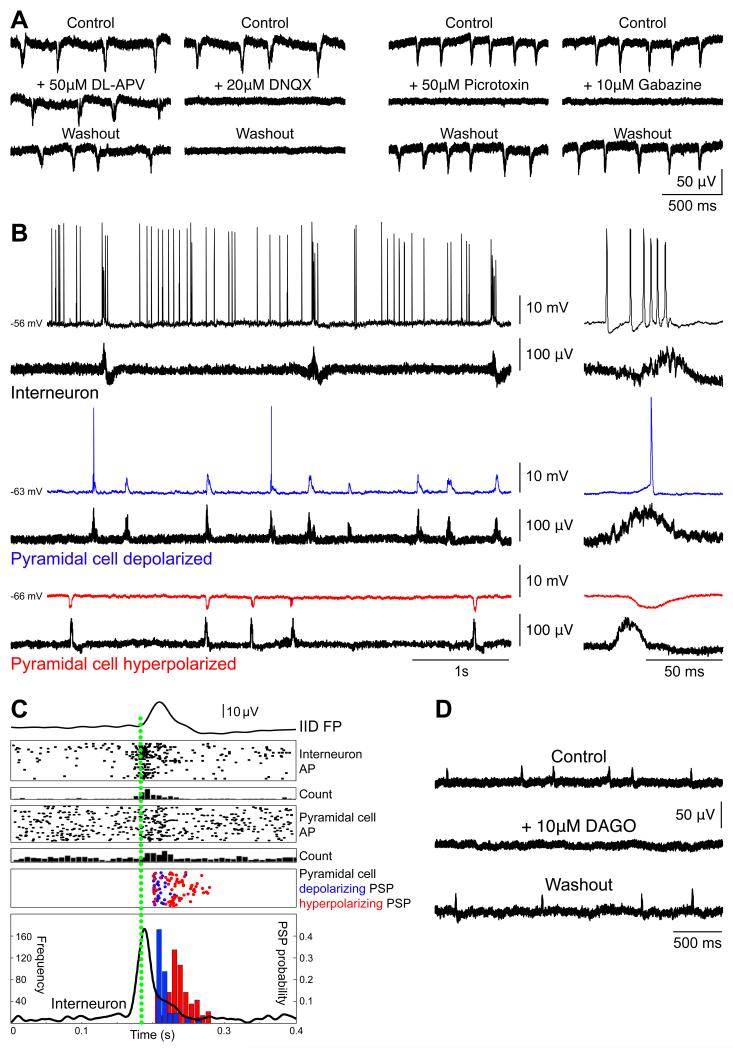
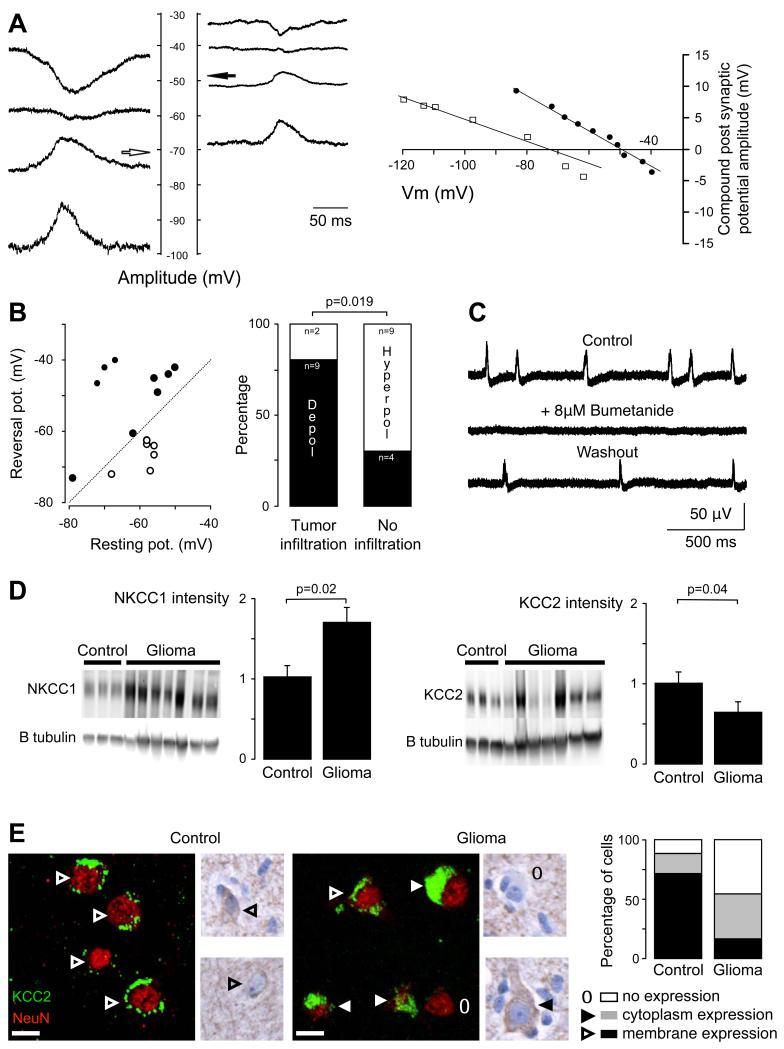
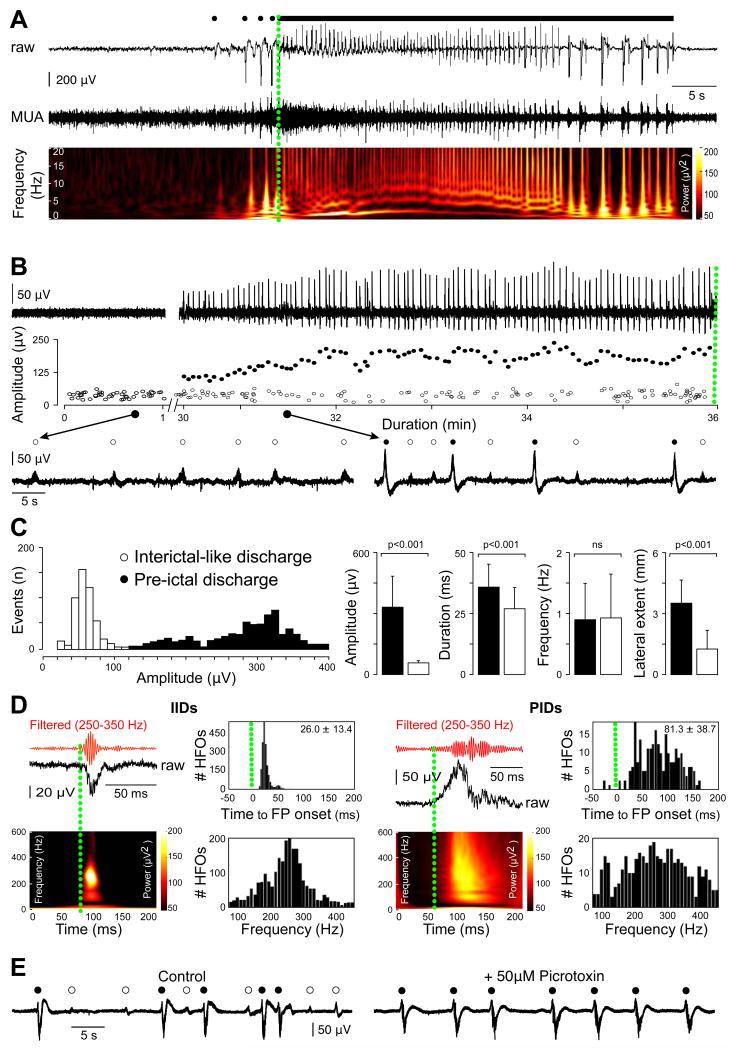
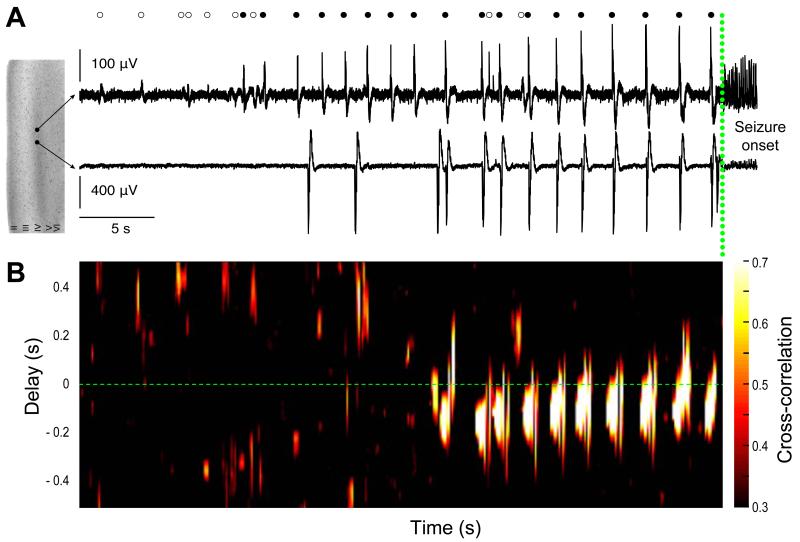
Brain gliomas are highly epileptogenic. Excitatory glutamatergic mechanisms are involved in the generation of epileptic activities in the neocortex surrounding gliomas. However, chloride homeostasis is known to be perturbed in glioma cells. Thus, the contribution of γ-aminobutyric acidergic (GABAergic) mechanisms that depend on intracellular chloride merits closer study. We studied the occurrence, networks, cells, and signaling basis of epileptic activities in neocortical slices from the peritumoral surgical margin resected around human brain gliomas. Postoperative glioma tissue from 69% of patients spontaneously generated interictal-like discharges, synchronized, with a high-frequency oscillation signature, in superficial layers of neocortex around areas of glioma infiltration. Interictal-like events depended both on glutamatergic AMPA receptor-mediated transmission and on depolarizing GABAergic signaling. GABA released by interneurons depolarized 65% of pyramidal cells, in which chloride homeostasis was perturbed because of changes in expression of neuronal chloride cotransporters: KCC2 (K-Cl cotransporter 2) was reduced by 42% and expression of NKCC1 (Na-K-2Cl cotransporter 1) increased by 144%. Ictal-like activities were initiated by convulsant stimuli exclusively in these epileptogenic areas. This study shows that epileptic activities are sustained by excitatory effects of GABA in human peritumoral neocortex, as reported in temporal lobe epilepsies, suggesting that both glutamate and GABA signaling and cellular chloride regulation processes, all also involved in oncogenesis as already shown, induce an imbalance between synaptic excitation and inhibition underlying epileptic discharges in glioma patients. Thus, the control of chloride in neurons and glioma cells may provide a therapeutic target for patients with epileptogenic gliomas.


Figures

Figure 1
Figure 1. Interictal-like discharges are generated in the human neocortex infiltrated by glioma cells
(A) Example of a left parietal low-grade (World Health Organization grade II) glioma. The tumor appears as a hypersignal area on a Fluid Attenuated Inversion Recovery (FLAIR) sequence (left), as a hyposignal area on a three-dimensional spoiled gradient sequence (mid left) and as pale, hypertrophied and infiltrated, gyri on intraoperative photographs (mid right). Brain tissue specimens were sampled inside (Tu) and outside (Cx) macroscopic tumor infiltration. In areas outside visible tumor abnormalities (Cx) we detected only an infiltration by glioma cells (hematoxylin and eosin (HE) staining, x200). Tumor infiltration was obvious in tissue from areas of visible imaging tumor abnormalities (Tu; HE staining, x200). Scale, 100 μm. (B) Multiple extracellular recordings of interictal-like discharges (IIDs) from a slice containing both the solid tumor component and adjacent infiltrated neocortex. Electrode locations: Cx1, superficial neocortical layer; Cx2, mid neocortical layers, Tu, solid tumor tissue. Crtl shows a record from non-infiltrated neocortex in another control specimen. (C) The proportion from which IIDs were (black) or were not (white) detected, compared to history of seizures (29 patients), preoperative seizures control with antiepileptic drugs (22 patients), position with respect to structural abnormalities (81 slices; inside Vs outside regions of FLAIR hypersignal on MRI), tumor grade (81 slices; low-grade Vs high-grade), tumor infiltration (81 slices Vs control 14 slices), and indices (18 slices) of tumor core (n=4), high tumor infiltration (n=7) or low tumor infiltration by isolated tumor cells (n=7) from histopathological analyses. (D) Classical histolopathogical features of a glioma. The tumor mass (left), and regions with tumor infiltration (middle) and with isolated glioma cells (right) are shown with HE (upper) and Ki67 (lower) stains. Scales: 100 μm and 25 μm for the insets.
Figure 2
Figure 2. Interictal-like discharges are spatially restricted to superficial neocortical layers and are generated in multiple sites
(A) Extracellular records of interictal-like discharges (IIDs). They consist of bursts of multi-unit activity (MUA; > 300 Hz high pass filter) correlated with field potentials (FP, < 100 Hz low pass filter) (left). Expanded raw, MUA and FP traces at middle (middle). High frequency oscillations (HFOs; filtered to pass 250–350 Hz) are detected during IIDs (right). Time frequency plots (below) show a mean dominant frequency of 251±69 Hz (n=572 events). (B, C) Multiple extracellular records of IIDs from slices containing infiltrated neocortex. In B, four electrodes are placed at different depths of the same neocortical column. They show IIDs and HFOs were synchronous in a vertical column-like region with field onset, maximal amplitude and the largest HFO in layers III-IV. In C, four electrodes are placed in layers IIIIV at the same depth over a lateral distance of 1 mm. They show a spatially restricted lateral spread of IIDs and HFOs. HFOs were never detected in the absence of IIDs. (D) IIDs are initiated at multiple foci in infiltrated neocortex. Multiple records from a slice of infiltrated neocortex with four electrodes (el) located in layers III-IV at separations of: el1 – 1mm – el2 – 3mm – el3 – 1mm – el4. Expanded traces in the middle. (E) Mean±SD of the neocortical depth, lateral extent and propagation speed of IIDs in the recorded slices.
Figure 3
Figure 3. Interictal-like discharges pharmacology and cellular correlates
(A) Pharmacology of Interictal-like Discharges (IIDs). The NMDA receptor blocker D,L-APV (50 μM) did not modify extracellularly recorded IIDs, but they were suppressed by the AMPA receptor antagonist DNQX (20 μM) (left). The GABAA receptor antagonist Picrotoxin (50 μM) and gabazin (10 μM) reversibly blocked IIDs (right). (B) Cellular basis of IIDs. Spontaneous intracellular (upper) and extracellular (lower) records of neurons from infiltrated neocortex. Expanded traces of a single IID at right. An interneuron (top, black) fired before and during IID initiation. Some pyramidal cells were depolarized (middle, blue) others hyperpolarized during IIDs (bottom, red). (C) Timing of cellular firing during IIDs. Mean population field activity (IID FP; top) plotted against sequential raster traces and peri-event histogram of interneuron firing (Interneuron AP, and count). Raster traces and peri-event histogram for firing of an excited pyramidal cell (Pyramidal cell AP and count). Timing of the peak of depolarizing (blue) and hyperpolarizing PSPs (red). The time course of interneuron firing (black line), and the probability of depolarizing (red) and hyperpolarizing PSPs (blue) are shown in the lower box. (D) Hyperpolarizing interneurons with DAGO (10 μM), the opioid mu receptor agonist, reversibly suppressed IID field potentials.
Figure 4
Figure 4. Cl regulation impairment contributes to interictal-like discharges
(A) GABAA reversal potential (Vrev) in pyramidal cells. PSP amplitude during interictal-like discharges (IIDs) was measured in pyramidal cells of infiltrated neocortex maintained at different potentials. Records are shown (at the left) and plotted (at right) from one cell with a Vrev of – 71 mV (white arrow and plotted open squares) and another cell with Vrev values of – 48 mV (black arrow and plotted filled circle). (B) Correlation of Vrev and resting potential for 15 pyramidal cells. Reversal potentials were depolarizing with respect to rest in 9 cells (filled circles), above the diagonal line, and hyperpolarizing in 6 cells (open circles) below the line. The proportion of pyramidal cells depolarized by GABA during IIDs (black part of the histogram- Depol vs white part - Hyperpol) was significantly higher in tissues with tumor infiltration than in tissues with no infiltration (p=0.019, Fisher exact test). (C) Blocking the K-Cl cotransporter NKCC1 with bumetanide (8 μM) reversibly suppressed spontaneous IID field potentials. (D) Western blot for NKCC1 (left) and KCC2 (right) of both control (n=4) and glioma (n=7) human tissues. All results were normalized using beta III tubulin neuronal-specific marker. Histogram representing normalized NKCC1 protein quantification shows that NKCC1 is significantly increased in glioma samples as compared to controls (p=0.02). Histogram representing normalized KCC2 protein quantification shows that KCC2 is significantly decreased in glioma samples as compared to controls (p=0.04). (E) Illustrations of KCC2 immunoreactivity stained with NeuN marker. Left, the fluorescence is distributed along the plasma membrane (arrow head) of the cells in controls. Middle, in glioma sample, the distribution of KCC2 immunoreactivity in neurons of infiltrated neocortex is modified from membrane staining (open arrow head), staining in the cytoplasmic region (filled arrow head) to a loss of staining (open circle). Right, the quantification of KCC2 fluorescence repartition per cell shows a significant decrease of membrane staining (p=0.01) and a significant increase in the loss of staining in glioma samples (p=0.04), as compared to controls. Scale bar, 10 μm.
Figure 5
Figure 5. Ictal-like discharges generated in the human neocortex surrounding gliomas are preceded by a specific pre-ictal activity
(A) Extracellular records of an ictal-like discharge (ID) induced by exposure to 0.25 mM Mg2+ and 8 mM K+. Pre-ictal discharges (PIDs, black filled circles) recurred before seizure onset followed by rhythmic bursts. Multi-unit activity (MUA) and time frequency plot of the local field potential (LFP). (B) PIDs emerge during the transition to ictal-like activity in vitro. Extracellular records of the transition to ictal-like activity (0.25 mM Mg2+ and 8 mM K+). Amplitudes of field potentials during the transition show the emergence of larger PIDs, while amplitudes of interictal-like discharges (IIDs, open circles) did not change. Below: IIDs before convulsant application (left) and co-occurrence of PIDs and IIDs during the transition (right). (C) Differences in IID and PID field potentials. Amplitude distributions of all field potentials during the transition distinguish between IIDs and PIDs. Mean±SD of the amplitude, duration, frequency and lateral extent, of IIDs (white) and PIDs (black) at steady state. The amplitude, duration and lateral extent, but not frequency, were significantly different. (D) High frequency oscillations (HFO) occurring during IIDs (left, n=284 events) and PIDs (right, n=294 events). For each type of activity: top left: HFO recording (red trace) during a FP (black trace); bottom left HFO time frequency representation; top right: histogram of HFOs timing with respect to a population event (the mean frequency ±sd is indicated); bottom right: histogram of HFO frequency distribution during population event. Population FP onset is shown as a green dotted line. HFOs associated with IIDs possessed a narrow frequency spectrum and were restricted to the onset of an IID. HFOs during PIDs spanned the frequency spectrum and persisted throughout PIDs. (E) IIDs do not depend on GABAergic signaling. Extracellular record of IIDs and PIDs at steady state in a 0.25 mM Mg2+ and 8 mM K+ solution. The GABAA receptor antagonist picrotoxin (50 μM, for 30 min) reversibly blocked IIDs, but not PIDs
Figure 6
Figure 6. Dynamics of population activity at the initiation of ictal-like events
(A) Dual extracellular records during the initiation of a seizure-like event with seizure onset shown by a green dotted line. Interictal-like discharges (IIDs, open circles) and pre-ictal discharges (PIDs, filled circles) during the transition are shown above. PIDs are progressively recruited and recur before seizure onset. (B) Time delay and cross correlation of PIDs initiated at two distinct foci recorded by two electrodes. During seizure initiation, synchrony increased progressively and propagation delay between the two PID foci was reduced.

Similar articles

Cited by

References

    1. van Breemen MSM, Wilms EB, Vecht CJ. Epilepsy in patients with brain tumours: epidemiology, mechanisms, and management. Lancet neurology. 2007;6:421–430. - PubMed
    1. Pallud J, Capelle L, Huberfeld G. Tumoral epilepsy. How does it happen? Epilepsia. 2013 - PubMed
    1. Hirsch JF, Buisson-Ferey J, Sachs M, Hirsch JC, Scherrer J. [Electrocorticogram and unitary activites with expanding lesions in man] Electroencephalogr Clin Neurophysiol. 1966;21:417–428. - PubMed
    1. Berger MS, Ghatan S, Haglund MM, Dobbins J, Ojemann GA. Low-grade gliomas associated with intractable epilepsy: seizure outcome utilizing electrocorticography during tumor resection. Journal of Neurosurgery. 1993;79:62–69. - PubMed
    1. Haglund MM, Berger MS, Kunkel DD, Franck JE, Ghatan S, Ojemann GA. Changes in gamma-aminobutyric acid and somatostatin in epileptic cortex associated with low-grade gliomas. Journal of Neurosurgery. 1992;77:209–216. - PubMed

Publication types