

α(2A)-adrenergic receptors filter parabrachial inputs to the bed nucleus of the stria terminalis
- PMID: 25009265
- PMCID: PMC4087209
- DOI: 10.1523/JNEUROSCI.0822-14.2014
α(2A)-adrenergic receptors filter parabrachial inputs to the bed nucleus of the stria terminalis
Abstract
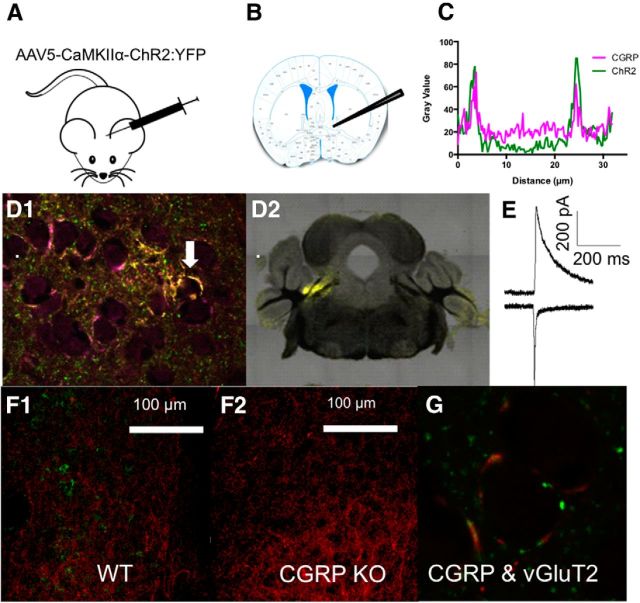
α2-adrenergic receptors (AR) within the bed nucleus of the stria terminalis (BNST) reduce stress-reward interactions in rodent models. In addition to their roles as autoreceptors, BNST α(2A)-ARs suppress glutamatergic transmission. One prominent glutamatergic input to the BNST originates from the parabrachial nucleus (PBN) and consists of asymmetric axosomatic synapses containing calcitonin gene-related peptide (CGRP) and vGluT2. Here we provide immunoelectron microscopic data showing that many asymmetric axosomatic synapses in the BNST contain α(2A)-ARs. Further, we examined optically evoked glutamate release ex vivo in BNST from mice with virally delivered channelrhodopsin2 (ChR2) expression in PBN. In BNST from these animals, ChR2 partially colocalized with CGRP, and activation generated EPSCs in dorsal anterolateral BNST neurons that elicited two cell-type-specific outcomes: (1) feedforward inhibition or (2) an EPSP that elicited firing. We found that the α(2A)-AR agonist guanfacine selectively inhibited this PBN input to the BNST, preferentially reducing the excitatory response in ex vivo mouse brain slices. To begin to assess the overall impact of α(2A)-AR control of this PBN input on BNST excitatory transmission, we used a Thy1-COP4 mouse line with little postsynaptic ChR2 expression nor colocalization of ChR2 with CGRP in the BNST. In slices from these mice, we found that guanfacine enhanced, rather than suppressed, optogenetically initiated excitatory drive in BNST. Thus, our study reveals distinct actions of PBN afferents within the BNST and suggests that α(2A)-AR agonists may filter excitatory transmission in the BNST by inhibiting a component of the PBN input while enhancing the actions of other inputs.
Keywords: adrenergic receptors; bed nucleus of the stria terminalis; excitatory transmission; extended amygdala; norephinephrine; optogenetics.
Copyright © 2014 the authors 0270-6474/14/349319-13$15.00/0.
Figures


Similar articles
-
Dorsal BNST α2A-Adrenergic Receptors Produce HCN-Dependent Excitatory Actions That Initiate Anxiogenic Behaviors.J Neurosci. 2018 Oct 17;38(42):8922-8942. doi: 10.1523/JNEUROSCI.0963-18.2018. Epub 2018 Aug 27. J Neurosci. 2018. PMID: 30150361 Free PMC article.
-
alpha2A-adrenergic receptors heterosynaptically regulate glutamatergic transmission in the bed nucleus of the stria terminalis.Neuroscience. 2009 Sep 29;163(1):339-51. doi: 10.1016/j.neuroscience.2009.06.022. Epub 2009 Jun 12. Neuroscience. 2009. PMID: 19527774 Free PMC article.
-
α2A-Adrenergic Receptor Activation Decreases Parabrachial Nucleus Excitatory Drive onto BNST CRF Neurons and Reduces Their Activity In Vivo.J Neurosci. 2019 Jan 16;39(3):472-484. doi: 10.1523/JNEUROSCI.1035-18.2018. Epub 2018 Nov 26. J Neurosci. 2019. PMID: 30478032 Free PMC article.
-
Optogenetic strategies to investigate neural circuitry engaged by stress.Behav Brain Res. 2013 Oct 15;255:19-25. doi: 10.1016/j.bbr.2013.05.007. Epub 2013 May 16. Behav Brain Res. 2013. PMID: 23684554 Free PMC article. Review.
-
Functional Dissection of Glutamatergic and GABAergic Neurons in the Bed Nucleus of the Stria Terminalis.Mol Cells. 2021 Feb 28;44(2):63-67. doi: 10.14348/molcells.2021.0006. Mol Cells. 2021. PMID: 33594012 Free PMC article. Review.
Cited by
-
PACAP orchestration of stress-related responses in neural circuits.Peptides. 2021 Aug;142:170554. doi: 10.1016/j.peptides.2021.170554. Epub 2021 Apr 15. Peptides. 2021. PMID: 33865930 Free PMC article. Review.
-
Dorsal BNST α2A-Adrenergic Receptors Produce HCN-Dependent Excitatory Actions That Initiate Anxiogenic Behaviors.J Neurosci. 2018 Oct 17;38(42):8922-8942. doi: 10.1523/JNEUROSCI.0963-18.2018. Epub 2018 Aug 27. J Neurosci. 2018. PMID: 30150361 Free PMC article.
-
The bed nucleus of the stria terminalis in drug-associated behavior and affect: A circuit-based perspective.Neuropharmacology. 2017 Aug 1;122:100-106. doi: 10.1016/j.neuropharm.2017.03.028. Epub 2017 Mar 27. Neuropharmacology. 2017. PMID: 28351600 Free PMC article. Review.
-
Danger and distress: Parabrachial-extended amygdala circuits.Neuropharmacology. 2021 Oct 15;198:108757. doi: 10.1016/j.neuropharm.2021.108757. Epub 2021 Aug 27. Neuropharmacology. 2021. PMID: 34461068 Free PMC article. Review.
-
Long-Term Effects of Repeated Social Defeat Stress on Brain Activity during Social Interaction in BALB/c Mice.eNeuro. 2022 May 3;9(3):ENEURO.0068-22.2022. doi: 10.1523/ENEURO.0068-22.2022. Print 2022 May-Jun. eNeuro. 2022. PMID: 35437264 Free PMC article.
References
-
- Brown SA, Vik PW, Patterson TL, Grant I, Schuckit MA. Stress, vulnerability and adult alcohol relapse. J Stud Alcohol. 1995;56:538–545. - PubMed
Publication types
MeSH terms
Substances
Grants and funding
- F30DA034428/DA/NIDA NIH HHS/United States
- RR000165/RR/NCRR NIH HHS/United States
- DK58404/DK/NIDDK NIH HHS/United States
- P30 DK058404/DK/NIDDK NIH HHS/United States
- P51 RR000165/RR/NCRR NIH HHS/United States
- EY08126/EY/NEI NIH HHS/United States
- P30 CA068485/CA/NCI NIH HHS/United States
- CA68485/CA/NCI NIH HHS/United States
- DK20593/DK/NIDDK NIH HHS/United States
- U24 DK059637/DK/NIDDK NIH HHS/United States
- DA019113/DA/NIDA NIH HHS/United States
- P30 EY008126/EY/NEI NIH HHS/United States
- F30 DA034428/DA/NIDA NIH HHS/United States
- T32 GM007347/GM/NIGMS NIH HHS/United States
- DK59637/DK/NIDDK NIH HHS/United States
- P30 DK020593/DK/NIDDK NIH HHS/United States
LinkOut - more resources
Full Text Sources
Other Literature Sources
Molecular Biology Databases
Research Materials
Miscellaneous