Comparative Study
. 2014 Jul 9;34(28):9418-31.
doi: 10.1523/JNEUROSCI.0401-14.2014.

Differential GABAergic and glycinergic inputs of inhibitory interneurons and Purkinje cells to principal cells of the cerebellar nuclei

Affiliations
Comparative Study

Differential GABAergic and glycinergic inputs of inhibitory interneurons and Purkinje cells to principal cells of the cerebellar nuclei

Zoé Husson et al. J Neurosci. .

Abstract

The principal neurons of the cerebellar nuclei (CN), the sole output of the olivo-cerebellar system, receive a massive inhibitory input from Purkinje cells (PCs) of the cerebellar cortex. Morphological evidence suggests that CN principal cells are also contacted by inhibitory interneurons, but the properties of this connection are unknown. Using transgenic, tracing, and immunohistochemical approaches in mice, we show that CN interneurons form a large heterogeneous population with GABA/glycinergic phenotypes, distinct from GABAergic olive-projecting neurons. CN interneurons are found to contact principal output neurons, via glycine receptor (GlyR)-enriched synapses, virtually devoid of the main GABA receptor (GABAR) subunits α1 and γ2. Those clusters account for 5% of the total number of inhibitory receptor clusters on principal neurons. Brief optogenetic stimulations of CN interneurons, through selective expression of channelrhodopsin 2 after viral-mediated transfection of the flexed gene in GlyT2-Cre transgenic mice, evoked fast IPSCs in principal cells. GlyR activation accounted for 15% of interneuron IPSC amplitude, while the remaining current was mediated by activation of GABAR. Surprisingly, small GlyR clusters were also found at PC synapses onto principal CN neurons in addition to α1 and γ2 GABAR subunits. However, GlyR activation was found to account for <3% of the PC inhibitory synaptic currents evoked by electrical stimulation. This work establishes CN glycinergic neurons as a significant source of inhibition to CN principal cells, forming contacts molecularly distinct from, but functionally similar to, Purkinje cell synapses. Their impact on CN output, motor learning, and motor execution deserves further investigation.

Keywords: cerebellar nuclei; glycinergic; immunohistochemistry; interneurons; mixed inhibition; optogenetics.


Figures

Figure 1.
Figure 1.
Method for colocalization quantification in confocal Z-stacks. A, To quantify the colocalization rate between two markers, for example GlyT2 (red fluorescence signal) over GFP varicosities (green fluorescence signal), GlyT2+ varicosities are detected in stacks and converted as a binary mask. B, C, This mask is used to retrieve mean GFP intensities below each immunoreactive aggregate in the original GFP stack (B, original distribution in solid red line) and in a flipped GFP stack (C, random distribution in black solid line). D, This latter distribution is scaled to the original distribution (black dashed line). E, The difference between the original distribution and the scaled randomized distribution provides an underestimate of true colocalization (orange).
Figure 2.
Figure 2.
Transgenic mice as tools to study glycinergic interneurons in cerebellar nuclei. A, Coronal slice of the CN in the GlyT2-eGFP mouse. Arrows indicate GlyT2-eGFP+ cells within the three cerebellar nuclei (medial, interposed, and lateral nuclei). B, Coronal slice of cerebellar nuclei (medial, interposed, and lateral) in a GlyT2-Cre × Rosa26-loxed-mTmG mouse. Note the abundance of GFP+ cells (solid arrows) compared with the GlyT2-eGFP mouse. Ca, Cb, Costaining of GlyT2-eGFP+ neurons with VIAAT (red) allows distinguishing between local axonal varicosities (solid arrows) and VIAAT-immunonegative dendrites (dashed arrows). Z-thickness of projection: Ca, 8.8 μm; Cb, 2 μm. D, GlyT2 costaining of the GlyT2-eGFP mouse reveals that only a fraction of GlyT2+ profiles colocalize with GFP (solid arrows), whereas a majority do not colocalize (dashed arrows). Z-thickness of projection, 1.7 μm. E, Near-complete colocalization is found in the GlyT2-Cre × Rosa26-loxed-mTmG mouse. Z-thickness of projection, 1.7 μm. F, In the GlyT2-eGFP mouse, distribution histograms of GFP intensities under GlyT2+ profiles (red) and spatially randomized profile distribution (black; see Materials and Methods and Fig. 1) yield an estimate of colocalization of GlyT2+ profiles with GFP-positive profiles of 40% (orange area). G, In the Rosa26-loxed-mTmG × GlyT2-Cre mouse, at least 89% of GlyT2+ varicosities were colocalized with GFP+ profiles. H, Inferior olive coronal sections in the GlyT2-Cre × Rosa26-loxed-mTmT mouse. Ha, In the cerebellar nuclei of the GlyT2-Cre × Rosa26-loxed-mTmT mouse, small nucleo-olivary cells are stained and are particularly visible in the ventral part of the nuclei (solid arrowheads). Hb, Faint labeling of the axons of nucleo-olivary cells is visible in the inferior olive of the GlyT2-Cre × Rosa26-loxed-mTmT mouse, particularly in the dorsal subnucleus (Z-thickness of projection, 32 μm). I, In the GlyT2-eGFP mouse, the nucleo-olivary neuron somata were not visible in the cerebellar nuclei (Ia), while virtually no axonal projections were seen in the inferior olive (Ib). Z-thickness of projection, 32 μm. Scale bars: A, B, Ha, Hb, Ia, Ib, 200 μm; Ca, D, E, 10 μm; Cb, 5 μm; Ia, Ib inset, 100 μm; Ha, Hb inset, 50 μm. IOD, Dorsal nucleus of inferior olive; IOPr, principal nucleus of inferior olive, Py, pyramidal tract.
Figure 3.
Figure 3.
CN interneurons constitute a population distinct from inferior olive-projecting neurons and present mixed GABAergic-glycinergic phenotypes. A, Bright-field image of a coronal slice of the inferior olive in a GlyT2-eGFP mouse injected with red fluorescent retrograde beads. B, In the CN, retrolabeled cells (red; solid arrows) were not GlyT2-eGFP-positive (green) and do not exhibit GABA staining (blue) at their soma (see inset). Z-thickness of projection, 26 μm. C, In the GlyT2-eGFP mouse, some GFP-positive neurons (green) are found costained for GABA (red). D, In a Rosa26-loxed-mTmT × GlyT2-Cre mouse, all neurons stained for GABA (red) at their somata are mTmT-positive (green), whereas some mTmT-positive neurons do not show GABA staining. Ea–Ed, In the GlyT2-eGFP mouse, the mixed GABAergic/glycinergic phenotype of most glycinergic neurons, whether eGFP positive (green) or not, is confirmed by costaining of GlyT2 axonal varicosities (blue) with GAD65–67 (red). Z-thickness, 1.7 μm. IOM, Medial nucleus of inferior olive; IOD, dorsal nucleus of inferior olive; IOPr, principal nucleus of inferior olive. Scale bars: A, 50 μm; B–D, 20 μm; E, 10 μm; B inset, 10 μm; E close-ups a–d (right), 2 μm.
Figure 4.
Figure 4.
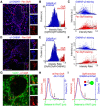
Different types of postsynaptic inhibitory receptor clusters in the CN. A, Costaining for the γ2 subunit of GABAR (blue) and pan-GlyR subunits (red) reveals two main populations of clusters. Z-thickness of projection, 8 μm. B, Example of intensity ratio histogram between the GlyR signal and the sum of the GlyR and GABAR signals in all clusters of one stack. The histogram exhibits a bimodal distribution that allow us to distinguish between GABAR-γ2-enriched clusters (blue bins) and GlyR-enriched clusters (red bins). C, Plot of GABAR-γ2 and pan-GlyR intensities (in arbitrary units, a.u.), as a function of the intensity ratio. The smoothed average over the 2495 clusters detected is represented (black lines, mean ± SD), showing the decreasing and increasing intensity trends for GABAR-γ2 and GlyR clusters, respectively. D–F, Similar observations are obtained with costaining for GABAR-α1 subunit (blue) and pan-GlyR (red; n = 2088 detected clusters). G, GlyR α1 subunit immunoreactivity (red) is found on somata of presumptive principal CN cells and clusters are seen apposed to VIAAT-positive varicosities (green). Z-thickness of projection, 8 μm. H, The distribution of distances reveals that the majority of both pan-GlyR (red line) and α1-GlyR (blue line) clusters are found within 1 μm from VIAAT-positives varicosities. I, Similarly, both GlyR-enriched (red line) and GABAR-enriched (blue line) clusters are located within a distance of 1 μm from the VIAAT-positive element. Scale bars: A, D, G, 10 μm; A, D, G close-ups (right), 2 μm.
Figure 5.
Figure 5.
GABAR-enriched clusters and GlyR-enriched clusters are located on principal neurons and face Purkinje cell varicosities and GlyT2+ profiles, respectively. A, GlyR-enriched clusters are found in front of GlyT2+ varicosities (white arrowheads) as shown in costaining for pan-GlyR (red), GABAR-γ2 (blue), and GlyT2 (green). Z-thickness of projection, 8.3 μm. B, C, Analysis of distance distributions to the closest GlyT2-positive varicosities (red lines) reveals that 59.3 ± 8.5% of GlyR-enriched clusters are found at <0.6 μm from a varicosity, whereas distribution of distances for GABAR-enriched clusters (blue line) was not different from randomized data (black lines). D, E, Nonapposed GlyR-enriched clusters have lower intensities (summed GlyR+GABAR) than apposed clusters (Wilcoxon test, p ≪ 0.01). F, Costaining for pan-GlyR (red) and GABAR-γ2 (blue) in a L7-ChR2-YFP (green) mouse reveals appositions between L7-positive Purkinje cell terminals and GABAR-enriched, but not GlyR-enriched, clusters (white arrowheads). Z-thickness of projection, 1.2 μm. G, Costaining for pan-GlyR (red) and GABAR-γ2 (blue) in a Thy1-ChR2-YFP (green) mouse, in which CN principal cells exhibit YFP staining at the membrane. Z-thickness of projection, 0.51 μm. H, I, Colocalization analysis as previously described (Fig. 2E) reveals that >88% of GABAR-γ2-enriched clusters and >59% for GlyR-enriched clusters are colocalized with YFP, indicating that they are located on principal cells. Scale bars: A, B, G, 10 μm.
Figure 6.
Figure 6.
Isolation of a small glycinergic component at Purkinje cell synapses onto principal cells. A, Example of averaged synaptic responses elicited by electrical stimulation of Purkinje cell axons in the white matter surrounding the CN and recorded in CN principal neurons in the presence of blockers of glutamate receptors (50 μm d-APV and 10 μm NBQX). Strychnine (300 nm, 1 μm) and gabazine (300 nm) were successively applied in the bath, resulting in reduction of the peak amplitude. B, Percentage of block by strychnine 300 nm and 1 μm and by gabazine 300 nm relative to the initial response amplitude (n = 10, 8, and 7 cells, respectively). C, Application of gabazine 300 nm reduced the peak amplitude by 81.4 ± 8.6% (n = 10 cells) and was used to enrich the responses in glycinergic component by increasing the glycinergic fraction in the remaining component. D, E, Block of the remaining current by subsequent application of 300 nm and 1 μm strychnine (n = 6 and 8 cells, respectively).
Figure 7.
Figure 7.
Mixed inhibition at CN interneuron synapses on principal cells. Aa, Coronal slice of cerebellum from a GlyT2-Cre mouse injected bilaterally into the CN with a flexed virus expressing ChR2-YFP. Ab, After 3 weeks of infection, GlyT2-expressing neurons exhibit ChR2-YFP staining at their membrane. B, Histogram of the peak amplitude of the synaptic currents evoked by 1 ms optogenetic stimulation of the CN glycinergic neurons and recorded in CN principal neurons (n = 43 cells). C, Example of averaged synaptic currents recorded in the presence of blockers of excitation (50 μm d-APV and 10 μm NBQX) and of their block by successive application of strychnine and gabazine. D, Summary of the sensitivity of the synaptic currents to strychnine 300 nm and 1 μm (n = 13 and 14 cells, respectively; Wilcoxon test paired, n = 10 paired cells, p = 0.0019) and gabazine 300 nm (97.0 ± 2.3% block relative to initial response amplitude, n = 7 cells). E, Example of average responses (in the presence of 50 μm d-APV and 10 μm NBQX) when reverse pharmacology was performed. Gabazine 300 nm was applied before 300 nm strychnine and blocked 76.7 ± 10.9% of the control amplitude (n = 11 cells). F, Percentage of block by strychnine 300 nm relative to the remaining current after application of 300 nm gabazine (n = 11 cells). G, Glycinergic component of the initial response was assessed by the following formula: [(Amplitude after 300 nm gabazine − Amplitude after 300 nm gabazine and 300 nm strychnine)/Amplitude of the initial response]. This glycinergic component is higher at the interneuronal synapse than at the Purkinje cell synapse (n = 11 and 6 cells, respectively; Wilcoxon test p = 0.02731). Scale bars: Aa, 500 μm; Ab, 50 μm. Cb Cx, Cerebellar cortex.

Similar articles

Cited by

References

    1. Aizenman CD, Manis PB, Linden DJ. Polarity of long-term synaptic gain change is related to postsynaptic spike firing at a cerebellar inhibitory synapse. Neuron. 1998;21:827–835. doi: 10.1016/S0896-6273(00)80598-X. - DOI - PubMed
    1. Araki T, Sato M, Kiyama H, Manabe Y, Tohyama M. Localization of GABAA-receptor gamma 2-subunit mRNA-containing neurons in the rat central nervous system. Neuroscience. 1992;47:45–61. doi: 10.1016/0306-4522(92)90119-M. - DOI - PubMed
    1. Bagnall MW, Zingg B, Sakatos A, Moghadam SH, Zeilhofer HU, du Lac S. Glycinergic projection neurons of the cerebellum. J Neurosci. 2009;29:10104–10110. doi: 10.1523/JNEUROSCI.2087-09.2009. - DOI - PMC - PubMed
    1. Balakrishnan V, Kuo SP, Roberts PD, Trussell LO. Slow glycinergic transmission mediated by transmitter pooling. Nat Neurosci. 2009;12:286–294. doi: 10.1038/nn.2265. - DOI - PMC - PubMed
    1. Bäurle J, Grüsser-Cornehls U. Differential number of glycine- and GABA-immunopositive neurons and terminals in the deep cerebellar nuclei of normal and Purkinje cell degeneration mutant mice. J Comp Neurol. 1997;382:443–458. doi: 10.1002/(SICI)1096-9861(19970616)382:4<443::AID-CNE2>3.0.CO;2-2. - DOI - PubMed

Publication types

LinkOut - more resources