. 2014 Jul 9;34(28):9455-72.
doi: 10.1523/JNEUROSCI.4699-13.2014.

Huntingtin is required for normal excitatory synapse development in cortical and striatal circuits

Affiliations

Huntingtin is required for normal excitatory synapse development in cortical and striatal circuits

Spencer U McKinstry et al. J Neurosci. .

Abstract

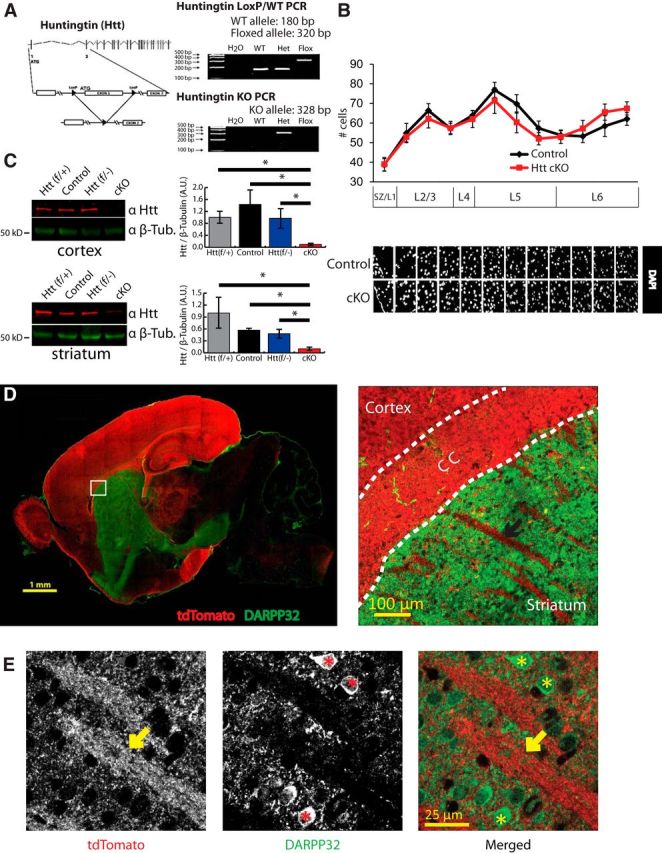
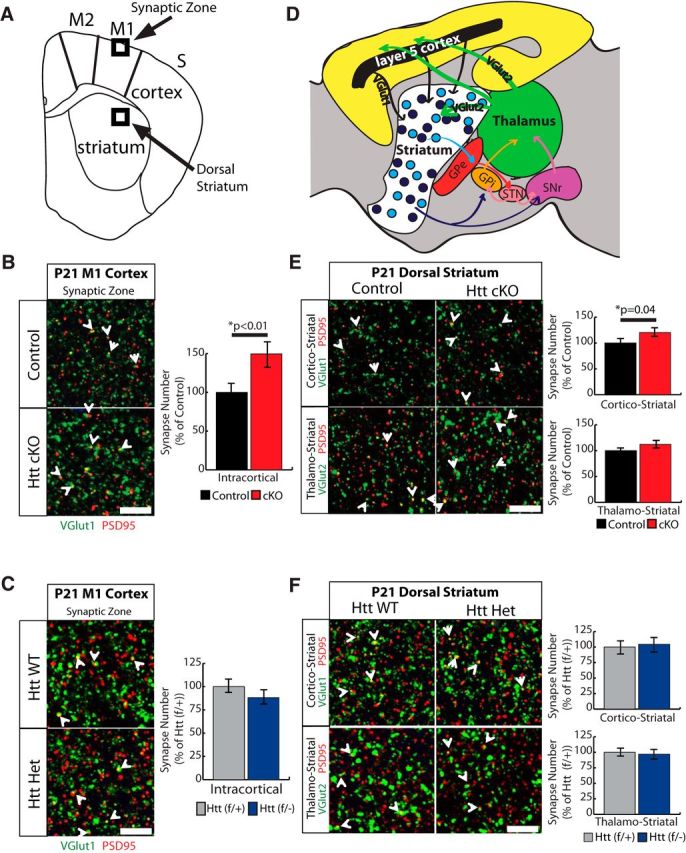
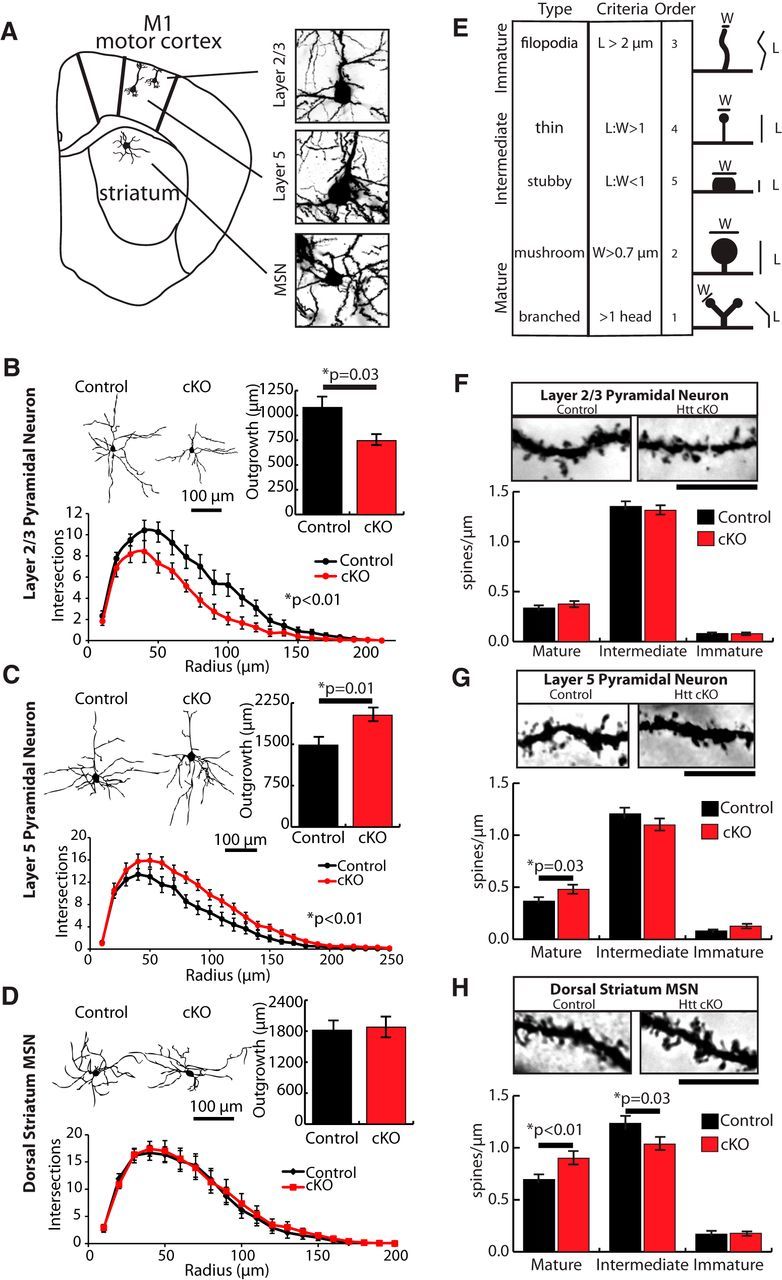
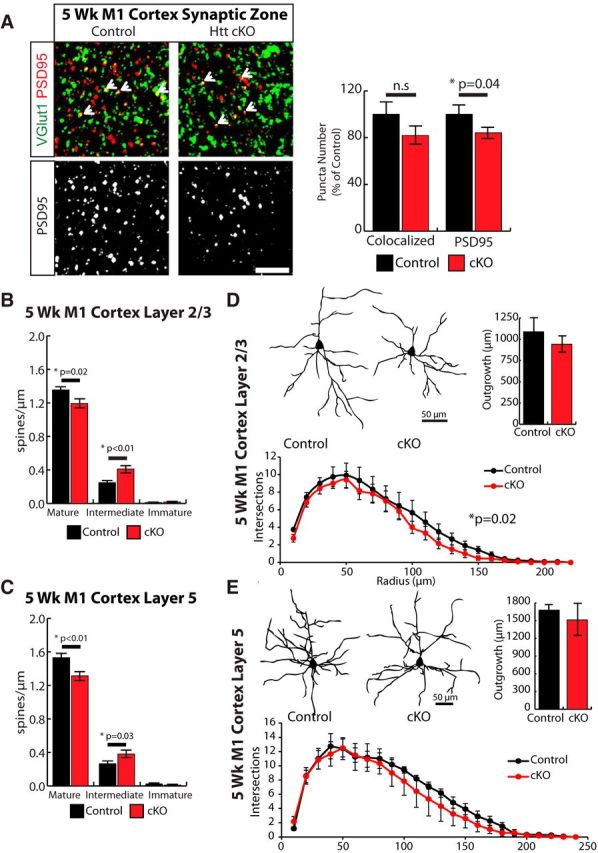
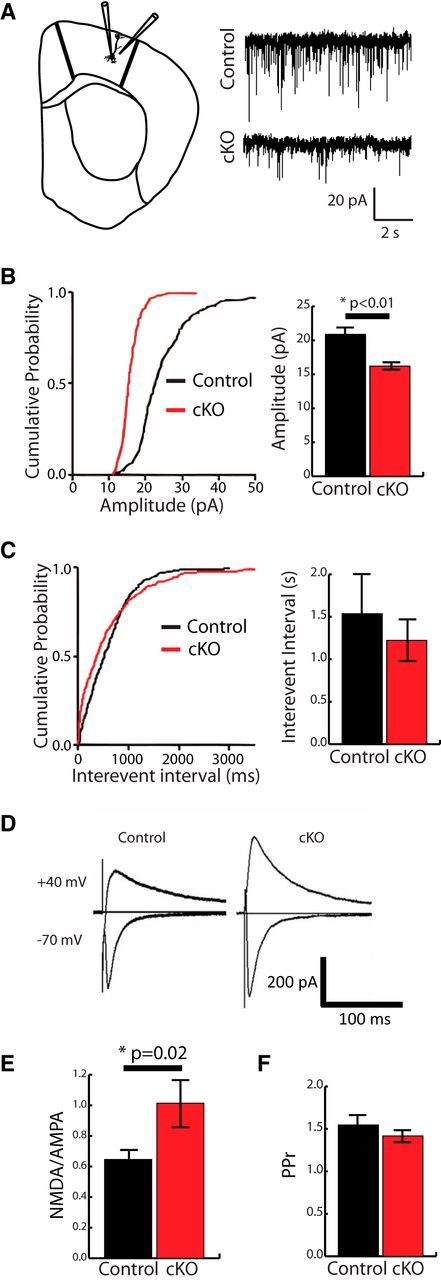
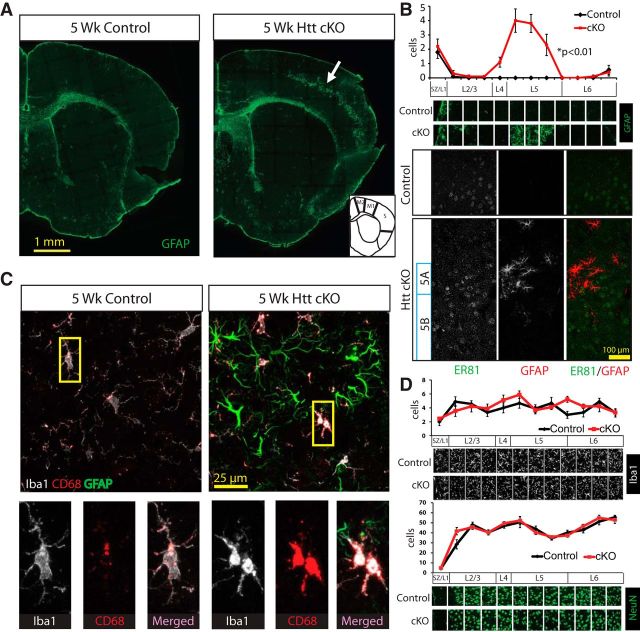
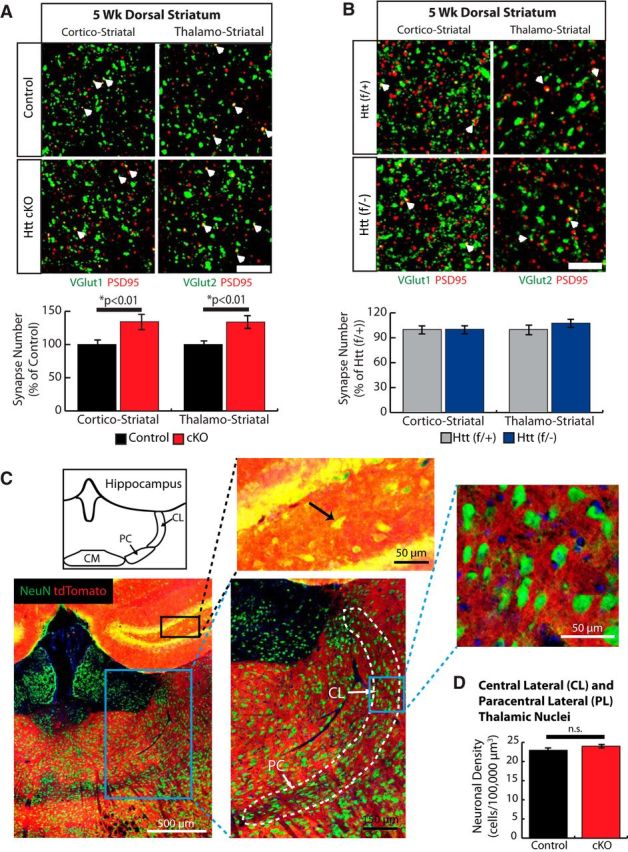
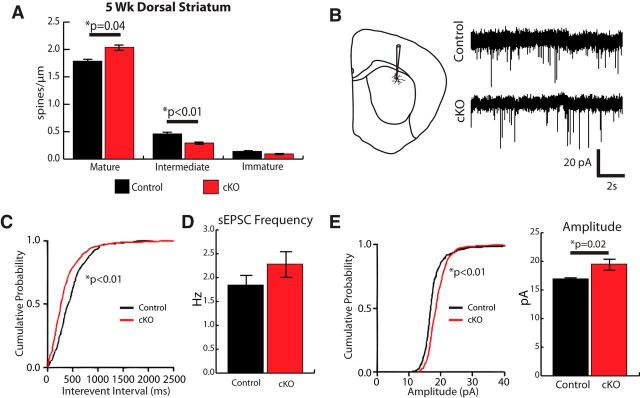
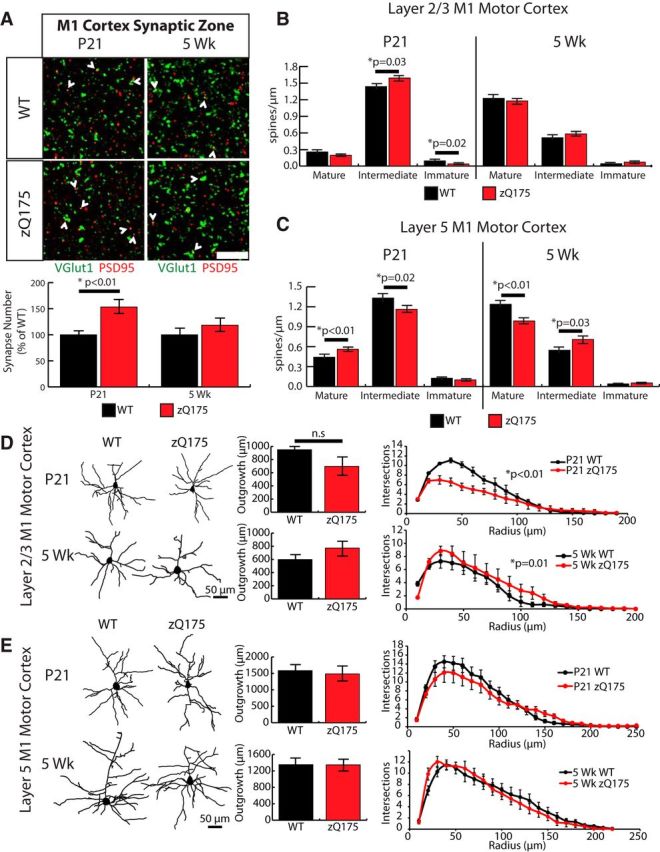
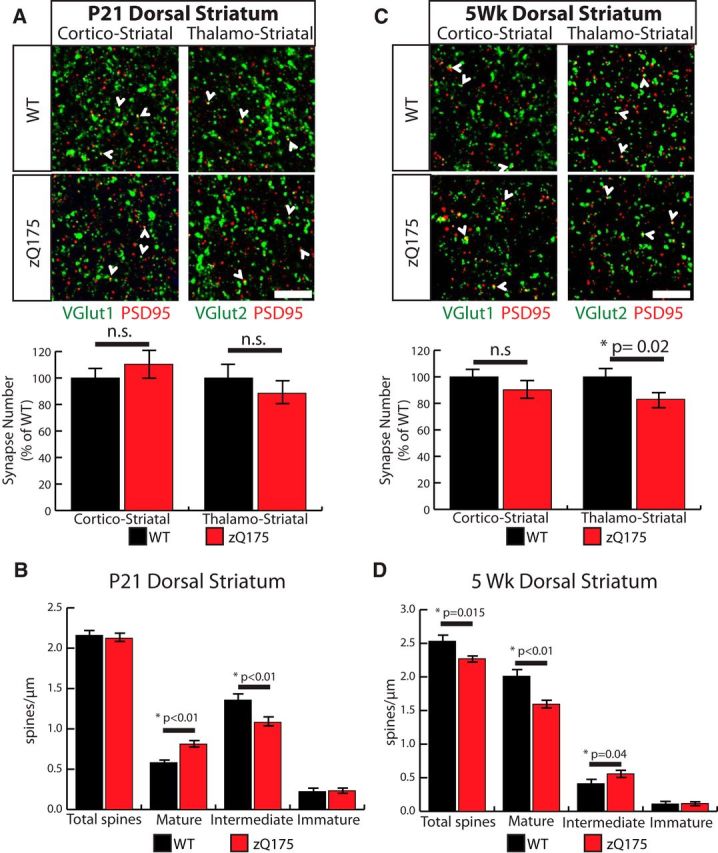
Huntington's disease (HD) is a neurodegenerative disease caused by the expansion of a poly-glutamine (poly-Q) stretch in the huntingtin (Htt) protein. Gain-of-function effects of mutant Htt have been extensively investigated as the major driver of neurodegeneration in HD. However, loss-of-function effects of poly-Q mutations recently emerged as potential drivers of disease pathophysiology. Early synaptic problems in the excitatory cortical and striatal connections have been reported in HD, but the role of Htt protein in synaptic connectivity was unknown. Therefore, we investigated the role of Htt in synaptic connectivity in vivo by conditionally silencing Htt in the developing mouse cortex. When cortical Htt function was silenced, cortical and striatal excitatory synapses formed and matured at an accelerated pace through postnatal day 21 (P21). This exuberant synaptic connectivity was lost over time in the cortex, resulting in the deterioration of synapses by 5 weeks. Synaptic decline in the cortex was accompanied with layer- and region-specific reactive gliosis without cell loss. To determine whether the disease-causing poly-Q mutation in Htt affects synapse development, we next investigated the synaptic connectivity in a full-length knock-in mouse model of HD, the zQ175 mouse. Similar to the cortical conditional knock-outs, we found excessive excitatory synapse formation and maturation in the cortices of P21 zQ175, which was lost by 5 weeks. Together, our findings reveal that cortical Htt is required for the correct establishment of cortical and striatal excitatory circuits, and this function of Htt is lost when the mutant Htt is present.

Keywords: corticostriatal connections; excitatory synapses; huntingtin; reactive gliosis; synapse maturation; synaptogenesis.


Figures

Figure 1.
Figure 1.
Conditional silencing of Htt expression in the cortex. A, Genotyping strategy to identify Htt(flox/+) and Htt(flox/−) mice. B, Total cell count of the M1 motor cortex at P21 using DAPI staining (3 images/mouse, 3 mice/genotype). Cortical layers indicated. SZ, Synaptic zone (also known as layer 1). Two-way ANOVA and one-tailed, homoscedastic t test was used. Error bars indicate mean ± SEM. C, Western blot analysis of total Htt protein levels in the motor and somatosensory cortices and striata of cKO mice. Brain lysates from three P21 mice per genotype were used. Htt levels were normalized to loading control β-tubulin. Htt and tubulin signals are from the same gel. Htt protein runs at ∼350 kDa. Htt (f/+) (WT) = Htt(flox/+). Control = Htt(flox/+); Emx1-cre(TG/0). Htt (f/−) (heterozygous) = Htt(flox/−). cKO = Htt(flox/−); Emx1-cre(TG/0). D, Emx1-Cre is expressed in the cortex, hippocampus, and olfactory bulb. Region-specific Cre expression was verified by breeding Emx1-Cre mice with Cre reporter mice, ROSA(STOP)loxPtdTomato. Inlay, Cre expression (td-tomato signal) is localized to cell bodies within the cortex, hippocampus, and olfactory bulb. td-tomato-positive axonal tracks (arrow) innervate the striatum. CC, Corpus callosum. E, High-magnification images in the dorsal striatum of the reporter mice revealed that td-tomato-positive axonal tracks (arrow) do not colocalize with DARPP32-positive MSN cell bodies (*).
Figure 2.
Figure 2.
Loss of Htt in the cortex leads to an increase in excitatory synapse formation in the cortex and striatum at P21. A, Coronal brain diagram indicating the regions of interest for analyses of synaptic puncta number. B, Left, Immunostaining of M1 motor cortex synaptic zone with presynaptic marker VGlut1 (green) and postsynaptic marker PSD95 (red). Right, Quantification of number of VGlut1-PSD95 colocalized synaptic puncta. Error bars indicate mean ± SEM. C, Left, Immunostaining of M1 motor cortex synaptic zone of Htt (f/+) and Htt (f/−) mice with presynaptic marker VGlut1 (green) and postsynaptic marker PSD95 (red). Right, Quantification of number of VGlut1-PSD95 colocalized synaptic puncta. D, Schematic representation of corticostriatal and thalamostriatal connectivity and feedback loops. Corticostriatal synapses contain presynaptic VGlut1, and thalamostriatal synapses contain presynaptic VGlut2. GPe, External globus pallidus; GPi, internal globus pallidus; STN, subthalamic nucleus; SNr, substantia nigra. E, Left, Immunostaining of dorsal striatum with postsynaptic marker PSD95 (red) and either VGlut1 (cortical) or VGlut2 (thalamic) as presynaptic marker (green). Scale bar, 10 μm. Right, Quantification of colocalized puncta number. Error bars indicate mean ± SEM. F, Left, Immunostaining of dorsal striatum of Htt (f/+) and Htt (f/−) mice with postsynaptic marker PSD95 (red) and either VGlut1 (cortical) or VGlut2 (thalamic) as presynaptic marker (green). Right, Quantification of colocalized puncta number. B, C, E, F, Some of the colocalized synaptic puncta are marked with white arrows. Scale bar, 10 μm. Error bars indicate mean ± SEM.
Figure 3.
Figure 3.
Loss of cortical Htt alters dendritic outgrowth and accelerates spine maturation in both the cortex and striatum at P21. A, Coronal brain diagram indicating the regions of interest and the types of neurons that were analyzed. B–D, Representative traces, quantification of basal dendritic outgrowth, and Sholl analysis of cortical pyramidal neurons in (B) layer 2/3, (C) layer 5, and (D) MSNs of the dorsal striatum (12 cells/animal, 3 animals/genotype). Error bars indicate mean ± SEM (ANCOVA). E, Classification method and categorization criteria for Golgi-Cox-stained dendritic spine types. Ten micrometer stretches of dendrites were analyzed for spine number and type. F–H, Representative dendrite stretches and quantification of dendritic spine density of cortical pyramidal neurons in (F) layer 2/3, (G) layer 5, and (H) MSNs of the dorsal striatum (15 dendrites/animal for F, G; 12 dendrites/animal for H; 3 animals/genotype) Error bars indicate mean ± SEM (ANCOVA). Scale bar, 10 μm.
Figure 4.
Figure 4.
Loss of Htt in the cortex leads to structural immaturity of intracortical synapses in 5-week-old mice. A, Immunostaining of the synaptic zone in M1 motor cortex with presynaptic marker VGlut1 (green) and postsynaptic marker PSD95 (red) shows colocalized synaptic puncta (white arrows) in control and Htt cKO 5-week-old mice. Scale bars, 10 μm. Right, Quantification of colocalized and PSD95 puncta number. Error bars indicate mean ± SEM. n.s, Not significant. Quantification of dendritic spine density in cortical layer 2/3 (B) and layer 5 (C) pyramidal neurons. Representative traces, quantification of basal dendritic outgrowth, and Sholl analysis of cortical pyramidal neurons in layer 2/3 (D) and layer 5 (E) (12 cells/animal, 3 animals/genotype). Error bars indicate mean ± SEM (ANCOVA).
Figure 5.
Figure 5.
Loss of cortical Htt leads to weakened synaptic activity in the layer 5 pyrimidal neurons at 5 weeks. A, Electrophysiological recordings from layer 5 pyramidal neurons for sEPSCs (Control n = 17; cKO n = 13). B, Amplitude of excitatory currents decreases in Htt cKO (Student's t test). C, Interevent interval is not significantly different between genotypes (Student's t test). D, Electrophysiological recordings of evoked EPSCs (eEPSCs) from layer 5 pyramidal neurons were used to determine the NMDA/AMPA ratio (E) and paired pulse ratio (PPr) (F) (Control n = 18, cKO n = 14). NMDA to AMPA ratio is significantly higher in Htt cKOs. Error bars indicate mean ± SEM. *p < 0.05 (t test.).
Figure 6.
Figure 6.
Loss of cortical Htt leads to region- and layer-specific reactive gliosis in the cortex at 5 weeks. A, Coronal sections from 5-week-old Control and Htt cKO mice stained with GFAP to identify reactive astrocytes. Inlay, Cortical motor (M1 and M2) and somatosensory (S) regions of the cortex. B, Top, Quantification of cells stained by GFAP. Significant increase in number of GFAP-positive cells corresponds to layer 5 of the cortex (3 images/mouse, 3 mice/genotype). Error bars indicate mean ± SEM. Two-way ANOVA: p = 3.13 × 10⁻⁵. Bottom, Immunostaining of ER81 (green), a layer 5 marker, and GFAP (red) shows overlapping expression. C, Immunostaining of GFAP (green), CD68 (red), and Iba1 (white) shows increased CD68 staining of microglia (Iba1) in the GFAP band of reactive astrocytes in Htt cKO mice. D, Quantification of microglia (Iba1) and neurons (NeuN) shows no significant change in number or distribution at 5 weeks of age (3 images/mouse, 3 mice/genotype, two-way ANOVA). Error bars indicate mean ± SEM. *p < 0.05.
Figure 7.
Figure 7.
Loss of Htt in the cortex leads to increased synapse formation in the dorsal striatum at 5 weeks. A, Top, Immunostaining of dorsal striatum of Control and Htt cKO mice with postsynaptic marker PSD95 (red) and either VGlut1 (cortical) or Vglut2 (thalamic) as a presynaptic marker (green) shows colocalized synaptic puncta (white arrows) in Control and Htt cKO at 5 weeks of age. Scale bars, 10 μm. Bottom, Quantification of colocalized puncta number. B, Top, Immunostaining of dorsal striatum of Htt (f/+) and Htt (f/−) mice with postsynaptic marker PSD95 (red) and either VGlut1 (cortical) or Vglut2 (thalamic) as a presynaptic marker (green). White arrows indicate colocalized synaptic puncta. Scale bars, 10 μm. Bottom, Quantification of colocalized puncta number. C, Emx1-Cre is not expressed in the thalamic neurons of the CL and PL nuclei that project to the dorsal striatum. Specific Cre expression was verified by breeding Emx1-Cre mice with Cre reporter mice, ROSA(STOP)loxPtdTomato. Top inlay, Td-tomato signal colocalized with NeuN-labeled neurons (black arrow) in the hippocampus. Right inlay, NeuN-labeled neurons in the CL and PL do not colocalize with the Td-tomato signal, indicating that they do not express Cre. D, Quantification of neuronal density within the CL and PL (4 images/mouse, 3 mice/genotype). Error bars indicate mean ± SEM. t test. n.s, Not significant.
Figure 8.
Figure 8.
Enhanced excitatory synaptic activity of the medium spiny neurons in 5-week-old Htt cKOs. A, Quantification of dendritic spine density in MSNs in the dorsal striatum at 5 weeks of age. B, Electrophysiological recordings of spontaneous EPSC from MSNs in the dorsal striatum of Htt cKO and Control mice. C, The cumulative probability of interevent intervals is increased (Kolmogorov–Smirnov test). D, The mean frequency of sEPSCs is not significantly different (t test). E, sEPSC amplitude is increased in Htt cKO mice. Error bars indicate mean ± SEM. *p < 0.05 (t test).
Figure 9.
Figure 9.
HD model zQ175 mice have defects in synapse formation and maturation similar to Htt cKO mice in the cortex. A, Top, Immunostaining of M1 motor cortex synaptic zone with the presynaptic marker Vglut1 (green) and postsynaptic marker PSD95 (red) shows colocalized synaptic puncta (white arrows) in WT and zQ175 at P21 and 5-week-old mice. Scale bars, 10 μm. Bottom, Quantification of colocalized VGlut1 and PSD95 puncta (t test). B, Quantification of dendritic spine density in the layer 2/3 cortex at P21 and 5 weeks. C, Quantification of dendritic spine density in the layer 5 cortex at P21 and 5 weeks. Error bars indicate mean ± SEM. D, Representative traces, quantification of dendritic outgrowth, and Sholl analysis of cortical pyramidal neurons in layer 2/3. E, Layer 5 from P21 (top) and 5-week-old (bottom) zQ175 and WT mice (12 cells/animal, 3 animals/genotype). Error bars indicate mean ± SEM (ANCOVA method).
Figure 10.
Figure 10.
Synapse development is disrupted in the striata of zQ175 mice, and synapse loss is present. A, Immunostaining of P21 dorsal striatum with the postsynaptic marker PSD95 (red), and either VGlut1 (cortical) or Vglut2 (thalamic) as a presynaptic marker (green) shows colocalized synaptic puncta (white arrows) in WT and zQ175 mice at P21. Bottom, Quantification of colocalized puncta number. B, Quantification of dendritic spine density in MSN in the dorsal striatum at P21. C, Immunostaining of 5 week dorsal striatum with the postsynaptic marker PSD95 (red), and either VGlut1 (cortical) or VGlut2 (thalamic) as presynaptic markers (green) shows colocalized synaptic puncta (white arrows) in WT and zQ175 mice at 5 weeks of age. Bottom, Quantification of colocalized puncta number. n.s, Not significant. D, Quantification of MSN dendritic spine density in the dorsal striatum of 5 week mice.

Similar articles

Cited by

References

    1. Aguzzi A, Barres BA, Bennett ML. Microglia: scapegoat, saboteur, or something else? Science. 2013;339:156–161. doi: 10.1126/science.1227901. - DOI - PMC - PubMed
    1. Anderson CT, Sheets PL, Kiritani T, Shepherd GM. Sublayer-specific microcircuits of corticospinal and corticostriatal neurons in motor cortex. Nat Neurosci. 2010;13:739–744. doi: 10.1038/nn.2538. - DOI - PMC - PubMed
    1. Berendse HW, Groenewegen HJ. Organization of the thalamostriatal projections in the rat, with special emphasis on the ventral striatum. J Comp Neurol. 1990;299:187–228. doi: 10.1002/cne.902990206. - DOI - PubMed
    1. Cattaneo E, Zuccato C, Tartari M. Normal huntingtin function: an alternative approach to Huntington's disease. Nat Rev Neurosci. 2005;6:919–930. doi: 10.1038/nrn1806. - DOI - PubMed
    1. Crook ZR, Housman D. Huntington's disease: can mice lead the way to treatment? Neuron. 2011;69:423–435. doi: 10.1016/j.neuron.2010.12.035. - DOI - PMC - PubMed

Publication types