

What can volumes reveal about human brain evolution? A framework for bridging behavioral, histometric, and volumetric perspectives
- PMID: 25009469
- PMCID: PMC4069365
- DOI: 10.3389/fnana.2014.00051
What can volumes reveal about human brain evolution? A framework for bridging behavioral, histometric, and volumetric perspectives
Abstract
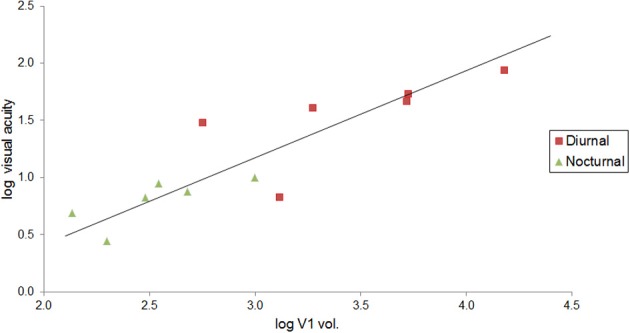
An overall relationship between brain size and cognitive ability exists across primates. Can more specific information about neural function be gleaned from cortical area volumes? Numerous studies have found significant relationships between brain structures and behaviors. However, few studies have speculated about brain structure-function relationships from the microanatomical to the macroanatomical level. Here we address this problem in comparative neuroanatomy, where the functional relevance of overall brain size and the sizes of cortical regions have been poorly understood, by considering comparative psychology, with measures of visual acuity and the perception of visual illusions. We outline a model where the macroscopic size (volume or surface area) of a cortical region (such as the primary visual cortex, V1) is related to the microstructure of discrete brain regions. The hypothesis developed here is that an absolutely larger V1 can process more information with greater fidelity due to having more neurons to represent a field of space. This is the first time that the necessary comparative neuroanatomical research at the microstructural level has been brought to bear on the issue. The evidence suggests that as the size of V1 increases: the number of neurons increases, the neuron density decreases, and the density of neuronal connections increases. Thus, we describe how information about gross neuromorphology, using V1 as a model for the study of other cortical areas, may permit interpretations of cortical function.
Keywords: brain evolution; brain volume; cognitive evolution; histology; illusions; primates; visual cortex.
Figures


Similar articles
-
An evolutionary scaling law for the primate visual system and its basis in cortical function.Nature. 2001 May 10;411(6834):193-5. doi: 10.1038/35075572. Nature. 2001. PMID: 11346795
-
Representation of the visual field in the primary visual area of the marmoset monkey: magnification factors, point-image size, and proportionality to retinal ganglion cell density.J Comp Neurol. 2013 Apr 1;521(5):1001-19. doi: 10.1002/cne.23215. J Comp Neurol. 2013. PMID: 22911425
-
Frontal cortical regions associated with attention connect more strongly to central than peripheral V1.Neuroimage. 2021 Sep;238:118246. doi: 10.1016/j.neuroimage.2021.118246. Epub 2021 Jun 7. Neuroimage. 2021. PMID: 34111516 Free PMC article.
-
Functional cell classes and functional architecture in the early visual system of a highly visual rodent.Prog Brain Res. 2005;149:127-45. doi: 10.1016/S0079-6123(05)49010-X. Prog Brain Res. 2005. PMID: 16226581 Review.
-
Variability in neuron densities across the cortical sheet in primates.Brain Behav Evol. 2011;78(1):37-50. doi: 10.1159/000327319. Epub 2011 Jun 17. Brain Behav Evol. 2011. PMID: 21691046 Review.
Cited by
-
Neuroplasticity and Crossmodal Connectivity in the Normal, Healthy Brain.Psychol Neurosci. 2021 Sep;14(3):298-334. doi: 10.1037/pne0000258. Epub 2021 Jul 29. Psychol Neurosci. 2021. PMID: 36937077 Free PMC article.
-
Neocortex expansion is linked to size variations in gene families with chemotaxis, cell-cell signalling and immune response functions in mammals.Open Biol. 2016 Oct;6(10):160132. doi: 10.1098/rsob.160132. Open Biol. 2016. PMID: 27707894 Free PMC article.
-
A quantitative analysis of cerebellar anatomy in birds.Brain Struct Funct. 2021 Nov;226(8):2561-2583. doi: 10.1007/s00429-021-02352-2. Epub 2021 Aug 6. Brain Struct Funct. 2021. PMID: 34357439
-
Sexual dimorphism in the human olfactory bulb: females have more neurons and glial cells than males.PLoS One. 2014 Nov 5;9(11):e111733. doi: 10.1371/journal.pone.0111733. eCollection 2014. PLoS One. 2014. PMID: 25372872 Free PMC article.
-
Functional properties of GABA synaptic inputs onto GABA neurons in monkey prefrontal cortex.J Neurophysiol. 2015 Mar 15;113(6):1850-61. doi: 10.1152/jn.00799.2014. Epub 2014 Dec 24. J Neurophysiol. 2015. PMID: 25540225 Free PMC article.
References
LinkOut - more resources
Full Text Sources
Other Literature Sources