

Temperature dependence of vesicular dynamics at excitatory synapses of rat hippocampus
- PMID: 25009670
- PMCID: PMC4079901
- DOI: 10.1007/s11571-014-9283-3
Temperature dependence of vesicular dynamics at excitatory synapses of rat hippocampus
Abstract
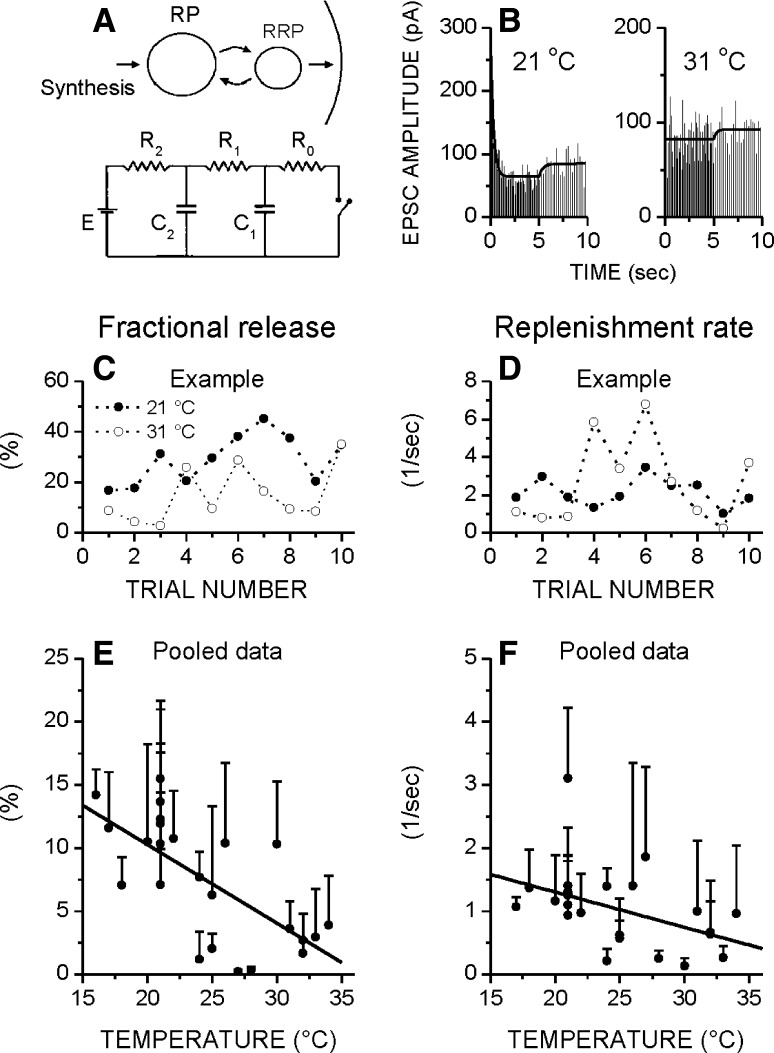
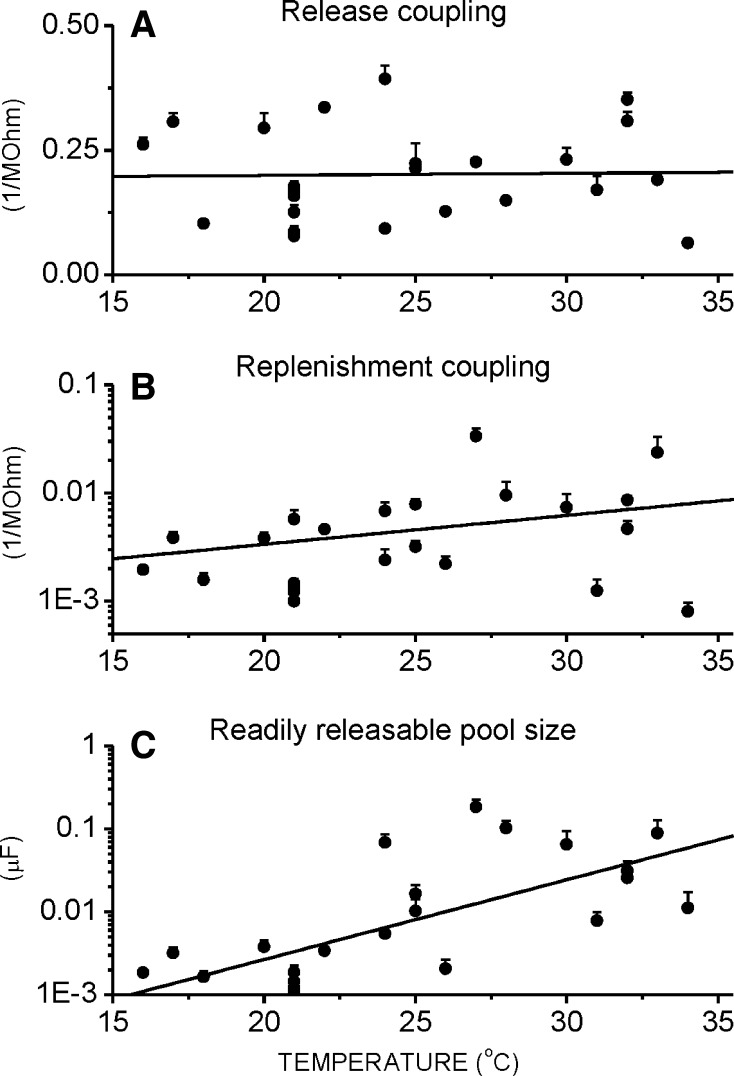
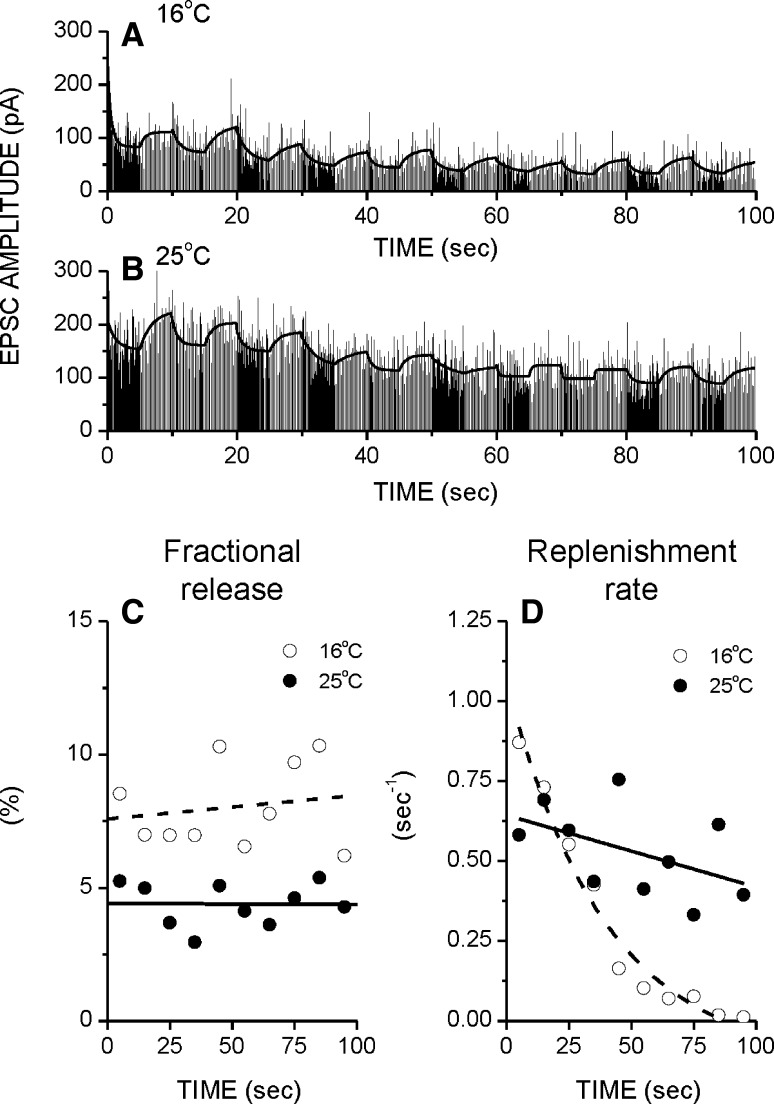
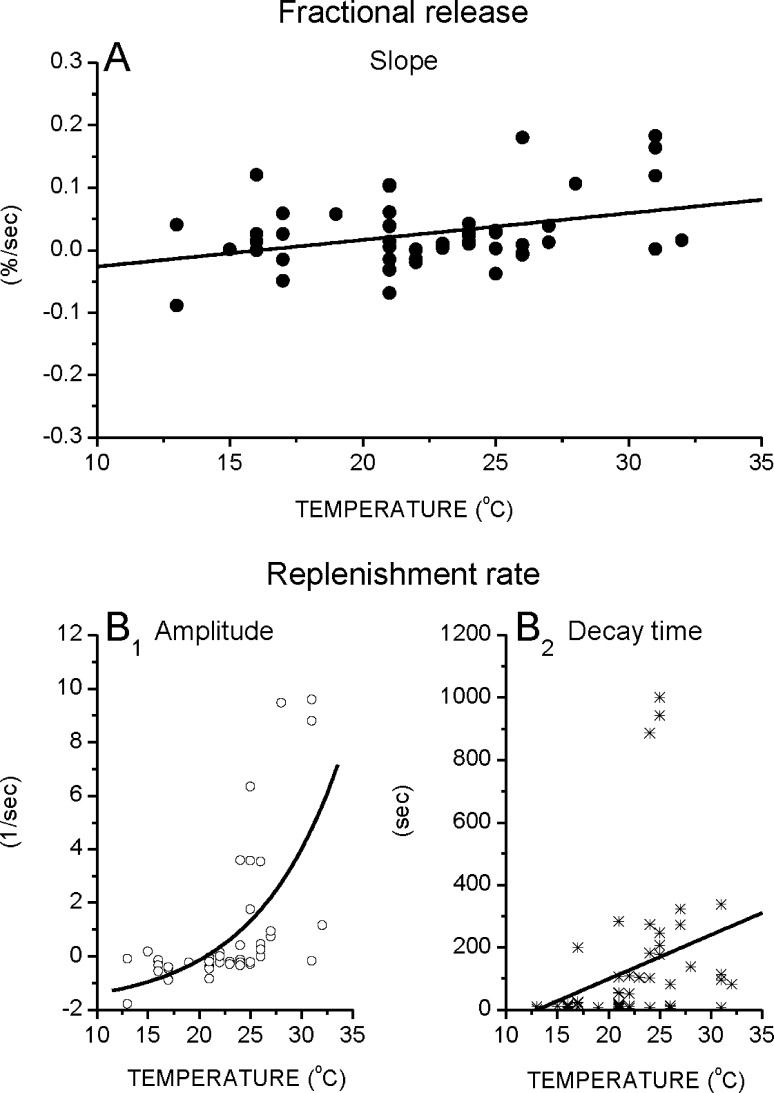
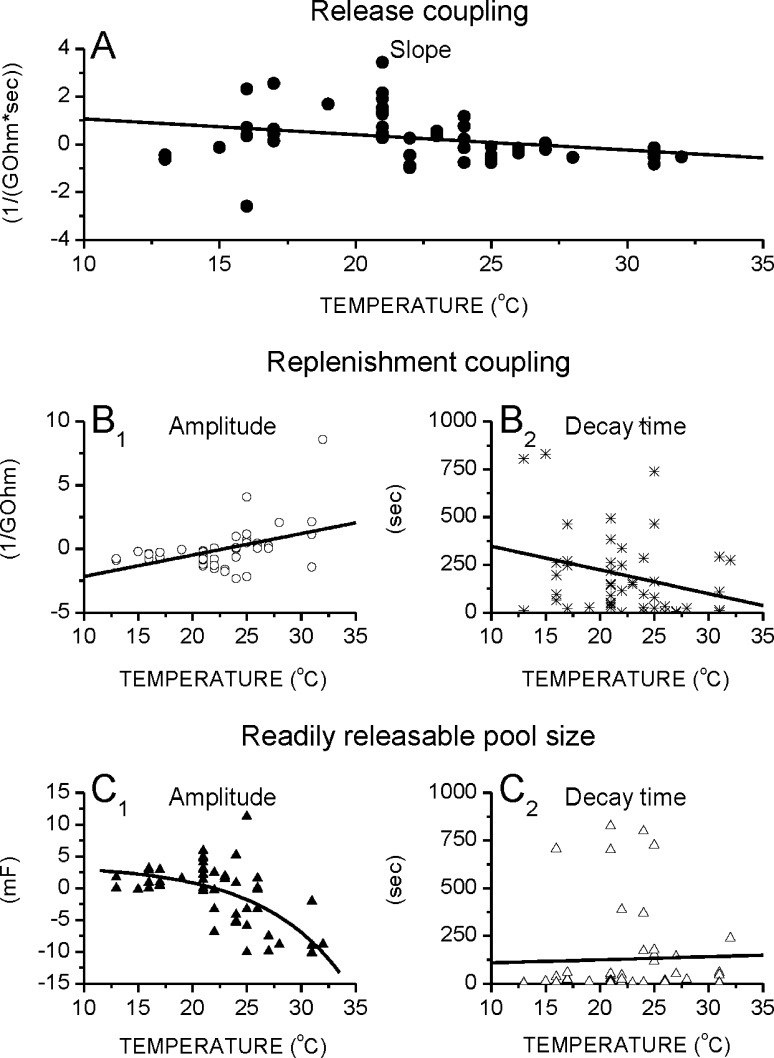
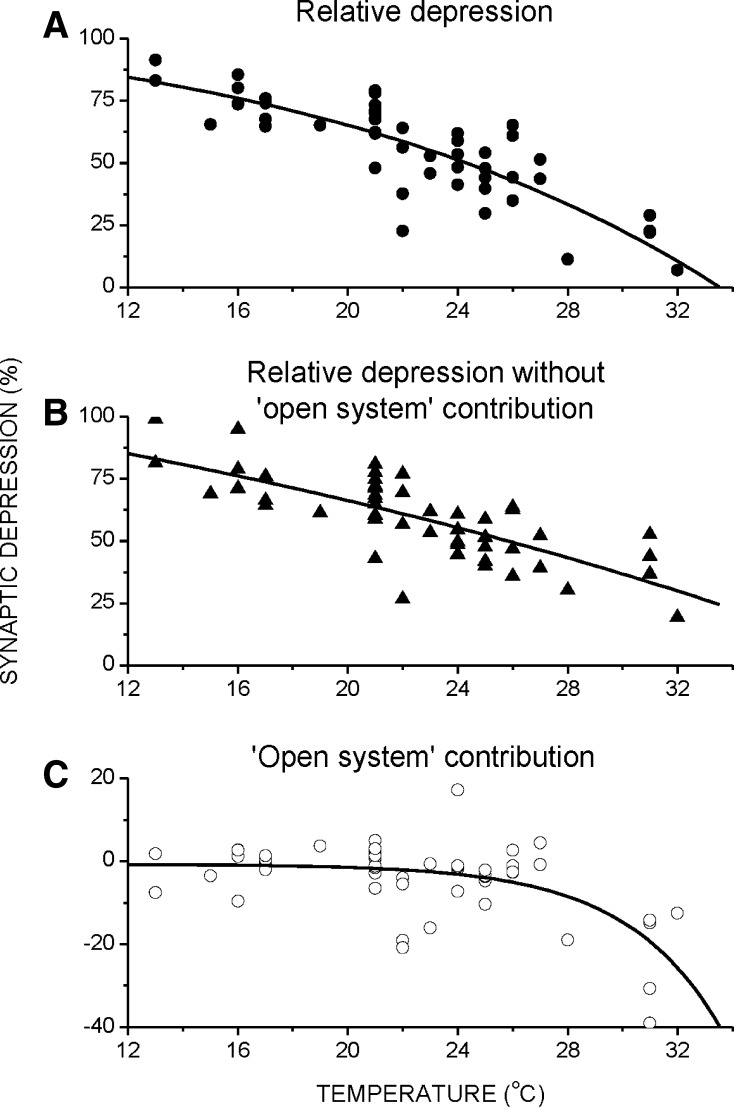
How vesicular dynamics parameters depend on temperature and how temperature affects the parameter change during prolonged high frequency stimulation was determined by fitting a model of vesicular storage and release to the amplitudes of the excitatory post-synaptic currents (EPSC) recorded from CA1 neurons in rat hippocampal slices. The temperature ranged from low (13 °C) to higher and more physiological temperature (34 °C). Fitting the model of vesicular storage and release to the EPSC amplitudes during a single pair of brief high-low frequency stimulation trains yields the estimates of all parameters of the vesicular dynamics, and with good precision. Both fractional release and replenishment rate decrease as the temperature rises. Change of the underlying 'basic' parameters (release coupling, replenishment coupling and readily releasable pool size), which the model-fitting also yields is complex. The replenishment coupling between the readily releasable pool (RRP) and resting pool increases with temperature (which renders the replenishment rate higher), but this is more than counterbalanced by greater RRP size (which renders the replenishment rate lower). Finally, during long, high frequency patterned stimulation that leads to significant synaptic depression, the replenishment rate decreases markedly and rapidly at low temperatures (<22 °C), but at high temperatures (>28 °C) the replenishment rate rises with stimulation, making synapses better able to maintain synaptic efficacy.
Keywords: Excitatory synapse; Hippocampus; Model fitting; Replenishment rate; Synaptic depression; Temperature.
Figures
Similar articles
-
Synaptic activity slows vesicular replenishment at excitatory synapses of rat hippocampus.Cogn Neurodyn. 2013 Apr;7(2):105-20. doi: 10.1007/s11571-012-9232-y. Epub 2012 Dec 14. Cogn Neurodyn. 2013. PMID: 24427195 Free PMC article.
-
Is replenishment of the readily releasable pool associated with vesicular movement?Cogn Neurodyn. 2014 Apr;8(2):99-110. doi: 10.1007/s11571-013-9264-y. Epub 2013 Jul 30. Cogn Neurodyn. 2014. PMID: 24624230 Free PMC article.
-
Recovery of vesicular storage and release parameters after high frequency stimulation in rat hippocampus.Cogn Neurodyn. 2013 Aug;7(4):311-23. doi: 10.1007/s11571-012-9240-y. Epub 2013 Jan 5. Cogn Neurodyn. 2013. PMID: 24427207 Free PMC article.
-
Physiological temperatures reduce the rate of vesicle pool depletion and short-term depression via an acceleration of vesicle recruitment.J Neurosci. 2006 Feb 1;26(5):1366-77. doi: 10.1523/JNEUROSCI.3889-05.2006. J Neurosci. 2006. PMID: 16452660 Free PMC article.
-
[Presynaptic mechanisms of learning and memory].Brain Nerve. 2008 Jul;60(7):725-36. Brain Nerve. 2008. PMID: 18646612 Review. Japanese.
Cited by
-
Right cerebral hemispheric sensitivity to pH and physiological ions in fixed post-mortem Wistar rat brains.Cogn Neurodyn. 2017 Oct;11(5):433-442. doi: 10.1007/s11571-017-9443-3. Epub 2017 Jun 7. Cogn Neurodyn. 2017. PMID: 29067131 Free PMC article.
-
High Temporal Resolution Reveals Simultaneous Plasma Membrane Recruitment of TPLATE Complex Subunits.Plant Physiol. 2020 Jul;183(3):986-997. doi: 10.1104/pp.20.00178. Epub 2020 Apr 22. Plant Physiol. 2020. PMID: 32321842 Free PMC article.
-
Nanodiamond-Quantum Sensors Reveal Temperature Variation Associated to Hippocampal Neurons Firing.Adv Sci (Weinh). 2022 Oct;9(28):e2202014. doi: 10.1002/advs.202202014. Epub 2022 Jul 25. Adv Sci (Weinh). 2022. PMID: 35876403 Free PMC article.
References
LinkOut - more resources
Full Text Sources
Other Literature Sources
Miscellaneous
