. 2014 Jun 5:2:739-48.
doi: 10.1016/j.redox.2014.06.002. eCollection 2014.

Different design of enzyme-triggered CO-releasing molecules (ET-CORMs) reveals quantitative differences in biological activities in terms of toxicity and inflammation

Affiliations

Different design of enzyme-triggered CO-releasing molecules (ET-CORMs) reveals quantitative differences in biological activities in terms of toxicity and inflammation

E Stamellou et al. Redox Biol. .

Abstract

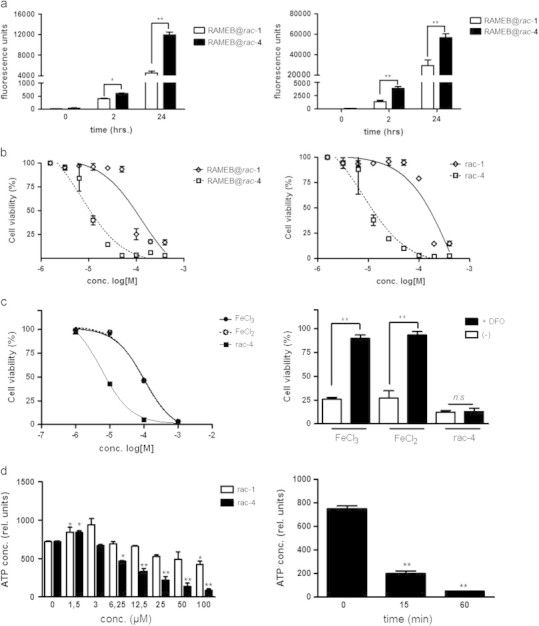
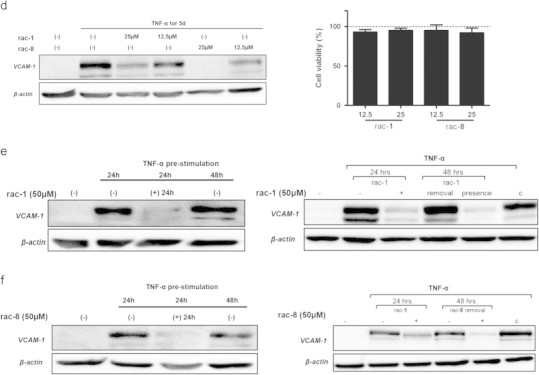
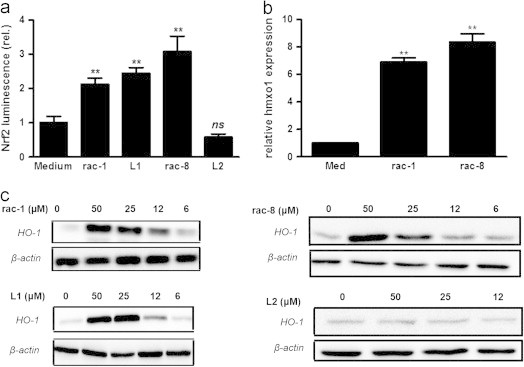
Acyloxydiene-Fe(CO)3 complexes can act as enzyme-triggered CO-releasing molecules (ET-CORMs). Their biological activity strongly depends on the mother compound from which they are derived, i.e. cyclohexenone or cyclohexanedione, and on the position of the ester functionality they harbour. The present study addresses if the latter characteristic affects CO release, if cytotoxicity of ET-CORMs is mediated through iron release or inhibition of cell respiration and to what extent cyclohexenone and cyclohexanedione derived ET-CORMs differ in their ability to counteract TNF-α mediated inflammation. Irrespective of the formulation (DMSO or cyclodextrin), toxicity in HUVEC was significantly higher for ET-CORMs bearing the ester functionality at the outer (rac-4), as compared to the inner (rac-1) position of the cyclohexenone moiety. This was paralleled by an increased CO release from the former ET-CORM. Toxicity was not mediated via iron as EC50 values for rac-4 were significantly lower than for FeCl2 or FeCl3 and were not influenced by iron chelation. ATP depletion preceded toxicity suggesting impaired cell respiration as putative cause for cell death. In long-term HUVEC cultures inhibition of VCAM-1 expression by rac-1 waned in time, while for the cyclohexanedione derived rac-8 inhibition seems to increase. NFκB was inhibited by both rac-1 and rac-8 independent of IκBα degradation. Both ET-CORMs activated Nrf-2 and consequently induced the expression of HO-1. This study further provides a rational framework for designing acyloxydiene-Fe(CO)3 complexes as ET-CORMs with differential CO release and biological activities. We also provide a better understanding of how these complexes affect cell-biology in mechanistic terms.

Keywords: Adhesion molecules; CO, carbon monoxide; Carbon monoxide; ET-CORM, enzyme-triggered carbon monoxide-releasing molecule; Endothelial cells; Enzyme-triggered CORMs; HO-1, haem oxygenase 1; HUVEC, human umbilical vein endothelial cells; NFκΒ, nuclear factor kappa-light-chain enhancer of activated B-cells; Nrf2, nuclear factor(erythroid-derived); TNF-α, tumour necrosis factor alpha; VCAM-1, vascular cell adhesion molecule 1.


Figures

Fig. 1
Fig. 1
Chemical structure of the compounds used in the study. The two cyclohexenone-derived ET-CORMs, i.e. rac-1 and rac-4, and the one derived from cyclohexanedione (rac-8) are depicted. The corresponding hydrolysis products, i.e. enones, of rac-1 and rac-4 (L1) and of rac-8 (L2 and L3) were used to dissect if the hydrolysis products are partly underlying the biological activity of ET-CORMs.
Fig. 2
Fig. 2
(a) CO release from rac-1 and rac-4 in cyclodextrin formulation RAMEB@rac-1 and RAMEB@rac-4 respectively was assessed by measuring COP-1 fluorescence intensity. To this end, COP-1 (10 μΜ), RAMEB@rac-1 and RAMEB@rac-4 (100 µM for both) and pig liver esterase (3 U/ml) (graph to the left) or cell lysates from HUVEC (10 µg/ml) (graph to the right) were incubated in 96-well plates for various timepoints. In all experiments controls were included by omitting pig liver esterase or cell lysate. Fluorescence intensity of the controls was subtracted from the fluorescence intensity of each condition. The results of three independent experiments are depicted as mean fluorescence intensity in arbitrary units±SD, P<0.05, ⁎⁎P<0.01. (b) HUVEC were grown in 96-well plates until confluence and subsequently stimulated for 24 h with different concentrations (0–200 µM) of rac-1, or rac-4 either dissolved in DMSO (graph to the left) or as cyclodextrin formulation RAMEB@rac-1 and RAMEB@rac-4 (graph to the right). Toxicity was assessed by MTT assay, each concentration was tested in triplicate in all experiments. The results of 3 independent experiments are expressed as mean% of cell viability±SD, relative to the untreated HUVEC. The corresponding EC50 [µM] were rac-1 vs. rac-4: 448.9±50.23 vs. 8.2±1.5, EC50 [µM] RAMEB@rac-1 vs. RAMEB@rac-4: 457.3±8.23 vs. 7.22±1.12. (c) Serial dilutions of FeCl2 (open circles, dotted line) or FeCl3 (closed circles) and rac-4 (closed squares) were added to HUVEC grown in 96-well plates and toxicity was measured similar as described above. To test if iron-mediated toxicity was abrogated in the presence of deferoxamine, cells were stimulated with 125 µM of FeCl2, FeCl3 or rac-4 in the presence (filled bars) or absence (open bars) of deferoxamine (80 µM) (graph to the left). The plates were incubated for 24 h and cell viability was assessed by MTT assay as described. The results of 3 independent experiments are expressed as mean% of cell viability±SD, relative to the untreated HUVEC. (d) HUVEC were grown in 24-well plates until confluence, treated with rac-4 or rac-1 for 24 h. Subsequently intracellular ATP was measured (graph to the left). In separate experiments, 50 µM of rac-4 was added to HUVEC and ATP was measured at 0, 15 and 60 min after addition of ET-CORM (graph to the right). ATP was measured using an ATP-driven luciferase assay as described in the methods section. The results of 4 independent experiments are expressed as mean relative light units (RLU)±SD. In all experiments each condition was tested in triplicates. P<0.05, ⁎⁎P<0.01 vs. the untreated HUVEC.
Fig. 3
Fig. 3
(a) To demonstrate that rac-4 also inhibits VCAM-1 expression at low-non-toxic concentrations, HUVEC were stimulated with TNF-α for 24 h in the presence or absence of different concentrations of rac-4. Note that at these concentrations inhibition of VCAM-1 occurs. VCAM-1 expression was assessed by Western blotting, β-actin was used as loading control. (b) HUVEC were grown in 96-well plates until confluency and subsequently incubated with serial dilutions (0–400 µM) of rac-1 (graph to the left) or rac-8 (graph to the right). Cell viability was assessed at different time points (24, 48 and 72 h) by MTT as described. All experimental conditions were tested in triplicates in at least 5 independent experiments. P<0.01 with respect to untreated cells. (c) Cells were stimulated with TNF-α for the indicated time periods in the presence or absence of 50 µM of rac-1, L1 (panels to the left), rac-8 or L2 (panels to the right). Compound L3 (Fig. 1) as an additional possible hydrolysis/disintegration product of rac-8 was tested in various experiments and gave similar results as L2 (data not shown). Cells that were not stimulated with TNF-α served as control. VCAM-1 expression was assessed by Western blotting; β-actin was used as loading control. (d) Cells were stimulated with TNF-α for 5 days in the presence or absence of 25 or 12.5 µM of rac-1 or rac-8. Cells that were not stimulated with TNF-α served as control. VCAM-1 expression was assessed by Western blotting; β-actin was used as loading control (panel to the left). HUVEC were grown in 96-well plates until confluency and subsequently incubated with 12.5 or 25 µM of rac-1 or rac-8. Cell viability was assessed by MTT assay (panel to the right) and was expressed as % viable cells relative to the untreated cells. All experimental conditions were tested in triplicates in at least 5 independent experiments. (e, f) HUVEC were stimulated for 24 h with TNF-α (10 ng/ml). Hereafter, 50 µM of rac-1 (e) or rac-8 (f) was added without changing the medium and the cells were cultured for additional 24 h. VCAM-1 expression was assessed at 24 h of TNF-α stimulation to assure that it was present before addition of rac-1 or rac-8 and after 48 h to test if addition of rac-1 or rac-8 was still able to affect VCAM-1 expression. Cells that did not receive rac-1/rac-8 served as control. Cells that were not stimulated with TNF-α were included to demonstrate VCAM-1 induction (panels to the left). In separate experiments cells were stimulated for 24 h with TNF-α (10 ng/ml) in the presence or absence of 50 µM of rac-1 or rac-8. After 24 h in separate wells the medium was exchanged for medium that only contained TNF-α (10 ng/ml) (removal) or medium that contained both TNF-α and rac-1 or rac-8 (presence) and cells were allowed to grow for additional 24 h. VCAM-1 expression was assessed at 24 h to demonstrate that rac-1 inhibits VCAM-1 expression and after 48 h to demonstrate that VCAM-1 expression reappeared after removal of rac-1 and rac-8 as well. Cell cultures grown for 48 h in the continuous presence of TNF-α (c) and cells that were not stimulated with TNF-α were also included (panels to the right). For (c) to (f) data of a representative experiment are shown. At least 4 independent experiments have been performed with essentially the same results.
Fig. 3
Fig. 3
(a) To demonstrate that rac-4 also inhibits VCAM-1 expression at low-non-toxic concentrations, HUVEC were stimulated with TNF-α for 24 h in the presence or absence of different concentrations of rac-4. Note that at these concentrations inhibition of VCAM-1 occurs. VCAM-1 expression was assessed by Western blotting, β-actin was used as loading control. (b) HUVEC were grown in 96-well plates until confluency and subsequently incubated with serial dilutions (0–400 µM) of rac-1 (graph to the left) or rac-8 (graph to the right). Cell viability was assessed at different time points (24, 48 and 72 h) by MTT as described. All experimental conditions were tested in triplicates in at least 5 independent experiments. P<0.01 with respect to untreated cells. (c) Cells were stimulated with TNF-α for the indicated time periods in the presence or absence of 50 µM of rac-1, L1 (panels to the left), rac-8 or L2 (panels to the right). Compound L3 (Fig. 1) as an additional possible hydrolysis/disintegration product of rac-8 was tested in various experiments and gave similar results as L2 (data not shown). Cells that were not stimulated with TNF-α served as control. VCAM-1 expression was assessed by Western blotting; β-actin was used as loading control. (d) Cells were stimulated with TNF-α for 5 days in the presence or absence of 25 or 12.5 µM of rac-1 or rac-8. Cells that were not stimulated with TNF-α served as control. VCAM-1 expression was assessed by Western blotting; β-actin was used as loading control (panel to the left). HUVEC were grown in 96-well plates until confluency and subsequently incubated with 12.5 or 25 µM of rac-1 or rac-8. Cell viability was assessed by MTT assay (panel to the right) and was expressed as % viable cells relative to the untreated cells. All experimental conditions were tested in triplicates in at least 5 independent experiments. (e, f) HUVEC were stimulated for 24 h with TNF-α (10 ng/ml). Hereafter, 50 µM of rac-1 (e) or rac-8 (f) was added without changing the medium and the cells were cultured for additional 24 h. VCAM-1 expression was assessed at 24 h of TNF-α stimulation to assure that it was present before addition of rac-1 or rac-8 and after 48 h to test if addition of rac-1 or rac-8 was still able to affect VCAM-1 expression. Cells that did not receive rac-1/rac-8 served as control. Cells that were not stimulated with TNF-α were included to demonstrate VCAM-1 induction (panels to the left). In separate experiments cells were stimulated for 24 h with TNF-α (10 ng/ml) in the presence or absence of 50 µM of rac-1 or rac-8. After 24 h in separate wells the medium was exchanged for medium that only contained TNF-α (10 ng/ml) (removal) or medium that contained both TNF-α and rac-1 or rac-8 (presence) and cells were allowed to grow for additional 24 h. VCAM-1 expression was assessed at 24 h to demonstrate that rac-1 inhibits VCAM-1 expression and after 48 h to demonstrate that VCAM-1 expression reappeared after removal of rac-1 and rac-8 as well. Cell cultures grown for 48 h in the continuous presence of TNF-α (c) and cells that were not stimulated with TNF-α were also included (panels to the right). For (c) to (f) data of a representative experiment are shown. At least 4 independent experiments have been performed with essentially the same results.
Fig. 4
Fig. 4
(a) HUVEC were transduced by lentiviral particle with an inducible promoter construct containing dual NFκB-consensus motifs and with a constitutively active CMV-driven promoter construct both cloned behind luciferase cDNA. Two days after transduction the cells were stimulated for 24 h with TNF-α (10 ng/ml) in the presence of absence of 50 μΜ rac-1, rac-8, L1 (cyclohexenone) or L2 (cyclohexanedione), respectively. Hereafter luciferase expression was measured as described in the methods section. Inducible luciferase expression was normalized for constitutively expressed luciferase to control for differences in transduction efficiency. The data of 4 independent experiments are expressed as mean fold increase±SD relative to TNF-α stimulated cells. ns: not significant, P<0.01 vs. TNF-α stimulated cells. (b) HUVEC were treated for 4 h with 50 µM rac-1 or rac-8 before stimulation with TNF-α. ET-CORMs were present during stimulation. Cell lysates were directly prepared after 15, 30, 45 and 60 min of TNF-α stimulation and subjected to electrophoresis and Western blotting for analysis of ΙκBα expression and β-actin as loading control. Cells that were not stimulated with TNF-α were included to assess constitutive levels of ΙκBα. The data of a representative experiment is depicted. At least 4 independent experiments have been performed with essentially the same results.
Fig. 5
Fig. 5
(a) HUVEC were transduced by lentiviral particle with an inducible promoter construct containing dual ARE motifs and with a constitutively active CMV-driven promoter construct both cloned behind luciferase cDNA. Two days after transduction the cells were treated for 24 h with 50 μΜ rac-1, rac-8, L1 (cyclohexenone) or L2 (cyclohexanedione) respectively. Hereafter, luciferase expression was measured as described in the methods section. Inducible luciferase expression was normalized for constitutively expressed luciferase to control for differences in transduction efficiency. The data of 4 independent experiments are expressed as mean fold increase±SD relative to untreated cells (medium). ns: not significant, P<0.01, vs. untreated cells (medium). (b) HUVEC were treated for 24 h with 50 µM rac-1 or rac-8 or left untreated. Hereafter, total RNA was isolated and the expression of HO-1 (hmxo1) was quantitated by qPCR and normalized for equal GAPDH expression. Normalized hmxo1 mRNA levels are expressed as mean fold increase±SD relative to untreated cells (medium), P<0.01, vs. untreated control. (c) HUVEC were treated for 24 h with the indicated concentrations of rac-1, L1, rac-8 or L2. Hereafter, proteins extracts were made and HO-1 expression was assessed by western blotting, β-actin was used as loading control. The data of a representative experiment are depicted. At least 4 independent experiments have been performed with essentially the same results.

References

    1. Sjostrand T. Endogenous formation of carbon monoxide: the CO concentration in the inspired and expired air of hospital patients. Acta Physiologica Scandinavica. 1951;22:137–141. 14933136 - PubMed
    1. Sjostrand T. The in vitro formation of carbon monoxide in blood. Acta Physiologica Scandinavica. 1952;24:314–332. 14952314 - PubMed
    1. Coburn R.F., Blakemore W.S., Forster R.E. Endogenous carbon monoxide production in man. Journal of Clinical Investigation. 1963;42:1172–1178. 14021853 - PMC - PubMed
    1. Sjostrand T. The formation of carbon monoxide by in vitro decomposition of haemoglobin in bile pigments. Acta Physiologica Scandinavica. 1952;26:328–333. 13007488 - PubMed
    1. Tenhunen R., Marver H.S., Schmid R. The enzymatic conversion of heme to bilirubin by microsomal heme oxygenase. Proceedings of the National Academy of Sciences of the United States of America. 1968;61:748–755. 4386763 - PMC - PubMed

Publication types

MeSH terms